Sequential multiplane two-dimensional transesophageal echocardiographic (2D TEE) images provide a detailed assessment of cardiac lesions and are ideal for three-dimensional transesophageal echocardiographic (3D TEE) reconstruction. The first study using a multiplane 2D TEE probe to perform 3D reconstruction was published in 1992, from our laboratory. Basically, a selected area of interest was placed in the center of the imaging sector and images acquired by rotating the transducer from 0° to 180° in small increments of 1° to 3°, taking care to keep the probe fixed in one position and the patient lying still. The acquired images were then transferred to an offline computer (TomTec Company, Munich, Germany) for subsequent 3D reconstruction. A more recent innovation enables 3D reconstruction on the same ultrasound system that is used to acquire sequential 2D images. Also, the time taken to reconstruct a 3D image has been reduced to about 1 minute. To minimize artifacts in the 3D TEE reconstructed images, it is important to acquire images only in a particular phase of respiration, and at comparable RR intervals. This is often done by setting up a gating window utilizing an online histogram based on the patient's heart rate.
An important clinical application of 3D TEE reconstruction is the assessment of left ventricular volumes and ejection fraction without making an assumption regarding the geometric shape of the left ventricle (LV). This improves accuracy and reduces intra- and inter-observer variability, an important limitation of 2D echocardiography. An early application of 3D TEE was accurate assessment of aortic valve morphology and orifice area in patients with aortic stenosis undergoing 2D TEE. The 3D volumetric data set permits short axis sections across the aortic valve at any desired angle, resulting in the identification of the smallest aortic valve orifice area for planimetry, usually located at the tip of the aortic valve. With 2D TEE, the probe is moved up and down the esophagus to identify the smallest orifice. 3D TEE has the advantage of being able to examine any planes that would increase the likelihood that the imaging plane is exactly parallel to the aortic orifice, maximizing the accuracy of stenotic orifice area measurement.
3D TEE is superior to 2D TEE in the detection of individual scallop/segment prolapse of the mitral valve. Accurate identification of scallop or segment prolapse and its extent is crucial when considering patients for mitral valve repair. With 3D TEE, short-axis cuts can be taken at any level and the atrial surfaces of both leaflets viewed en face. Therefore, individual scallop or segment prolapse and its extent can be easily assessed. This information is important for the surgeon who may find it difficult to estimate the true extent of any scallop or segment prolapse in a heart devoid of blood. As discussed in Chapter 2, multiplane 2D TEE has important limitations in the assessment of individual scallop or scallop prolapse.
3D TEE is also superior to 2D TEE in assessing the dimensions of intracardiac masses such as infective vegetations, thrombi, atherosclerotic plaques, tumors, and intracardiac defects such as atrial septal defects. In several instances, the maximum size of these lesions has been underestimated by multiplane 2D TEE, as compared to 3D TEE and surgery or pathologic measurements. Using multiplane 2D TEE, the maximal dimension of a lesion can be obtained only if its long axis lies exactly parallel to the ultrasonic beam as it rotates from 0° to 180°; otherwise the maximum linear dimension will be underestimated. On the other hand, with 3D TEE, any imaging plane can be interrogated in the search for the maximum lesion dimension. 3D TEE also permits accurate assessment of volumes of intracardiac masses. Unlike multiplane 2D TEE, 3D TEE enables en face viewing of intracardiac defects and openings in congenital membranes such as cor triatriatum sinister, permitting accurate assessment of their shape and size. These aspects are of practical clinical importance. For instance, the size of infective vegetations correlates with embolic potential and patient prognosis and information on the exact size of an atrial septal defect is important during catheter closure of the defect.
Another example of the utility of 3D TEE in providing anatomic definition has been the assessment of Lambl's excrescences on the aortic valve. In a few patients studied by us, more Lambl's excrescences were found using 3D TEE than using 2D TEE. We have also found 3D TEE to be useful in providing a more secure diagnosis of an aortic valve papillary fibroelastoma. Multiple small projections from the tumor and bright echoes in the middle of the stalk, consistent with fronds and a collagenous central core, both pathologically characteristic of a fibroelastoma, were better seen using 3D TEE than using multiplane 2D TEE.
3D TEE has supplemented multiplane 2D TEE in the assessment of aortic dissection, specifically in patients in whom it is difficult to distinguish a dissection flap from an imaging artifact. In these instances, misdiagnosis has occurred. With 3D TEE, the dissection flap is seen in 3D as a sheet of tissue and not a linear structure, improving the specificity of diagnosis as compared to 2D TEE. Because 3D TEE provides en face views of prosthetic valves, abnormalities such as suture dehiscence and abscesses can be well visualized and their exact location in relation to the prosthesis can be accurately identified. Because the orientation of TEE images does not correspond to the surgeon's view in the operating room, we have found it useful to describe images in relation to a surgical clock corresponding to the surgeon's field of view as he stands on the right side of the patient. When the surgeon looks at the mitral prosthesis, the left atrial appendage is positioned at 9 o'clock or 10 o'clock, with the aorta at 12 o'clock. These landmarks can be used by the echocardiographer to describe the exact location of abnormalities such as suture dehiscence. For the aortic prosthesis, the clock is arranged with the atrial septum and left coronary artery at 7 o'clock and 11 o'clock positions, respectively. Important landmarks during the surgeon's exposure of the tricuspid valve and right atrium are the inferior and superior vena cavae at the 4 o'clock and 8 o'clock to 9 o'clock, respectively.
3D TEE has also been useful in evaluating patients with left ventricular pseudoaneurysms. In one such patient with associated severe mitral regurgitation, 3D TEE clearly showed localized distortion of the mitral annulus produced by the pseudoaneurysm. Because there was no other obvious etiology to explain the presence of severe mitral regurgitation, it was decided not to repair or replace the mitral valve. Decompression of the pseudoaneurysm following repair normalized the mitral annulus, resulting in almost total abolition of mitral regurgitation. Therefore, in this patient, 3D TEE identified a localized distortion of the mitral annulus responsible for the presence of severe mitral regurgitation.
When examining proximal and/or mid coronary arteries by multiplane 2D TEE, only small segments are usually visualized in any given view as the ultrasonic 2D plane moves in and out of the plane of the coronary arteries. This problem is alleviated by 3D TEE since all visualized segments are contained within the 3D volumetric data set, which can be cropped suitably to bring longer segments of the coronary arteries into view. Also, sections can be taken exactly parallel to the short axis of a given coronary artery to ascertain the presence or absence of significant stenosis. With multiplane 2D TEE, an eccentrically located plaque or an oblique plane can create an impression of severe stenosis when none may be present. Therefore, 3D TEE is a useful adjunct to multiplane 2D TEE in the evaluation of coronary arteries for stenosis.
In conclusion, in many patients, 3D TEE provides important information beyond that provided by 2D TEE.
|
|
|
FIGURE 12.1. Multiplanar transesophageal two-dimensional images of the left ventricle. LA, left atrium; LV, left ventricle; RA, right atrium; RV, right ventricle. (Reproduced with permission from Nanda NC, Pinheiro L, Sanyal R, et al. Multiplane transesophageal echocardiographic imaging and three-dimensional reconstruction: a preliminary study. Echocardiography 1992;9:667–676. ) |
|
|
|
FIGURE 12.2. Three-dimensional reconstruction of the left ventricle using sequential planes obtained from multiplane transesophageal examination in an adult patient.For three-dimensional reconstruction, all frames were obtained in mid-diastole using the mitral valve motion as the reference. A shows the “rib cage” on the left. B and C show the “volume cast” of the left ventricular cavity. (Reproduced with permission from Nanda NC, Pinheiro L, Sanyal R, et al. Multiplane transesophageal echocardiographic imaging and three-dimensional reconstruction: a preliminary study. Echocardiography 1992;9:667–676. ) |
|
|
|
FIGURE 12.3. Transesophageal three-dimensional reconstruction of normal mitral valve. A,B. Mitral valve (MV) opening is visualized from the atrial aspect. Left: closed MV;Right: opened MV. (Reproduced with permission from Nanda NC and Sorrell VL, eds. Atlas of three-dimensional echocardiography. Malden, MA: Blackwell Futura, 2002:30. ) |
|
|
|
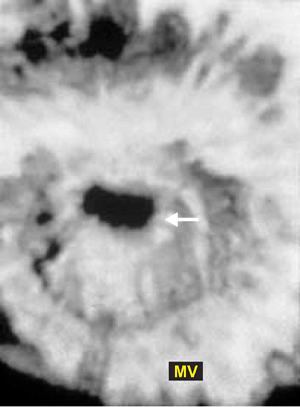
FIGURE 12.4. Transesophageal three-dimensional reconstruction of mitral valve in mitral stenosis. The stenotic orifice (arrow) is well seen. MV, Mitral valve (Reproduced with permission from Nanda NC and Sorrell VL, eds. Atlas of three-dimensional echocardiography. Malden, MA: Blackwell Futura, 2002:54. ) |
|
|
|
FIGURE 12.5. Transesophageal three-dimensional reconstruction of normal aortic valve. A. When the aortic valve (AV) is viewed from the aortic side in short axis, the aortic sinuses appear as saucer-shaped depressions in the closed position in diastole. B. When viewed from the left ventricle (LV) the bulge produced by the aortic sinuses in diastole is evident. C,D. When the AV is viewed from a position higher in the supravalvar aorta, the AV is viewed together with a segment of the proximal ascending aorta (AA) in both diastole (C) and systole (D). The arrow points to the orifice of the left main coronary artery. E. Schematic showing the three positions used by us to view the AV. 1, aortic root close to the AV; 2, LV close to the AV; 3, supravalvar aorta. F,G. Show the AV in the open position in systole. The aortic orifice area obtained by planimetry (G) measured 4.23 cm2, which is within the normal range. H,I. The AV and both LV and right ventricle (RV) are viewed in long axis in diastole (H) and systole (I). AO, aorta; IAS, interatrial septum;LA, left atrium; MV, mitral valve; RA, right atrium; RVO, right ventricular outflow tract; SVC, superior vena cava; VS, ventricular septum. (Reproduced with permission from Nanda NC, Roychoudhury D, Chung SM, et al. Quantitative assessment of normal and stenotic aortic valve using transesophageal three-dimensional echocardiography. Echocardiography 1994;11:617–625. ) |
|
|
|
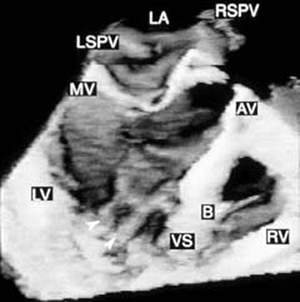
FIGURE 12.6. Three-dimensional reconstruction of the ventricle and right ventricle in the same patient shown in Figure 12.5. Arrowheads point to papillary muscles in the left ventricle. B, moderator band in the right ventricle; AV, aortic valve; LA, left atrium; LSPV, left superior pulmonary vein; LV, left ventricle; MV, mitral valve; RSPV, right superior pulmonary vein; RV, right ventricle; VS, ventricular septum. (Reproduced with permission from Nanda NC, Roychoudhury D, Chung SM, et al. Quantitative assessment of normal and stenotic aortic valve using transesophageal three-dimensional echocardiography. Echocardiography 1994;11:617–625. ) |
|
|
|
FIGURE 12.7. Transesophageal three-dimensional reconstruction of stenotic aortic valve. A,B. The aortic valve (AV) shows multiple echo dense areas indicative of severe thickening and calcification. Although the AV is considerably distorted, three leaflets are easily identified in systole. The aortic orifice is very small and measured 0.7 cm2 by planimetry (B). LA, left atrium; RVO, right ventricular outflow tract. (Reproduced with permission from Nanda NC, Roychoudhury D, Chung SM, et al. Quantitative assessment of normal and stenotic aortic valve using transesophageal three-dimensional echocardiography. Echocardiography 1994;11:617–625. ) |
|
|
|
FIGURE 12.8. Severely calcified tricuspid aortic valve stenosis. A. Diastolic frame. Aortic valve (AV) is seen in the closed position. B. Systolic frame. AV is seen in the open position. AV orifice area measured 0.4 cm2 by planimetry. Note severe and extensive AV calcification. AVA, AV area; LA, left atrium; RA, right atrium; RVO, right ventricular outflow tract. (Reproduced with permission from Dod HS, Nanda NC, Agrawal GG, et al. Three-dimensional transesophageal echocardiographic assessment of aortic valve pathology. Am J Geriatr Cardiol 2003;12:209–213. ) |
|
|
|
FIGURE 12.9. A,B. Fibrotic aortic stenosis in an adult with dwarfism. Three-dimensional reconstruction. The tricuspid aortic valve (AV) is shown in the closed position in diastole (A) and in the open position in systole (B). Note the central stenotic orifice. LA, left atrium; PA, pulmonary artery; RA, right atrium; RVO, right ventricular outflow tract. (Reproduced with permission from Huang WY, Nanda NC, Miller A, et al. Fibrotic aortic stenosis in a patient with dwarfism quadricuspid aortic valve. Echocardiography 2000;17:701–704. ) |
|
|
|
FIGURE 12.10. Schematic diagram of the segmental classification used to describe the prolapse of mitral valve, as viewed by the surgeon. A1, A2, and A3, anterolateral, middle, and posteromedial segments of anterior mitral valve (MV) leaflet; AO, aorta; LAA, left atrial appendage; P1, P2, and P3, anterolateral, middle, and posteromedial scallops of posterior mitral valve (PMV) leaflet. (Reproduced with permission from Ahmed S, Nanda NC, Miller AP, et al. Usefulness of transesophageal three-dimensional echocardiography in the identification of individual segment/scallop prolapse of the mitral valve. Echocardiography 2003a;20:203–209. ) |
|
|
|
FIGURE 12.11. Usefulness of transesophageal three-dimensional echocardiography in the identification of individual segment/scallop prolapse of the mitral valve. A,B.Long (A) and oblique (B) axis views demonstrating prominent posterior mitral valve leaflet (PML) prolapse (arrows). C. Systolic short axis view of MV demonstrating P2 prolapse (dotted line) in another patient. A1, A2, A3, anterolateral, middle, and posteromedial segments of anterior mitral valve leaflet (AML); AO, aorta; LA, left atrium; LAA, left atrial appendage; LV, left ventricle; LVO, left ventricular outflow tract; P1, P2, and P3, anterolateral, middle, and posteromedial scallops of PML leaflet; RA/RV, right atrium/right ventricle. (Reproduced with permission from Ahmed S, Nanda NC, Miller AP, et al. Usefulness of transesophageal three-dimensional echocardiography in the identification of individual segment/scallop prolapse of the mitral valve. Echocardiography 2003a;20:203–209. ) |
|
|
|
FIGURE 12.12. A. Three-dimensionally reconstructed short-axis and long-axis views of the mitral valve (MV) in one of our patients showing multiple vegetations (arrows). B. A large vegetation (arrowheads) is seen on the posterior mitral leaflet (PML). AML, anterior mitral leaflet; AO, aorta; LV, left ventricle. (Reproduced with permission from Nanda NC, Abd-El Rahman SM, Khatri G, et al. Incremental value of three-dimensional echocardiography over transesophageal multiplane two-dimensional echocardiography in qualitative and quantitative assessment of cardiac masses and defects. Echocardiography 1995;12:619–628. ) |
|
|
|
FIGURE 12.13. A large vegetation (left, arrow) is noted on the aortic valve (AV) together with an abscess cavity (right, arrow) involving the mitral-aortic intervalvular fibrosa.LA, left atrium; LVO, left ventricular outflow tract; RVO, right ventricular outflow tract. (Reproduced with permission from Nanda NC, Abd-El Rahman SM, Khatri G, et al. Incremental value of three-dimensional echocardiography over transesophageal multiplane two-dimensional echocardiography in qualitative and quantitative assessment of cardiac masses and defects. Echocardiography 1995;12:619–628. ) |
|
|
|
FIGURE 12.14. A. Three-dimensionally reconstructed images of the aortic valve viewed in long axis showing multiple abscesses (arrows) involving the aortic root region, ventricular septum (VS), mitral-aortic intervalvular fibrosa, and body of the anterior mitral leaflet (AML). B. Short-axis view in the same patient showing a large perforation (1) in the noncoronary cusp (NCC), extensive destruction of the left coronary cusp (LCC), and a large central area of noncoaptation (2) of aortic valve (AV) leaflets in diastole (left). The systolic frame is shown on the right. LA, left atrium; LV, left ventricle; RCC, right coronary cusp; RV, right ventricle. (Reproduced with permission from Nanda NC, Abd-El Rahman SM, Khatri G, et al. Incremental value of three-dimensional echocardiography over transesophageal multiplane two-dimensional echocardiography in qualitative and quantitative assessment of cardiac masses and defects. Echocardiography 1995;12:619–628. ) |
|
|
|
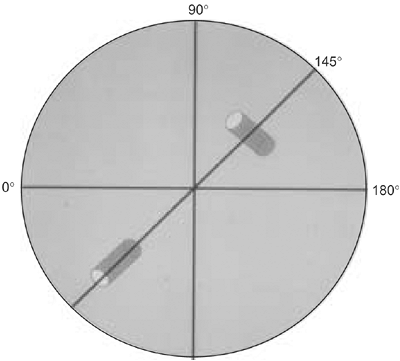
FIGURE 12.15. Schematic diagram demonstrating that the maximum dimension of an object (in this case, a cylinder) can be obtained only if the ultrasound beam cuts through its longest dimension (true long axis) when using a multiplane probe. However, when the two-dimensional planes (dotted lines) are stacked together to obtain a three-dimensional image, the object (cylinder), including its long axis, can be viewed completely, even though it is not oriented parallel to the ultrasonic beam as it is rotated from 0° to 180°. As demonstrated here, it is not possible to image the true long axis of an intracardiac mass lesion or defect (such as an atrial septal defect) using multiplane two-dimensional transesophageal echocardiograpy unless it lies exactly parallel to the ultrasound beam as it is rotated from 0° to 180°. Therefore, the maximum size of a mass or defect may be underestimated by multiple two-dimensional transesophageal echocardiography. On the other hand, with three-dimensional transesophageal reconstruction, multiple sequential two-dimensional images are stacked to reconstruct the entire object in three dimensions, permitting accurate assessment of all its dimensions. (Reproduced with permission from Nanda NC, Abd-El Rahman SM, Khatri G, et al. Incremental value of three-dimensional echocardiography over transesophageal multiplane two-dimensional echocardiography in qualitative and quantitative assessment of cardiac masses and defects. Echocardiography 1995;12:619–628. ) |
|
|
|
FIGURE 12.16. Lambl's excrescences on the aortic valve. Transesophageal three-dimensional echocardiographic reconstruction. Aortic valve (AV) viewed in short axis from the aortic side. Three excrescences are noted: one on the noncoronary cusp (1) and two on the left cusp (2 and 3). Two-dimensional imaging showed only two. LA, left atrium; RA, right atrium; RVO, right ventricular outflow tract. (Reproduced with permission from Samal AK, Nanda NC, Thakur AC, et al. Three-dimensional echocardiographic assessment of Lambl's excrescences on the aortic valve. Echocardiography 1999;16:437–441. ) |
|
|
|
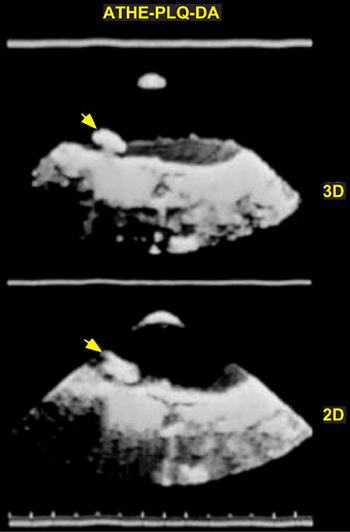
FIGURE 12.17. Atheromatous plaque (arrow) in the aortic arch seen in three dimensions (top). The two-dimensional image is shown at the bottom for comparison. (Reproduced with permission from Nanda NC, Abd-El Rahman SM, Khatri G, et al. Incremental value of three-dimensional echocardiography over transesophageal multiplane two-dimensional echocardiography in qualitative and quantitative assessment of cardiac masses and defects. Echocardiography 1995;12:619–628. ) |
|
|
|
FIGURE 12.18. Transesophageal three-dimensional echocardiographic reconstruction in aortic dissection. A,B. The descending thoracic aorta was examined using multiple cut sections and various viewing angles. Both the true lumen (TL) and the false lumen (FL) are well visualized, and the dissection flap (F) presents as a sheet-like structure along the aortic length. C. The communication (arrowheads) between the TL and FL is viewed en face in (C) using a transverse section. As would be expected, the communication is larger in systole (left, C) than in diastole (right, C). D represents a two-dimensional image shown for comparison. Note that the F in the descending aorta (DA) appears only as a linear structure, which has been difficult to differentiate from an artifact in some patients. H, hematoma. (Reproduced with permission from Nanda NC, Khatri GK, Samal A, et al. Three-dimensional echocardiographic assessment of aortic dissection. Echocardiography 1998;15:745–754. ) |
|
|
|
FIGURE 12.19. Aortic regurgitation associated with aortic dissection. Diastolic frame. N points to the area of aortic valve (AV) leaflet noncoaptation, which measures 0.4 cm2by planimetry. This resulted in severe aortic regurgitation (AR). The arrowhead denotes the dissection flap, which was found not to interfere with AV cusp motion by three-dimensional transesophageal echocardiography. LA, left atrium; RA, right atrium; RVO, right ventricular outflow tract. (Reproduced with permission from Dod HS, Nanda NC, Agrawal GG, et al. Three-dimensional transesophageal echocardiographic assessment of aortic valve pathology. Am J Geriatr Cardiol 2003;12:209–213. ) |
|
|
|
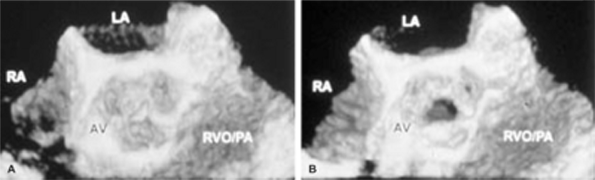
FIGURE 12.20. Three-dimensional transesophageal echocardiographic demonstration of aortic dissection flap protruding into the right coronary artery ostium in an elderly patient. A. The black arrowhead points to the dissection flap protruding into the ostium of the right coronary artery. The white arrowheads denote a midline artifact. B.Two-dimensional transesophageal echocardiogram for comparison. The arrows point to the dissection flap, which appears to extend into the orifice of the right coronary artery (arrowhead). AO, aorta; AV, aortic valve; LA, left atrium; LVO, left ventricular outflow tract; RVO/PA right ventricular outflow tract/pulmonary artery. (Reproduced with permission from Ansingkar KG, Aaluri SR, Nanda NC. Three-dimensional transesophageal echocardiographic demonstration of aortic dissection flap extending into right coronary artery ostium. Am J Geriatr Cardiol 2000;9:344–345. ) |
|
|
|
FIGURE 12.21. Transesophageal three-dimensional reconstruction in a patient with aortic arch (AA) injury from blunt trauma. A,B. Arrowheads represent the communication between the AA and the pseudoaneurysm (PSA). Superior vena cava (SVC) is seen adjacent to the aortic arch because the arch is right sided. (Reproduced with permission from Nanda NC, Samal AK, Mohammed Moursi SB, Transesophageal echocardiographic diagnosis of right-sided aortic arch. Echocaridography 1998;15:409–417. ) |
|
|
|
FIGURE 12.22. Transesophageal three-dimensional (3D) color Doppler echocardiographic findings in traumatic aortic isthmus pseudoaneurysm. A. Arrowhead points to the site of rupture of the aorta. Color Doppler flow signals can be seen moving from the aorta (AO) into the false aneurysm (AN). B,C. Transverse images showing the site of rupture (arrowheads) from the aortic side (B) and aneurysm side (C) with color flow signals. Note that the edge appears somewhat more jagged from the aneurysm side. The maximum dimensions from the aortic side were 2.48 × 0.92 cm and from the aneurysm side were 2.52 × 0.86 cm. D. A two-dimensional (2D) transesophageal echocardiogram for comparison. The maximum dimension of the rupture site (arrowhead) measured 1 cm. Unlike the 3D reconstructed images, the 2D image fails to show the exact shape and size of the rupture site. (Reproduced with permission from Aaluri SR, Miller A, Nanda NC, et al. Transesophageal 3-dimensional color Doppler echocardiographic findings in traumatic aortic isthmus pseudoaneurysm. Am J Geriatr Cardiol 2000;9:286–288. ) |
|
|
|
FIGURE 12.23. Transesophageal three-dimensional reconstruction of aortic leiomyosarcoma. The tumor (T) occupies most of the descending thoracic aortic (AO) lumen. H represents a hematoma resulting from tumor-induced rupture of the aortic wall. (Reproduced with permission from Nanda NC, Khatri GK, Samal A, et al. Three-dimensional echocardiographic assessment of aortic dissection. Echocardiography 1998;15:745–754. ) |
|
|
|
FIGURE 12.24. Thrombus (arrow) involving a St. Jude mitral valve prosthesis seen in the open (left) and closed positions (right). SJ MV, St. Jude mitral valve (Reproduced with permission from Nanda NC, Abd-El Rahman SM, Khatri G, et al. Incremental value of three-dimensional echocardiography over transesophageal multiplane two-dimensional echocardiography in qualitative and quantitative assessment of cardiac masses and defects. Echocardiography 1995;12:619–628. ) |
|
|
|
FIGURE 12.25. Transesophageal three-dimensional color Doppler reconstruction of mitral prosthetic regurgitation. A. Arrowhead points to a large jet of mitral regurgitation, which originates within the confines of the heterograft mitral prosthesis (MP). This is consistent with valvular regurgitation. B. Transverse section of the regurgitation jet (arrowheads) at the level of the MP (dotted line) demonstrating valvular origin. The color signals on the left represent tricuspid regurgitation jet in the right atrium (RA). LA, left atrium; LV, left ventricle. (Reproduced with permission from Ansingkar K, Nanda NC, Aaluri SR, et al. Transesophageal three-dimensional color Doppler echocardiographic assessment of valvular and paravalvular mitral prosthetic regurgitation. Echocardiography 2000;17:579–583. ) |
|
|
|
FIGURE 12.26. Transesophageal three-dimensional color Doppler reconstruction of mitral prosthetic regurgitation in another patient. A. The arrowheads point to two regurgitation jets originating outside the confines of the St. Jude mitral prosthesis (MP). This is consistent with paravalvular regurgitation. B. Transverse section at the level of prosthesis also shows two jets (arrowheads) outside the confines of the prosthesis (dotted line) at the 12 o'clock to 1 o'clock and 7 o'clock positions. These sites corresponded to surgical findings. LAA, left atrial appendage; LA, left atrium; LV, left ventricle; RA, right atrium. (Reproduced with permission from Ansingkar K, Nanda NC, Aaluri SR, et al. Transesophageal three-dimensional color Doppler echocardiographic assessment of valvular and paravalvular mitral prosthetic regurgitation. Echocardiography 2000;17:579–583. ) |
|
|
|
FIGURE 12.27. Transesophageal three-dimensional color Doppler reconstruction of mitral prosthetic regurgitation in a third patient. A. Arrowheads point to three jets of “normal” valvular regurgitation originating within the confines of the Carbomedics mitral prosthesis (MP). Arrow points to a single jet of paravalvular regurgitation visualized outside the prosthetic elements. B. Paravalvular regurgitation is well seen (arrowhead). C. Oblique transverse section at the level of the prosthesis (dotted line) shows the paravalvular regurgitation (arrowhead) originating at the 7 o'clock to 8 o'clock position. This corresponded with the site of dehiscence found at surgery. Color signals within the prosthesis represent “normal” valvular regurgitation. Flow signals at the top represent right atrial flow. D. Arrowhead shows the site of dehiscence located at the 7 o'clock to 8 o'clock positions. It measured 1.4 cm in circumferential length comparable to 1 cm estimated at surgery. LA, left atrium; LAA, left atrial appendage; LV, left ventricle; RA, right atrium. (Reproduced with permission from Ansingkar K, Nanda NC, Aaluri SR, et al. Transesophageal three-dimensional color Doppler echocardiographic assessment of valvular and paravalvular mitral prosthetic regurgitation. Echocardiography 2000;17:579–583. ) |
|
|
|
FIGURE 12.28. Schematic showing the mitral valve as viewed by the surgeon from the right side during operation. The upper and lower asterisks represent the two sites of paravalvular regurgitation at the 1 o'clock and 7 o'clock positions in the patient shown in Figure 12.26. In the patient shown in Figure 12.27, paravalvular regurgitation was confined to the 7 o'clock position (lower asterisks). AML, anterior mitral leaflet; LAA, left atrial appendage; PML, posterior mitral leaflet. (Reproduced with permission from Ansingkar K, Nanda NC, Aaluri SR, et al. Transesophageal three-dimensional color Doppler echocardiographic assessment of valvular and paravalvular mitral prosthetic regurgitation. Echocardiography 2000;17:579–583. ) |
|
|
|
FIGURE 12.29. Surgical mitral clock. Schematic of the usual view of the left atrium obtained by the surgeon from the right side of the patient. A, anterior mitral commissure;AL, anterior mitral leaflet; AO, aorta; IVC, inferior vena cava; LAA, left atrial appendage; P, posterior mitral commissure; PL, posterior mitral leaflet; PV, pulmonary valve; SVC, superior vena cava. (Reproduced and modified with permission from Kirklin JW, Barrett-Boyes BG. Cardiac surgery, 2nd ed. New York: Churchill Livingstone, 1993. ) |
|
|
|
FIGURE 12.30. Surgical aortic clock. Schematic of the usual view of the aortic valve and aorta obtained by the surgeon from the right side of the patient. AA, ascending aorta;IAS, interatrial septum; LCA, left main coronary artery; LCC, left coronary cusp; NCC, noncoronary cusp; RCA, right coronary artery; RCC, right coronary cusp. (Reproduced and modified with permission from Kirklin JW, Barrett-Boyes BG. Cardiac surgery, 2nd ed. New York: Churchill Livingstone, 1993. ) |
|
|
|
FIGURE 12.31. A. Color Doppler two-dimensional echocardiogram shows dehiscence (arrow) of the aortic valve prosthesis (AP) at approximately 12 o'clock. B. Color Doppler three-dimensional images demonstrate the site of prosthetic dehiscence (black arrowheads) at approximately 10 o'clock. The yellow arrow points to the abscess cavity. C. Color Doppler signals have been suppressed. IAS, interatrial septum; LA, left atrium; MPA, main pulmonary artery; RA, right atrium. (Reproduced with permission from Mukhtar OM, Horton CJ Jr, Nanda NC, et al. Transesophageal color Doppler three-dimensional echocardiographic detection of prosthetic aortic valve dehiscence: correlation with surgical findings. Echocardiography 2001;18:393–397. ) |
|
|
|
FIGURE 12.32. Three-dimensional transesophageal echocardiogram shows an abscess cavity (dotted lines) bulging into the left atrium (LA) in a patient with aortic prosthesis endocarditis. IVS, interventricular septum; LV, left ventricle; RA, right atrium; RV, right ventricle; TV, tricuspid valve. (Reproduced with permission from Mukhtar OM, Horton CJ Jr, Nanda NC, et al. Transesophageal color Doppler three-dimensional echocardiographic detection of prosthetic aortic valve dehiscence: correlation with surgical findings. Echocardiography 2001;18:393–397. ) |
|
|
|
FIGURE 12.33. Prosthetic aortic valve abscess producing right coronary artery occlusion. Multiplane two-dimensional transesophageal echocardiogram. A. The arrow points to the aortic abscess (AB) extending to involve the ventricular septum (IVS). B. The arrowheads show the abscess extending to involve the tricuspid valve (TV) annulus. C. The arrowhead shows flow signals moving into the aortic root (AO) from the right coronary artery orifice. D. Color Doppler–guided pulsed-Doppler interrogation of the right coronary artery orifice shows high velocity (1 m/sec) flow signals (top arrowhead) moving into the AO from the right coronary artery during diastole. The lower arrowhead points to systolic flow signals in the AO. E,F. Transesophageal three-dimensional reconstruction. E. The arrow points to the thick walled and narrowed right coronary artery orifice, which is surrounded by the abscess (dotted line). F. Immediately further downstream, the right coronary artery is completely occluded. G. Schematic. Arrows point to the flow moving in and out of the narrowed but nonoccluded ostium and proximal portion of the right coronary artery (RCA). AA, ascending aorta; AP, aortic prosthesis; AV, aortic valve; LA, left atrium; LCA, left main coronary artery; LV, left ventricle; MV, mitral valve; PA, pulmonary artery; RA, right atrium; RV, right ventricle. (Reproduced with permission from Horton CJ Jr, Nanda NC, Nekkanti R, et al. Prosthetic aortic valve abscess producing total right coronary artery occlusion: diagnosis by transesophageal three-dimensional echocardiography. Echocardiography 2002;19:395–398. ) |
|
|
|
FIGURE 12.34. Three-dimensional transesophageal echocardiography in aortic valve papillary fibroelastoma. A. The arrow points to finger-like projections (fronds) of the aortic valve (AV) fibroelastoma. The arrowhead demonstrates the stalk. Note the central linear echogenic areas running within the stalk and body of the tumor consistent with the central collegenous core found in fibroelastomas. B. The same fibroelastoma (arrow) imaged using two-dimensional transesophageal echocardiography is shown for comparison. Fronds and the central collagen core are not well seen. AO, aorta; LA, left atrium; LV, left ventricle; LVO, left ventricular outflow tract; MV, mitral valve; NCC, noncoronary cusp of the AV; RVO, right ventricular outflow tract. (Reproduced with permission from Dod HS, Nanda NC, Pacifico AD, et al. Definitive diagnosis of aortic valve papillary fibroelastoma by three-dimensional transesophageal echocardiography. Am J Geriatr Cardiol 2003;12:60–62. ) |
|
|
|
FIGURE 12.35. Aortic valve fibroelastoma. A. Tumor specimen from Figure 12.34 showing multiple fronds. B. Microscopic examination showing prominent collagen core. AV, aortic valve; (Reproduced with permission from Dod HS, Nanda NC, Pacifico AD, et al. Definitive diagnosis of aortic valve papillary fibroelastoma by three-dimensional transesophageal echocardiography. Am J Geriatr Cardiol 2003;12:60–62. ) |
|
|
|
FIGURE 12.36. Two- and three-dimensional transesophageal echocardiographic localization of a right atrial lipoma. A. Arrowhead points to the lipoma, which is attached to the right atrial free wall in the two-dimensional image. B. Dotted lines circumscribe the lipoma and its attachment to the right atrial free wall in the three-dimensional image. Note the position of the attachment of the lipoma at 7 o'clock. C. Schematic of the usual view of the right atrium obtained by the surgeon from the right side of the patient. The asterisk shows the attachment site of the lipoma at 7 o'clock. AL, anterior tricuspid leaflet; AO, aorta; CS, coronary sinus; FO, fossa ovalis; IL, inferior tricuspid leaflet; IVC, inferior vena cava; LA, left atrium; PA, pulmonary artery; PV, pulmonary vein; RA, right atrium; RV, right ventricle; SL, septal tricuspid leaflet; SVC, superior vena cava; TV, tricuspid valve. (A and B reproduced with permission from Mukhtar OM, Miller AP, Nanda NC, et al. Two- and three-dimensional transesophageal echocardiographic localization of a right atrial lipoma: importance of orienting echocardiographic images to the surgeon's view. Echocardiography 2001;18:539–542. C is reproduced and modified with permission from Kirklin JW, Barrett-Boyes BG. Cardiac Surgery, 2nd ed. New York: Churchill Livingstone, 1993. ) |
|
|
|
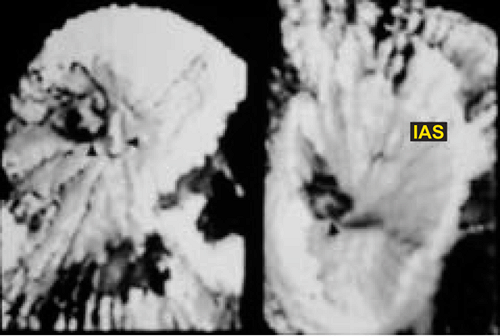
FIGURE 12.37. Lipomatous involvement of the atrial septum. Three-dimensionally reconstructed transesophageal images showing marked bulging of the interatrial septum (IAS) into the left atrium (LA) and narrowing of the superior vena cava (arrowhead). AO, aorta. (Reproduced with permission from Miller A, Mukhtar O, Aaluri SR, et al. 2D and 3D TEE differentiation of lymphoma involving the atrial septum from lipomatous hypertrophy. Echocardiography 2001;18:205–209. ) |
|
|
|
FIGURE 12.38. Transesophageal three-dimensional echocardiographic examination of coronary arteries. The left main coronary artery (LMC) originating from the aortic root (AO) as well as the proximal left anterior descending coronary artery (LAD) and circumflex coronary artery (LCX) are viewed in long axis in three dimensions. Note the short-axis imaging of the more distal portion of the circumflex vessel. There is no evidence of stenosis. LA, left atrium. (Reproduced with permission from Abd El-Rahman SM, Khatri G, Nanda N, et al. Transesophageal three-dimensional echocardiographic assessment of normal and stenosed coronary arteries. Echocardiography 1996;13:503–510. ) |
|
|
|
FIGURE 12.39. Transesophageal three-dimensional echocardiographic examination of coronary arteries. Both (A) and (B) represent two different three-dimensional reconstructions of left-sided coronary arteries from the same dataset stored in the computer. B shows delineation of the first diagonal branch (D1), which is not visualized in(A). AO, aortic root; LAD, left anterior descending; LCX, circumflex; LMC, left main coronary arteries. (Reproduced with permission from Abd El-Rahman SM, Khatri G, Nanda N, et al. Transesophageal three-dimensional echocardiographic assessment of normal and stenosed coronary arteries. Echocardiography 1996;13:503–510. ) |
|
|
|
FIGURE 12.40. Transesophageal three-dimensional echocardiographic examination of coronary arteries. The right coronary artery (oblique arrow) is seen arising from the aortic root (AO) and coursing along the right atrioventricular groove adjacent to the right atrial appendage (AA). The horizontal arrow points to a right ventricular branch. A, right atrium; V, right ventricle. (Reproduced with permission from Abd El-Rahman SM, Khatri G, Nanda N, et al. Transesophageal three-dimensional echocardiographic assessment of normal and stenosed coronary arteries. Echocardiography 1996;13:503–510. ) |
|
|
|
FIGURE 12.41. Transesophageal three-dimensional echocardiographic examination of coronary arteries. Both interventricular (V1) and great cardiac (V2) veins are delineated accompanying the left anterior descending coronary artery (LAD) and the circumflex coronary artery (LCX). LA, left atrium; LMC, left main coronary artery. (Reproduced with permission from Abd El-Rahman SM, Khatri G, Nanda N, et al. Transesophageal three-dimensional echocardiographic assessment of normal and stenosed coronary arteries. Echocardiography 1996;13:503–510. ) |
|
|
|
FIGURE 12.42. Transesophageal three-dimensional echocardiographic examination of coronary arteries. In this adult patient, the left main coronary artery is absent and both the left anterior descending artery (LAD) and circumflex coronary artery (LCX) originate separately from the aortic root (AO). (Reproduced with permission from Abd El-Rahman SM, Khatri G, Nanda N, et al. Transesophageal three-dimensional echocardiographic assessment of normal and stenosed coronary arteries. Echocardiography 1996;13:503–510. ) |
|
|
|
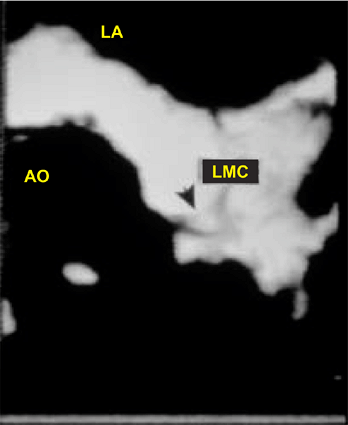
FIGURE 12.43. Transesophageal three-dimensional echocardiographic examination of coronary arteries. There is significant discrete narrowing (arrow) of the left main coronary artery (LMC). AO, aorta; LA, left atrium. (Reproduced with permission from Abd El-Rahman SM, Khatri G, Nanda N, et al. Transesophageal three-dimensional echocardiographic assessment of normal and stenosed coronary arteries. Echocardiography 1996;13:503–510. ) |
|
|
|
FIGURE 12.44. Transesophageal three-dimensional echocardiographic examination of coronary arteries. There is tight stenosis (arrowheads) of the circumflex coronary artery (LCX) imaged in both long- (A) and short-axis (B) views in three dimensions. The arrow points to an atrial branch. AO, aorta; LA, left atrium; LMC, left main coronary artery. (Reproduced with permission from Abd El-Rahman SM, Khatri G, Nanda N, et al. Transesophageal three-dimensional echocardiographic assessment of normal and stenosed coronary arteries. Echocardiography 1996;13:503–510. ) |
|
|
|
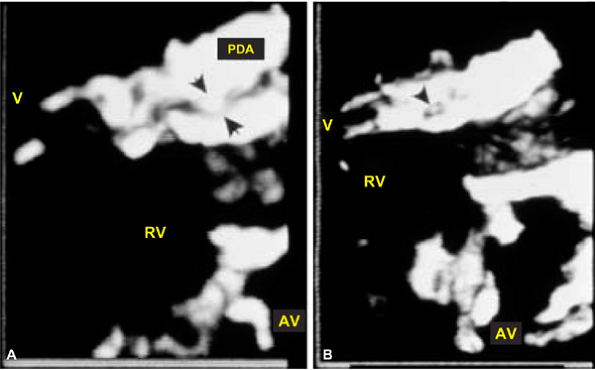
FIGURE 12.45. Transgastric three-dimensional echocardiographic examination of posterior descending coronary artery. Severe stenosis (arrows) is noted in the midportion of the posterior descending branch of the right coronary artery (PDA) imaged in both long- (A) and short-axis (B) views. AV, aortic valve; RV, right ventricle; V, small cardiac vein. (Reproduced with permission from Abd El-Rahman SM, Khatri G, Nanda N, et al. Transesophageal three-dimensional echocardiographic assessment of normal and stenosed coronary arteries. Echocardiography 1996;13:503–510. ) |
|
|
|
FIGURE 12.46. Online three-dimensional transesophageal echocardiographic reconstruction of a Hemashield graft (“G”) extending from the aorta to the left anterior descending coronary artery in a 70-year-old woman with a mechanical aortic valve prosthesis. A,B. The arrowhead points to the left anterior descending (LAD) coronary artery. AP, aortic valve prosthesis; CX, circumflex coronary artery; LA, left atrium. (Reproduced with permission from Dod HS, Nanda NC, Baweja G, et al. Online three-dimensional transesophageal echocardiographic reconstruction. Am J Geriatr Cardiol 2003;12:329–332. ) |
|
|
|
FIGURE 12.47. Three-dimensional transesophageal echocardiographic findings in left ventricular pseudoaneurysm. The arrowhead shows distortion of the mitral annulus and the left atrial (LA) wall (dotted line). PAN, pseudoaneurysm; RV, right ventricle. (Reproduced with permission from Nekkanti R, Nanda NC, Ansingkar KG, et al. Transesophageal three-dimensional echocardiographic assessment of left ventricular pseudoaneurysm. Echocardiography 2002;19:169–172. ) |
|
|
|
FIGURE 12.48. Combined left ventricular pseudoaneurysm and ventricular septal rupture. Multiplane two-dimensional transesophageal echocardiography. A. Arrowhead points to the rupture in the midportion of the left ventricle (LV) inferior wall. Note the punched-out appearance of the rupture site. The arrow points to the rupture of the ventricular septum (VS). B. Color Doppler examination demonstrating flow signals at the sites of VS (arrowhead) and LV rupture. Arrow shows flow signals filling the LV pseudoaneurysm (PAN). C. Color Doppler directed continuous-wave Doppler interrogation demonstrating high velocity signals moving from the LV into PAN in systole and back into LV in diastole. D. Schematic. The arrowhead points to the LV rupture and the arrow points to the VS rupture. E. Three-dimensional transesophageal echocardiography. Short-axis view of the LV rupture site (arrowhead) viewed from the PAN aspect. Since the rupture site is viewed en face, its area and circumference can be calculated. RV, right ventricle. (Reproduced with permission from Nekkanti R, Nanda NC, Zoghbi GJ, et al. Transesophageal two- and three-dimensional echocardiographic diagnosis of combined left ventricular pseudoaneurysm and ventricular septal rupture. Echocardiography 2002;19:345–349. ) |
|
|
|
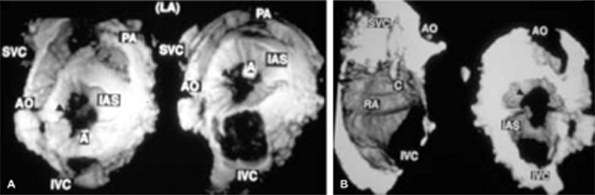
FIGURE 12.49. Three-dimensional transesophageal echocardiographic reconstruction in a patient with a secundum atrial septal defect. A. The defect (arrows) is viewed from the left atrial (LA) aspect (right). The image on the left has been rotated superoinferiorly to demonstrate the great vessels more clearly. A represents a technical artifact.AO, aorta; IAS, interatrial septum; IVC, inferior vena cava; PA, pulmonary artery; SVC, superior vena cava. B. The same defect (arrow) viewed from the right side. The image on the left shows a catheter (C) in the right atrium (RA). (Reproduced with permission from Nanda NC, Abd-El Rahman SM, Khatri G, et al. Incremental value of three-dimensional echocardiography over transesophageal multiplane two-dimensional echocardiography in qualitative and quantitative assessment of cardiac masses and defects. Echocardiography 1995;12:619–628. ) |
|
|
|
FIGURE 12.50. Three-dimensional transesophageal echocardiographic reconstruction in a patient with a right atrial thrombus impacting on a fossa ovalis atrial septal defect. The arrows point to the thrombus (TH) impacting on the defect viewed from the right (left) and left (right) sides. IAS, interatrial septum. (Reproduced with permission from Nanda NC, Abd-El Rahman SM, Khatri G, et al. Incremental value of three-dimensional echocardiography over transesophageal multiplane two-dimensional echocardiography in qualitative and quantitative assessment of cardiac masses and defects. Echocardiography 1995;12:619–628. ) |
|
|
|
FIGURE 12.51. Multiplane transesophageal three-dimensional reconstruction of sinus venosus atrial septal defect. A. The arrowhead points to the large defect in the superior portion of the atrial septum. The arrow shows the right superior pulmonary vein (PV) entering the superior vena cava (SVC)–right atrial junction at the site of the defect. B,C. Orthogonal views demonstrating the size of the defect, which measured 3.69 cm2 in area. The maximal dimension of the defect was 2.15 cm, which corresponded to the diameter of 2 cm measured at surgery. The top arrowhead in (B) points to the right superior PV, and the bottom arrowhead points to the defect. ASD, atrial septal defect; LA, left atrium; RA, right atrium; SVC, superior vena cava. (Reproduced with permission from Nanda NC, Ansingkar K, Espinal M, et al. Transesophageal three-dimensional echo assessment of sinus venosus atrial septal defect. Echocardiography 1999;16:835–837. ) |
|
|
|
FIGURE 12.52. Two-dimensional transesophageal echocardiography in a patient with atrioventricular septal defect presenting for reoperation. A. Arrow points to a cleft in the left atrioventricular valve (LAV). Arrowhead shows a small defect in the interatrial septum. B. Arrow points to severe LAV regurgitation, whereas the arrowhead denotes a left ventricle (LV) to right atrium (RA) shunt. C. Three-dimensional transesophageal echocardiography. Arrowhead points to a large cleft in the LAV. Note the thickened edges of the cleft. AO, aorta; AV, atrioventricular; IAS, interatrial septum; LA, left atrium; LAA, left atrial appendage; RA, right atrium; RV, right ventricle. (Reproduced with permission from Miller AP, Nanda NC, Aaluri S, et al. Three-dimensional transesophageal echocardiographic demonstration of anatomical defects in AV septal defect patients presenting for reoperation. Echocardiography 2003;20:105–109. ) |
|
|
|
FIGURE 12.53. Transesophageal three-dimensional echocardiography in an elderly patient with clefts in the anterior tricuspid valve leaflet. A,B. Short-axis view of the tricuspid valve (TV) in systole demonstrating multiple clefts (arrowheads). Color Doppler signals are noted arising from the clefts differentiating them from echocardiographic artifactual dropouts. AS, atrial septum; LA, left atrium; RA, right atrium. A, S and P represent the anterior, septal, and posterior TV leaflets, respectively. (Reproduced with permission from Nekkanti R, Nanda NC, Ahmed S, et al. Transesophageal three-dimensional echocardiographic demonstration of clefts in the anterior tricuspid valve leaflet. Am J Geriatr Cardiol 2002;11:329–330. ) |
|
|
|
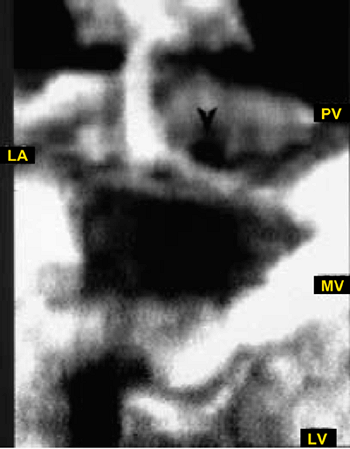
FIGURE 12.54. Cor triatriatum sinister. Transesophageal three-dimensionally reconstructed image. The arrowhead demonstrates the opening in the cor triatriatum membrane. LA, left atrium; LV, left ventricle; MV, mitral valve; PV, pulmonary vein. ( Samal AK, Nanda NC, Thakur AC, et al. Three-dimensional echocardiographic reconstruction of atrial membranes. Echocardiography 1998;15:605–610. ) |
|
|
|
FIGURE 12.55. A. Two-dimensional transesophageal echocardiographic examination in cor triatriatum with common atrium (CA). The arrow shows what appears to be an atrial septum with an inferiorly located defect (arrowhead) typical of a partial atrioventricular septal defect. Both left and right atrioventricular valves (LAV and RAV) are also at the same level. B–D. Three-dimensional transesophageal echocardiographic examination. In B, the arrow points to the cor triatriatum membrane whereas the arrowheads (black) outline a large nonobstructive opening present within the membrane. C shows left and right upper pulmonary veins (LPV and RPV) located superior to the cor triatriatum membrane (arrows). D. Short-axis view of left atrioventricular valve showing a cleft (C) in the anterior leaflet. AV, aortic valve; LV, left ventricle; PL, posterior left atrioventricular valve leaflet; RV, right ventricle. (Reproduced with permission from Baweja G, Nanda NC, Kirklin JK. Definitive diagnosis of cor triatriatum with common atrium by three-dimensional echocardiography in an adult. Echocardiography 2004;21:303–306. ) |
|
|
|
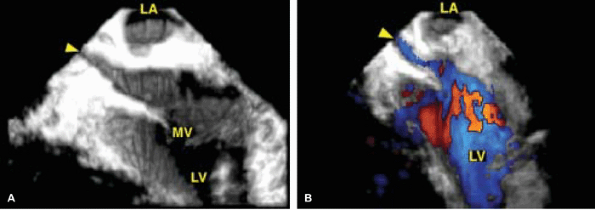
FIGURE 12.56. Transesophageal three-dimensional echocardiographic detection of intraatrial baffle (IAB) obstruction (status post-Mustard procedure for transposition of the great vessels). A,B. The arrowhead points to the narrowed IAB seen in long axis. LA, pulmonary venous atrium; LV, systemic venous ventricle; MV, mitral valve. ( Ahmed S, Nekkanti R, Nanda NC, Yousif AM: Three-dimensional transesophageal echocardiographic demonstration of intraatrial baffle obstruction. Echocardiography 2003;20:683–686. ) |
|
|
|
FIGURE 12.57. Transesophageal two- and three-dimensional echocardiography in an adult with anomalous coronary artery. A–C. Both left main coronary artery (LM) and right coronary arteries (black arrows in A, lower arrowheads in B) arise from a common ostium (yellow arrow in A, upper arrowhead in B, left arrowhead in C) in the right sinus of Valsalva. The LM courses between the aorta (AO) and the right ventricular outflow tract/pulmonary artery (RVO/PA). The right arrowhead in (C) points to the LM. D–G.Transesophageal two- and three-dimensional echocardiography in another adult patient with anomalous coronary artery. In this patient also, both LM and right coronary arteries (arrowheads) arise from a common ostium in the right sinus with the LM coursing between AO and RVO/PA (D–F). In E, the arrowhead points to intramyocardial course of the left anterior descending (LAD) coronary artery within the ventricular septum (VS). G. Coronary angiogram showing the common origin of the LM and right coronary (RCA) arteries.LA, left atrium; LVO, left ventricular outflow tract; MV, mitral valve; RA, right atrium; RV, right ventricle. (Reproduced with permission from Nanda NC, Bhambore MM, Jindal A, et al. Transesophageal three-dimensional echocardiographic assessment of anomalous coronary arteries. Echocardiography 2000;17:53–60. ) |
|
|
|
FIGURE 12.58. Transesophageal two- and three-dimensional echocardiography in a 59-year-old patient with anomalous coronary artery. A–D. The arrowheads point to an anomalous right coronary artery (RCA) arising from the left sinus very close to the origin of the left main coronary artery (LM). This anomalous RCA also courses within the aortic wall between the aorta (AO) and right ventricular outflow tract/pulmonary artery (RVO/PA) toward the right sinus, and then follows its usual course. The upper arrowhead in(D) points to the origin of the anomalous RCA. E. ECG demonstrating ventricular tachycardia that developed 2 minutes and 24 seconds into treadmill exercise. F. Coronary angiogram showing the anomalous RCA. LA, left atrium; RA, right atrium. (Reproduced with permission from Nanda NC, Bhambore MM, Jindal A, et al. Transesophageal three-dimensional echocardiographic assessment of anomalous coronary arteries. Echocardiography 2000;17:53–60. ) |
|
|
|
FIGURE 12.59. Left circumflex coronary artery to coronary sinus fistula. Three-dimensional reconstructed image. The arrowhead shows a definite communication between the left circumflex coronary artery (CX) and the coronary sinus (CS). Red color flow signals moving into the left atrium (LA) from the middle of the mitral valve (MV) represent mitral regurgitation (MR). LAA, left atrial appendage; LUPV, left upper pulmonary vein. (Reproduced with permission from Nekkanti R, Mukhtar O, Nanda NC, et al. Transesophageal color Doppler three-dimensional echocardiographic assessment of left circumflex coronary artery fistula. Echocardiography 2002;19:573–575. ) |
|
|
|
FIGURE 12.60. Transesophageal three-dimensional color Doppler reconstruction of the proximal left vertebral artery. A–C. Long-axis images of the vertebral artery (arrowheads) are shown. In C, color Doppler flow signals are suppressed. Sections taken at three different levels (1, 2, and 3 in B) are shown with (D) and without color Doppler flow signals (E). Numbers 2 and 3 represent two short-axis sections of the vertebral artery, one taken close to its origin and the other more distally. LSA, left subclavian artery. (Reproduced with permission from Ansingkar KG, Nanda NC, Nekkanti R, et al. Transesophageal three-dimensional color Doppler echocardiographic reconstruction of the left vertebral artery. Echocardiography 2001;8:623–625. ) |
|
|
|
FIGURE 12.61. Three-dimensional color Doppler transpharyngeal ultrasound image of the left common, internal, and external carotid arteries in a patient with aortic stenosis. Arrowhead points to a branch of the left external carotid artery (LEC). LCC, left common carotid artery; LIC, left internal carotid artery. (Reproduced with permission from Miller AP, Aaluri SR, Mukhtar OM, et al. Three-dimensional color Doppler transpharyngeal echocardiographic reconstruction of the left common, internal, and external carotid arteries. Echocardiography 2002;19:223–225. ) |
Suggested Readings
Aaluri SR, Miller A, Nanda NC, et al. Transesophageal 3-dimensional color Doppler echocardiographic findings in traumatic aortic isthmus pseudoaneurysm. Am J Geriatr Cardiol 2000;9:286–288.
Abd El-Rahman SM, Khatri G, Nanda N, et al. Transesophageal three-dimensional echocardiographic assessment of normal and stenosed coronary arteries. Echocardiography 1996;13:503–510.
Ahmed S, Nanda NC, Miller AP, et al. Volume quantification of intracardiac mass lesions by transesophageal three-dimensional echocardiography. Ultrasound Med Biol 2002;28:1389–1393.
Ahmed S, Nanda NC, Miller AP, et al. Usefulness of transesophageal three-dimensional echocardiography in the identification of individual segment/scallop prolapse of the mitral valve. Echocardiography 2003a;20:203–209.
Ahmed S, Nanda NC, Nekkanti R, et al. Transesophageal three-dimensional echocardiographic demonstration of Ebstein's anomaly. Echocardiography 2003b;20:305–307.
Ahmed S, Nekkanti R, Nanda NC, et al. Three-dimensional transesophageal echocardiographic demonstration of intra-atrial baffle obstruction. Echocardiography 2003;20:449–452.
Anayiotos AS, Smith BK, Kolda M, et al. Morphological evaluation of a regurgitant orifice by 3-D echocardiography: applications in the quantification of valvular regurgitation. Ultrasound Med Biol 1999;25:209–223.
Ansingkar KG, Aaluri SR, Nanda NC. Three dimensional transesophageal echocardiographic demonstration of aortic dissection flap extending into right coronary artery ostium. Am J Geriatr Cardiol 2000;9:344–345.
Ansingkar K, Nanda NC, Aaluri SR, et al. Transesophageal three-dimensional color Doppler echocardiographic assessment of valvular and paravalvular mitral prosthetic regurgitation. Echocardiography 2000;17:579–583.
Ansingkar KG, Nanda NC, Nekkanti R, et al. Transesophageal three-dimensional color Doppler echocardiographic reconstruction of the left vertebral artery. Echocardiography 2001;18:623–625.
Baweja G, Nanda NC, Kirklin JK. Definitive diagnosis of cor triatriatum with common atrium by three-dimensional echocardiography in an adult. Echocardiography 2004;21:303–306.
Baweja G, Nanda NC, Nekkanti R, et al. Three-dimensional transesophageal echocardiographic delineation of ventricular septal aneurysm producing right ventricular outflow obstruction in an adult. Echocardiography 2004;21:95–97.
Dod HS, Nanda NC, Agrawal GG, et al. Three-dimensional transesophageal echocardiographic assessment of aortic valve pathology. Am J Geriatr Cardiol 2003;12:209–213.
Dod HS, Nanda NC, Baweja G, et al. Online three-dimensional transesophageal echocardiographic reconstruction. Am J Geriatr Cardiol 2003;12:329–332.
Dod HS, Nanda NC, Pacifico AD, et al. Definitive diagnosis of aortic valve papillary fibroelastoma by three-dimensional transesophageal echocardiography. Am J Geriatr Cardiol 2003;12:60–62.
Felmeden D, Singh SP, Lip GY. Anomalous coronary arteries of aortic origin. Int J Clin Pract 2000;54:390–394.
Gunasegaran K, Yao J, De Castro S, et al. Three-dimensional transesophageal echocardiography (TEE) and other future directions. Cardiol Clin 2000;18:893–910.
Handke M, Heinrichs G, Beyersdorf F, et al. In vivo analysis of aortic valve dynamics by transesophageal 3-dimensional echocardiography with high temporal resolution. J Thorac Cardiovasc Surg 2003;125:1412–1419.
Horton CJ Jr, Nanda NC, Nekkanti R, et al. Prosthetic aortic valve abscess producing total right coronary artery occlusion: diagnosis by transesophageal three-dimensional echocardiography. Echocardiography 2002;19:395–398.
Hozumi T, Yoshikawa J. Three-dimensional echocardiography using a muliplane transesophageal probe: the clinical applications. Echocardiography 2000;17:757–764.
Huang WY, Nanda NC, Miller A, et al. Fibrotic aortic stenosis in a patient with dwarfism quadricuspid aortic valve. Echocardiography 2000;17:701–704.
Langerveld J, Valocik G, Plokker HW, et al. Additional value of three-dimensional transesophageal echocardiography for patients with mitral valve stenosis undergoing balloon valvuloplasty. J Am Soc Echocardiogr 2003;16:841–849.
Li Z, Wang X, Nanda NC, et al. Three dimensional reconstruction of transesophageal echocardiographic longitudinal images. Echocardiography 1995;12:367–375.
Li A, Wang XF, Xie M, et al. Dynamic three-dimensional reconstruction of abnormal intracardiac blood flow. Echocardiography 1997;14:375–381.
Malhotra S, Nanda NC, McElderry HT, et al. Transesophageal 3-dimensional echocardiography in papillary muscle rupture. Echocardiography 1998;15:603–604.
Miller AP, Aaluri SR, Mukhtar OM, et al. Three-dimensional color Doppler transpharyngeal echocardiographic reconstruction of the left common, internal and external carotid arteries. Echocardiography 2002;19:223–225.
Miller A, Mukhtar O, Aaluri SR, et al. 2D and 3D TEE differentiation of lymphoma involving the atrial septum from lipomatous hypertrophy. Echocardiography 2001;18:205–209.
Miller AP, Nanda NC, Aaluri S, et al. Three-dimensional transesophageal echocardiographic demonstration of anatomical defects in A-V septal defect patients presenting for re-operation. Echocardiography 2003;20:105–109.
Mukhtar OM, Horton CJ Jr, Nanda NC, et al. Transesophageal color Doppler three-dimensional echocardiographic detection of prosthetic aortic valve dehiscence: correlation with surgical findings. Echocardiography 2001;18:393–397.
Mukhtar OM, Miller AP, Nanda NC, et al. Two- and three-dimensional transesophageal echocardiographic localization of a right atrial lipoma: importance of orienting echocardiographic images to the surgeon's view. Echocardiography 2001;18:539–542.
Nanda NC, Abd-El Rahman SM, Khatri G, et al. Incremental value of three-dimensional echocardiography over transesophageal multiplane two-dimensional echocardiography in qualitative and quantitative assessment of cardiac masses and defects. Echocardiography 1995;12:619–628.
Nanda NC, Ansingkar K, Espinal M, et al. Transesophageal three-dimensional echo assessment of sinus venosus atrial septal defect. Echocardiography 1999;16:835–837.
Nanda NC, Bhambore MM, Jindal A, et al. Transesophageal three-dimensional echocardiographic assessment of anomalous coronary arteries. Echocardiography 2000;17:53–60.
Nanda NC, Khatri GK, Samal A, et al. Three-dimensional echocardiographic assessment of aortic dissection. Echocardiography 1998;15:745–754.
Nanda NC, Pinheiro L, Sanyal R, et al. Multiplane transesophageal echocardiographic imaging and three-dimensional reconstruction: a preliminary study. Echocardiography 1992; 9:667–676.
Nanda NC, Roychoudhury D, Chung SM, et al. Quantitative assessment of normal and stenotic aortic valve using transesophageal three-dimensional echocardiography. Echocardiography 1994;11:617–625.
Nekkanti R, Mukhtar O, Nanda NC, et al. Transesophageal color Doppler three-dimensional echocardiographic assessment of left circumflex coronary artery fistula. Echocardiography 2002;19:573–575.
Nekkanti R, Nanda NC, Ahmed S, et al. Transesophageal three-dimensional echocardiographic demonstration of clefts in the anterior tricuspid valve leaflet. Am J Geriatr Cardiol 2002;11:329–330.
Nekkanti R, Nanda NC, Ahmed S, et al. Three-dimensional transesophageal echocardiographic demonstration of innominate artery dissection. Echocardiography 2003;20:569–571.
Nekkanti R, Nanda NC, Angsingkar KG, et al. Transesophageal three-dimensional echocardiographic assessment of left main coronary artery fistula. Echocardiography 2001;18:305–308.
Nekkanti R, Nanda NC, Ansingkar KG, et al. Transesophageal three-dimensional echocardiographic assessment of left ventricular pseudoaneurysm. Echocardiography 2002;19:169–172.
Nekkanti R, Nanda NC, Zoghbi GJ, et al. Transesophageal two and three-dimensional echocardiographic diagnosis of combined left ventricular pseudoaneurysm and ventricular septal rupture. Echocardiography 2002;19:345–349.
Pandian NG, Nanda NC, Schwartz ST, et al. Three-dimensional and four-dimensional transesophageal echocardiographic imaging of the heart and aorta in humans using a computed tomographic imaging probe. Echocardiography 1992;9:677–687.
Sadaniantz A, Burtt D, Nanda NC, et al. Three dimensional echocardiography of right heart pathology. Echocardiography 1998;15:795–806.
Samal A, Nanda NC, Biederman RWW, et al. Traumatic rupture of atherosclerotic plaque producing aortic isthmus dissection. Echocardiography 1998;15:695–701.
Samal AK, Nanda NC, Thakur AC, et al. Three-dimensional echocardiographic reconstruction of atrial membranes. Echocardiography 1998;15:605–610.
Samal AK, Nanda NC, Thakur AC, et al. Three-dimensional echocardiographic assessment of Lambl's excrescences on the aortic valve. Echocardiography 1999;16:437–441.
Sugeng L, Spencer KT, Mor-Avi V, et al. Dynamic three-dimensional color flow Doppler: an improved technique for the assessment of mitral regurgitation. Echocardiography 2003;20:265–273.