Ajay K. Israni Bertram L. Kasiske
|
|
Detection and Diagnosis of Kidney Disease, 724 |
|
|
|
Renal Clearance—Glomerular Filtration Rate, 725 |
|
|
|
Historical Perspective, 725 |
|
|
|
Overview, 725 |
|
|
|
Plasma Urea, 726 |
|
|
|
Urea Clearance, 727 |
|
|
|
Serum Creatinine, 727 |
|
|
|
Creatinine Clearance, 728 |
|
|
|
Cimetidine-Enhanced Creatinine Clearance, 729 |
|
|
|
Serum Creatinine Formulas to Estimate Kidney Function, 729 |
|
|
|
Serum Cystatin C, 730 |
|
|
|
Inulin, 731 |
|
|
|
Radionuclide and Radiocontrast Markers of Glomerular Filtration Rate, 732 |
|
|
|
Normalizing Glomerular Filtration Rate, 734 |
|
|
|
Applications, 734 |
|
|
|
Urinalysis, 735 |
|
|
|
Historical Background, 735 |
|
|
|
Overview, 736 |
|
|
|
Chemical Content, 736 |
|
|
|
Color, 736 |
|
|
|
Specific Gravity, 736 |
|
|
|
Urine pH, 736 |
|
|
|
Protein, 738 |
|
|
|
Formed Elements, 743 |
|
|
|
Kidney Biopsy, 747 |
|
|
|
Historical Perspective, 747 |
|
|
|
Clinical Utility, 747 |
|
|
|
Indications, 747 |
|
|
|
Patient Preparation, 749 |
|
|
|
Localization, 750 |
|
|
|
Needle Selection, 750 |
|
|
|
Processing of the Specimen, 750 |
|
|
|
Complications, 750 |
* Conflicts: Dr.Kasiske currently receives research support from the Merck/Schering Plough Joint Venture and Bristol-Myers Squibb. In the past 2 years,he received honoraria from Astra-Zenica, Bristol-Myers Squibb, Fujisawa, Merck,Pflzer, and Wyeth.Dr.Israni currently receives research support from Roche and Bristol-Myers Squibb.Support: Supported in part by NIH grant K23-DK062829 to Dr. Israni.
DETECTION AND DIAGNOSIS OF KIDNEY DISEASE
Because patients in early stages of chronic kidney disease (CKD) often exhibit few signs and symptoms, tests for screening and diagnosis are critical in nephrology. Directly or indirectly, these tests measure kidney structure and function. Ideally, they should detect abnormalities early enough to alert patients and physicians to the potential need for therapy that may prevent morbidity and mortality associated with kidney disease. In addition, tests can help establish a specific diagnosis that will suggest the correct therapy and the likelihood of response to treatment.
Even in the absence of effective therapy, accurate diagnosis of kidney disease helps determine prognosis, which often serves a useful purpose in its own right. Tests to determine kidney structure and function can also be important for measuring disease progression. Once disease has been detected and therapy begun, it is desirable to determine whether the therapy has been effective, so that ineffective therapy can be discontinued or altered. In any case, it is important to predict the clinical course of disease to better inform patients and to help determine when renal replacement therapy may be appropriate.
Finally, data have now suggested that CKD is an important independent risk factor for cardiovascular disease. Individuals with mild to moderate reductions in kidney function are at increased risk for cardiovascular disease, and this reduction in kidney function has an adverse effect on the prognosis of cardiovascular disease.[1] Microalbuminuria, even in the absence of diabetes, has also been linked to cardiovascular disease.[2] Therefore, detecting kidney damage may help identify patients for cardiovascular disease risk factor management.
The tests that best detect abnormalities in kidney function are those that measure glomerular filtration rate (GFR). However, measurements of GFR may not be useful for screening purposes in many clinical settings. Patients with early kidney disease may have normal or even increased GFR. Because there is a large amount of physiologic variability among normal individuals, it is virtually impossible to define limits for normal GFR. Indeed, substantial differences in the amount of structural kidney damage can be demonstrated in patients with identical GFRs. Furthermore, measuring GFR is of little value in establishing a diagnosis once other abnormalities have been detected. Nevertheless, an accurate determination of GFR can provide useful prognostic information and can be particularly helpful in following the clinical course. Guidelines developed by the National Kidney Foundation's Kidney Disease and Outcomes Quality Initiative (K/DOQI) have defined stages of CKD largely on the basis of levels of GFR.[3]
Urinalysis is often the most useful test available for detecting early kidney abnormalities. Measuring urine protein level or examining the urine sediment can also help establish a diagnosis or aid the decision whether to subject a patient to biopsy. Examining the microscopic structure of kidney tissue is invaluable in detecting and diagnosing kidney disease. However, major limitations of kidney biopsy include the risk and inconvenience of the procedure as well as the potential for sampling errors. The careful selection of patients who undergo biopsy can be aided by measurements in urine that help screen for kidney injury.
The GFR measurement, urinalysis, and kidney biopsy serve complementary roles in the detection and diagnosis of kidney disease. However, the relative usefulness of these tests is, in large part, determined by their sensitivity and specificity. Sensitivity and specificity, in turn, depend on accuracy and precision. Moreover, the prevalence of abnormalities in the population of individuals being tested affects the clinical utility of each of these tests.
The sensitivity, or true-positive rate, of a test is the proportion of positive results in patients known to have disease ( Table 23-1 ). The specificity is the proportion of negative results in disease-free individuals. The false-positive rate is the proportion of positive results in disease-free individuals; and the false-negative rate is the proportion of negative results in individuals with disease. Positive predictive value of a test refers to the proportion of individuals with a positive result who have the disease (i.e., the likelihood of disease if the result is positive). Negative predictive value refers to the proportion of individuals with a negative result who are disease-free.
TABLE 23-1 -- Definitions of Parameters Commonly Used to Assess the Diagnostic Discrimination of a Clinical Test
|
|
Disease (Total = a + c) |
No Disease (Total = b + d) |
|
Test positive (Total = a + b) |
a |
b |
|
Test negative (Total = c + d) |
c |
d |
|
Sensitivity = a/(a + c) Specificity = d/(b + d) False-positive rate = 1 - specificity = b/(b + d) False-negative rate = 1 - sensitivity = c/(a + c) Positive predictive value = a/(a + b) Negative predictive value = d/(c + d) |
The sensitivity and specificity of any test are ultimately dictated by its accuracy (determined by comparison with a “gold standard”) and precision (determined by comparing repeated measurements using the same test). The accuracy and precision of a test that yields values on a continuum also depend on the cutoff value or values used to define what is abnormal. Often, the utility of a test can be determined by examining receiver-operating characteristic (ROC) curves generated for each test. ROC curves are plots of the true-positive rate (sensitivity) on the y axis and the false-positive rate (1 - specificity) on the x axis. A perfect test is one in which the ROC is described by a line in which all values for y are between 0 and 100 when x is 0, and all values for y are 100 when x is greater than 0. A worthless test is one in which the ROC curve is described by a line in which y is equal to x for all values of x and y. The utility of a given test depends on the extent to which the ROC curve resembles that of a perfect test.
Finally, the number of true-positive and false-positive results and the number of true-negative and false-negative results ultimately depend on the prevalence of dysfunction in the population being screened. Some simple algebraic calculations can easily demonstrate how the prevalence of a disease influences the diagnostic discrimination of a test. Take the case of a hypothetical test evaluating 100 individuals known to have a high prevalence (30%) of disease. The test would appear to be quite reasonable with a sensitivity of 0.90 and a specificity of 0.90. Among the 100 patients tested, a positive result would indicate a 79% likelihood that disease was present, whereas a negative result would indicate a 95% likelihood that disease was absent. If the same test were then applied to a general population of 10,000 individuals in whom the prevalence of disease was 0.3%, the sensitivity and specificity of the test would be unchanged. However, in this population, a positive result would indicate only a 2.6% likelihood of disease, and the number of false-positive results would greatly exceed the number of true-positive results.
This chapter reviews the usefulness and limitations of currently available techniques for measuring GFR, examining urine constituents, and assessing kidney structure. In reality, precise data on the sensitivity and specificity of tests of kidney structure and function are often not available, and even when they are, the prevalence (prior probability) of the outcome being measured can be only crudely estimated. Nevertheless, data on sensitivity and specificity are dis-cussed when available. When possible, we make an empirical estimation of the effect of differences in the underlying prevalence of abnormalities on the diagnostic discrimination of a test.
RENAL CLEARANCE—GLOMERULAR FILTRATION RATE
Historical Perspective
The modern era of kidney function assessment began with the measurement of urea. Urea was first isolated from human urine by Rouelle in 1773. In the early 1800s, Fourcroy coined the term “urúe,” carefully choosing a name that would avoid confusion with “urique,” or uric acid. In 1827, Richard Bright observed that urea accumulated in the blood of patients with dropsy, and he linked this phenomenon to decreased urine urea concentration, proteinuria, and diseased kidneys. One year later, Wöhler synthesized urea from ammonium cyanate; in so doing, he helped discredit the doctrine of vitalism, which was then prevalent. In 1842, Dumas and Cahours demonstrated that urea was a product of dietary protein catabolism, and in 1903, Strauss introduced blood urea level as a diagnostic test for kidney disease.[4]
Homer Smith credited Ambard and Weill with one of the first attempts to measure kidney function with a “dynamic” test in 1912.[4] These researchers characterized kidney function (K) as blood urea concentration (B) divided by the product of the square root of the rate of urea excretion (D) times the square root of urine urea concentration (U), as follows:
|
|
|
In 1926, Rehberg used exogenous creatinine to measure renal clearance (urine concentration of creatinine times urine flow rate divided by plasma concentration of creatinine) as an estimate of glomerular filtration. In 1928, Addis described kidney function as a urea excretion ratio, or the quantity of urea excreted divided by the concentration in blood. Around the same time, the concept of urea clearance as a measure of kidney function was described in detail by Möller, McIntosh, and Van Slyke.[4]
Overview
GFR is traditionally measured as the renal clearance of a particular substance, or marker, from plasma. The clearance of an indicator substance is the amount removed from plasma, divided by the average plasma concentration over the time of measurement. Clearance is expressed in moles or weight of the indicator per volume per time. It can be thought of as the volume of plasma that can be completely cleared of the indicator in a unit of time.
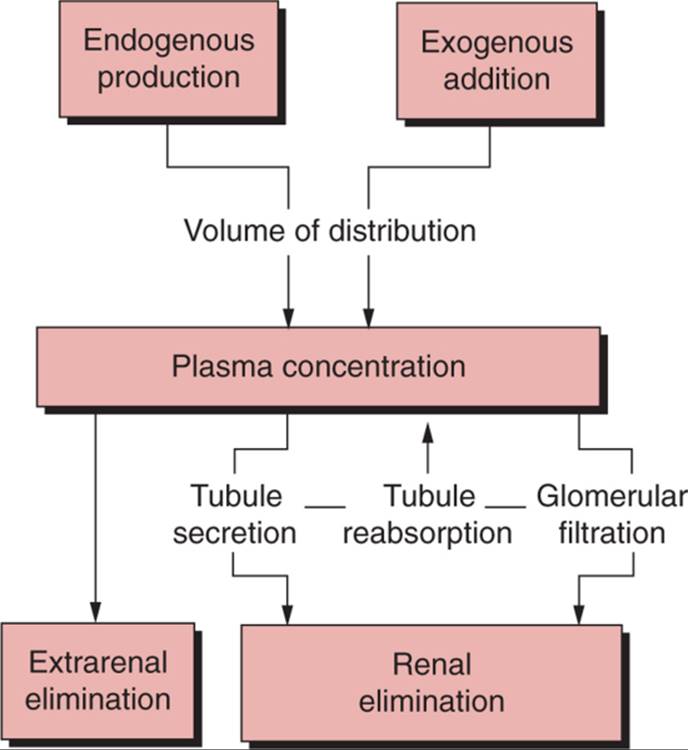
Under the right conditions, measuring the amount of an indicator in both plasma and urine can allow the accurate calculation of GFR ( Fig. 23-1 ). Indeed, if we assume that there is no extrarenal elimination, tubular reabsorption, or tubular secretion of the marker, then GFR can be calculated as follows:
|
|
Glomerular filtration rate = (U · V)/(P · T) |
|
|
|
|
|
|
|
FIGURE 23-1 Factors influencing the relationship between an indicator used to measure renal function and true glomerular filtration rate (GFR). When tubular secretion and reabsorption of the indicator are nil and plasma concentration is constant, then GFR is equal to renal elimination divided by plasma concentration. Also, if the sum of endogenous production and exogenous addition minus extrarenal elimination is constant, then renal elimination is constant and the GFR is inversely proportional to plasma concentration. |
|
where U is the urine concentration, V is the urine volume, and P is the average plasma concentration of the marker over the time (T) of the urine collection. Unfortunately, tubular secretion, tubular reabsorption, or both, of the indicator can cause renal clearance measurements to give estimates of the GFR that are falsely high or falsely low.
Under the right conditions, plasma concentrations of an indicator substance can be completely dependent on renal clearance and can accurately reflect GFR. When the amount of an indicator added to the plasma from an exogenous or endogenous source is constant, and when there is no extrarenal elimination, tubular secretion, or tubular reabsorption, then the GFR is equal to the inverse plasma concentration of the indicator multiplied by a constant. That constant is the amount excreted by glomerular filtration, which, under steady-state conditions, must equal the amount added to the plasma (see Fig. 23-1 ). In other words, under these conditions, U · V/T is equal to a constant (C) so that GFR = C/P, and changes in GFR must be inversely proportional to changes in P.
This information can be used to define the characteristics of an ideal indicator for measuring GFR (Tables 23-2 and 23-3 [2] [3]). Although such an indicator does not exist, its definition can serve as a useful benchmark for comparing the advantages and disadvantages of tests designed to measure GFR. The ideal endogenous indicator would be produced at the same constant rate under all conditions, so that changes in the plasma levels are inversely proportional to changes in GFR multiplied by a constant. This constant would be uniquely determined for an individual patient by measuring the urine excretion rate of the marker (GFR equals the urine excretion rate divided by the plasma concentration). Thereafter, only a single plasma determination would be needed to accurately assess GFR in that patient, unless the renal function was changing so rapidly that a steady state was not achieved. An ideal exogenous indicator would have all of these same characteristics, but should also be safe, easy to administer, and inexpensive.
TABLE 23-2 -- Formulae for Estimating Glomerular Filtration Rate Using Serum Creatinine and Other Clinical Parameters
|
Formula |
Units |
Reference |
|
(100/Cr) - 12 if male |
ml/min/1.73 m2 |
Jelliffe[38] |
|
(80/Cr) - 7 if female |
||
|
(Wt · (29.3 - 0.203 · Age)/(Cr · 14.4), if male |
ml/min |
Mawer [39] [41] |
|
(Wt · (25.3 - 0.175 · Age)/(Cr · 14.4), if female |
||
|
(98 - 16 · (Age - 20)/20)/Cr, multiply by 0.90 if female |
ml/min/1.73 m2 |
Jelliffe[40] |
|
((140 - Age) · (Wt))/(72 · Cr), multiply by 0.85 if female |
ml/min |
Cockcroft and Gault[42] |
|
((145 - Age)/Cr) - 3, multiply by 0.85 if female |
ml/min/70 kg |
Hull[43] |
|
(27 - (0.173 · Age))/Cr, if male |
ml/min |
Bjornsson[46] |
|
(27 - (0.175 · Age))/Cr, if female |
||
|
7.58/(Cr · 0.0884) - 0.103 · Age + 0.096 · Wt - 6.66, if male |
ml/min/1.73 m2 (height2) |
Walser[52] |
|
6.05/(Cr · 0.0884) - 0.080 · Age + 0.080 · Wt - 4.81, if female |
||
|
170 · Cr-.999 · Age-.176 · (0.762 if female) · (1.180 if black) · SUN-.170 · Alb.318 |
ml/min/1.73 m2 |
Levey[53] |
|
Alb, serum albumin (g/dL); Cr, serum creatinine (mg/dL); SUN, serum urea nitrogen (mg/dL); Wt, body weight (kg). |
TABLE 23-3 -- Characteristics of an Ideal Endogenous or Exogenous Marker for Measuring Glomerular Filtration Rate
|
Constant production |
|
Safe |
|
Convenient |
|
Readily diffusible in extracellular space |
|
No protein binding and freely filterable |
|
No tubular reabsorption |
|
No tubular secretion |
|
No extrarenal elimination or degradation |
|
Accurate and reproducible assay |
|
No compounds interfere |
|
Inexpensive |
|
No influence on the GFR |
Whether endogenous or exogenous, an ideal indicator would distribute freely and instantaneously throughout the extracellular space. It would not bind to plasma proteins and would be freely filtered at the glomerulus. It would be subject to neither excretion nor reabsorption in the tubules or urinary collecting system. It would be completely resistant to degradation, and its elimination would be entirely dependent on glomerular filtration. It would be easy to measure in plasma and in urine, and nothing would interfere with the assay. Ideally, the inter- and intrapatient coefficient of variation would be low.
Obviously, the ideal marker for measuring GFR has yet to be discovered. Nevertheless, a mythical gold standard obeys principles that should be considered in any discussion of methods used to measure GFR. Actual methods will violate these principles in different ways and with different tradeoffs of accuracy and practicality. In the end, these tradeoffs can be tailored to the clinical situation, taking into account estimated prior probabilities, to achieve a maximum amount of information for a minimum cost. The question is not which test is best, but which test is best suited for the clinical situation at hand.
Plasma Urea
Urea was one of the first indicators used to measure GFR. Unfortunately, it shares few of the attributes of an ideal marker, and plasma urea has been shown to be a poor measure of GFR. Urea production is variable and is largely dependent on protein intake. Although one quarter of the urea produced is metabolized in the intestine, the ammonia produced is reconverted to urea. Thus, most of the urea is ultimately excreted by the kidneys. With a molecular weight of 60 Da, urea is freely filtered at the glomerulus. However, it can be readily reabsorbed, and the amount of tubular reabsorption is variable. Indeed, medullary collecting duct urea reabsorption is functionally linked to water reabsorption. In states of diuresis and low levels of antidiuretic hormone, the medullary collecting duct is relatively impermeable to urea. However, in states of decreased effective intravascular volume, low urine tubular flow, and increased antidiuretic hormone, urea reabsorption can be substantial.[4]
Plasma urea, or blood urea nitrogen (BUN), concentration is affected by a number of factors other than alterations in GFR. As indicated previously, increased plasma urea levels accompany decreased urine flow in patients with intravascular volume depletion, as occurs following the administration of diuretics. Congestive heart failure also raises plasma urea, probably by similar mechanisms. Increased plasma levels that are probably caused by increased production are seen with elevated dietary protein intake, gastrointestinal bleeding, and tetracycline use. On the other hand, reduced levels of plasma urea can be seen in patients with alcohol abuse and chronic liver disease.[4]
Some substances can interfere with the laboratory determination of urea. Substances that can give falsely high urea levels include acetohexamide, allantoin, aminosalicylic acid, bilirubin (very high levels), chloral hydrate, dextran, free hemoglobin, hydantoin derivatives, lipids (lipemia), sulfonamides, tetracycline, thiourea, and uric acid.[5] Substances that can give falsely low analytical values of urea include ascorbic acid, levodopa, lipids (lipemia), and streptomycin.[6]
Urea Clearance
Because of tubular urea reabsorption, renal urea clearance usually underestimates GFR. Urea clearance can be as little as one half or less of the GFR as measured by other techniques. As with plasma urea, the state of hydration can markedly influence urea clearance. However, the degree of underestimation of glomerular filtration and the tendency for urea clearance to vary with the state of hydration are both less in patients with markedly reduced renal function. Moreover, because creatinine clearance overestimates GFR, some investigators have suggested that the mean of creatinine and urea clearance would be a reasonable estimate of GFR, at least in patients with low levels of renal function.[4] In a large enough sample of patients, errors from tubular reabsorption of urea may negate errors from tubular secretion of creatinine, so that mean urea and creatinine clearances may better approximate the true GFR. However, the factors that affect tubular creatinine secretion and urea reabsorption are different, and any tendency for “two wrongs to make a right” would likely be coincidental and infrequent in a given patient.
Urea clearance determinations are made by measuring renal urea excretion. The accuracy of any clearance technique that relies on urine excretion measurements is compromised by problems associated with obtaining accurate urine collections. Twenty-four-hour collections are inconvenient and difficult for most patients to perform. Patients should be instructed to empty the bladder, note the time, and save all subsequent urine, including urine voided at exactly the same time 24 hours from the time of initiation. They should be warned to empty the bladder before defecation to avoid inadvertent loss of urine. The completeness of 24-hour urine collections can be examined by measuring creatinine excretion (see later). Shorter collection times enhance patient compliance but provide samples for only a portion of the day, during which GFR varies in a diurnal pattern. Incomplete bladder emptying can also reduce the accuracy of timed urine collections. Incomplete bladder emptying can be obviated by catheterization, but the discomfort, risk, and inconvenience often make it unacceptable.
Serum Creatinine
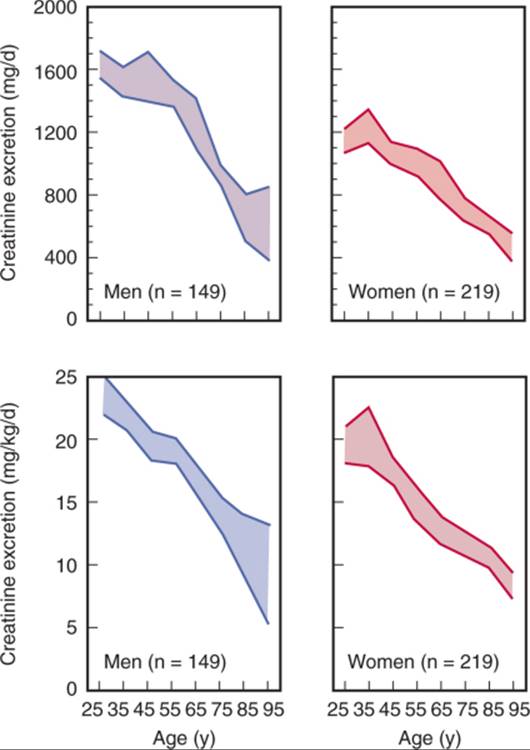
Creatinine is a metabolic product of creatine and phosphocreatine, both of which are found almost exclusively in muscle. Thus, creatinine production is proportional to muscle mass and varies little from day to day. However, production can change over longer periods of time if there is a change in muscle mass. Age- and gender-associated differences in creatinine production are also largely attributable to differences in muscle mass.[4] Although diet ordinarily accounts for a relatively small proportion of overall creatinine excretion, it is another source of variability in serum creatinine levels. Creatine from ingested meat is converted to creatinine and can be the source for up to 30% of total creatinine excretion. Thus, variability in meat intake can also contribute to variability in serum creatinine levels. The conversion of creatine to creatinine can occur with cooking. Because creatinine is readily absorbed from the gastrointestinal tract, ingesting cooked meat can lead to a rapid increase in serum creatinine levels.[4]
Creatinine is small (molecular weight 113 Da), does not bind to plasma proteins, and is freely filtered by the renal glomerulus. However, it has long been appreciated that creatinine is also secreted by the renal tubule. Secretion is a saturable process that probably occurs via the organic cation pathway and is blocked by some commonly used medications including cimetidine, trimethoprim, pyrimethamine, and dapsone.[4] If tubular secretion of creatinine were constant, differences in serum creatinine and renal clearance could still reflect differences in GFR. However, evidence suggests that the secretion of creatinine varies substantially in the same individuals over time, between individuals, and between laboratories. [7] [8] Particularly troublesome is the fact that the proportion of total renal creatinine excretion due to tubular secretion increases with decreasing renal function [7] [9]; this feature could have a dampening effect on serial measurements in individuals, because GFR could fall more rapidly than indicated by either serum creatinine or creatinine clearance.
Although proportional tubular secretion of creatinine increases with decreasing GFR, total urine creatinine excretion actually declines[7] owing to the fact that extrarenal creatinine degradation increases with declining renal function.[10] [11] Indeed, it has been shown that increased extrarenal creatinine degradation may be sufficient to entirely account for the decrease in urine creatinine excretion associated with declining GFR.[10] The extrarenal degradation of creatinine has been attributed to its conversion to carbon dioxide and methylamine by bacteria in the intestine.[12] Because of the increase in extrarenal creatinine degradation with declining kidney function, plasma creatinine can be expected to underestimate declines in GFR.
A number of methods are used to measure creatinine. [13] [14] [15] [16] [17] The original Folin-Wu method used the Jaffú reaction, which has been used with various modifications since.[4] The method of Hare involved the isolation of creatinine by absorption on Lloyd's reagent.[14] The direct alkaline picrate method of Bonsnes and Taussky[13] has been used. This method involves the complexing of creatinine with alkaline picrate and measurement using a colorimetric technique. The Jaffú reaction has also been adapted for use on autoanalyzers. Other methods currently in use employ O-nitrobenzaldehyde (Sakaguchi reaction) and imidohydrolase.[17]
There is probably more variation in what laboratories report as the upper limit of normal for serum creatinine than for any other standard chemistry value.[18] In the absence of procedures to remove noncreatinine chromogens, the upper limit of the normal measured by the Jaffú reaction may be as high as 1.6 to 1.9 mg/dL for adults (to covert mg/dL to mmol/L, multiply by 88.4). The upper limit of normal for serum creatinine measured by autoanalyzer or the imidohydrolase method is usually 1.2 to 1.4 mg/dL. Some laboratories will report separate normal ranges for men and women and for adults and children. Besides differences in methods, differences in equipment may also affect plasma creatinine concentrations. Miller and co-workers[19] evaluated over 5000 laboratories using 20 different instruments to measure creatinine by up to three different alkaline picrate methods and found that the mean serum creatinine concentration on a standardized sample ranged from 0.84 to 1.21 mg/dL. The bias, which describes the systematic deviation from the gold standard measure related to the instrument manufacturer, was greater than that due to the alkaline picrate method.
A number of normal plasma constituents can interfere with creatinine measurement. Glucose, fructose, pyruvate, acetoacetate, uric acid, ascorbic acid, and plasma proteins can all cause the Jaffú colorimetric assay to yield falsely high creatinine values.[4] The low levels of these substances generally do not interfere with the Jaffú assay of creatinine in urine. Normally, interfering chromogens increase the creatinine result by about 20%, but in some disease states, the interference can be much greater. In diabetic ketoacidosis, for example, spurious elevations in serum creatinine can be significant. Cephalosporin antibiotics can also interfere with the Jaffú reaction. [20] [21] [22] [23] One study showed that, in marked renal insufficiency, serum creatinine rises and noncreatinine chromogens contribute proportionally less to the total reaction.[24] In individuals with normal kidney function, noncreatinine chromogens made up 14% (range 4.5%–22.3%) of the total, whereas in individuals with serum creatinine levels ranging from 5.6 to 29.4 mg/dL, noncreatinine chromogens contributed only 5% (range 0%–14.6%) to the total measured level.[24]This same study found no effect of the noncreatinine chromogens on the variability of plasma values.
Several modifications in the classic Jaffú assay have been designed to remove interfering chromogens before analysis,[16] including deproteinization with specific adsorption of creatinine using Fuller earth and ion-exchange resins, the measurement of Jaffú-positive chromogens before and after the destruction of creatinine with bacteria, and dialysis separation. These methods have largely been replaced by less costly and more convenient autoanalyzer techniques. Autoanalyzer methods utilize the Jaffú reaction, but separate creatinine from noncreatinine chromogens by the rate of color development,[16] thus avoiding most of the interference seen with the standard Jaffú method.[25] However, very high serum bilirubin levels can cause falsely low creatinine levels.[26] Newer techniques measuring true serum creatinine give plasma levels that are slightly lower than those from the Jaffú assay method.[16] The imidohydrolase method can be perturbed by extremely high glucose levels,[17] and by the antifungal agent 5-flucytosine.[4] K/DOQI guidelines recommend that auto-analyzer manufacturers and clinical laboratories calibrate serum creatinine assays using an international standard.[3]
Serum creatinine is probably the most widely used indirect measure of GFR, its popularity attributable to convenience and low cost. Unfortunately, serum creatinine is very insensitive to even substantial declines in GFR. The GFR measured by more accurate techniques (described later) may be reduced by up to 50% before serum creatinine becomes elevated.[4] In addition, the correct interpretation of serum creatinine in the clinical setting is problematic. Failure to consider variation in creatinine production due to differences in muscle mass frequently leads to misinterpretation of serum creatinine levels. This confusion may be compounded by the use of standard normal ranges for serum creatinine levels that appear on routine laboratory reports. For example, a serum creatinine that falls in the “normal” range may indicate a normal GFR in a young, healthy individual. However, the same serum creatinine in an elderly individual could indicate a twofold reduction in GFR owing to a comparable reduction in muscle mass.[4] Therefore, K/DOQI guidelines recommend that clinical laboratories report serum creatinine with an estimated GFR using a serum creatinine-based formula[3] (see Table 23-2 ).
Muscle mass may also decline over a relatively short period of time. For example, significant declines in creatinine excretion were seen in patients undergoing kidney transplantation, especially those who had chronic declines in allograft function.[27] The decline in creatinine excretion was probably due to decreases in muscle mass from multiple causes, including the effects of corticosteroids. As a result of the reduction in muscle mass, changes in serum creatinine underestimated the amount of decline in kidney function.[4]
Failure to remember the potential effects of tubular secretion on serum creatinine, especially in patients with reduced kidney function, may lead the clinician to believe that renal function is better than it actually is. One study has suggested that tubular secretion of creatinine is significant in patients with nephritic syndrome and decreased serum albumin levels.[8] Moreover, the potential for interference from plasma constituents and medications requires the clinician to know what assay is being used to measure serum creatinine. One the basis of whether the reported upper limit of normal for adults is high (1.4–1.9 mg/dL) or low (1.2–1.4 mg/dL), it may sometimes be possible to correctly surmise whether an unmodified alkaline picrate-Jaffú reaction (higher normal limits) or a newer method that removes interference with chromogens (lower normal limits) is being used. The clinician should also be aware of the precision of the assay. Precision is commonly measured by the coefficient of variation, which is the mean of replicate samples divided by the standard deviation.
Creatinine Clearance
Measuring creatinine clearance obviates some of the problems of using serum creatinine as a marker of GFR but creates others. Differences in steady-state creatinine production due to differences in muscle mass that affect serum creatinine should not affect creatinine clearance. Extrarenal elimination of creatinine should have little influence on the ability of the creatinine clearance to estimate GFR. However, the reliability of creatinine clearance is greatly diminished by variability in tubular secretion of creatinine and by the inability of most patients to accurately collect timed urine samples. Indeed, some investigators [28] [29] have argued that the creatinine clearance rate is a less reliable measure of GFR than serum creatinine and should be abandoned.
Tubular secretion of creatinine gives a creatinine clearance rate that overestimates the true GFR. The overestimation is reduced somewhat if serum and urine creatinine are both measured by the Jaffú method. As discussed, plasma constituents tend to falsely raise the serum creatinine level as measured by the Jaffú assay, while urine creatinine levels are largely unaffected. Thus, creatinine clearance determinations calculated from serum and urine creatinine levels measured with the Jaffú assay tend to be falsely low. In a given population of patients, this error will tend to cancel the error introduced by tubular creatinine secretion, and the creatinine clearance rate GFR. However, the two errors are independent, and the occurrence of opposing errors of the same magnitude in the same patient is largely a result of chance.[4]
Thus, variability in the precision of creatinine clearance rate as an estimate of true GFR is not reduced and may be increased by this fortuitous combination of errors. Indeed, the creatinine clearance rate determined in 30 patients with a total chromogen method was only 9% higher than inulin clearance, although the true creatinine clearance was 31% higher.[4] However, the correlation coefficient with inulin clearance compared with the true creatinine clearance was much better (r = 0.96) than the correlation coefficient for inulin clearance compared with the total chromogen creatinine clearance (r = 0.86), suggesting that the latter technique was more accurate but less precise.
Prolonged storage of the urine can introduce error in the creatinine clearance determination by perturbing urine creatinine levels. High temperature and low urine pH enhance the conversion of creatine to creatinine in urine.[30]Indeed, storing urine under adverse conditions for 24 hours was shown to cause a 20% increase in the amount of measured urine creatinine.[30] This problem can be obviated by refrigerating urine samples and by measuring the urine creatinine level without undue delay.
Tubular secretion of creatinine would cause little difficulty if it was constant, and a constant correction factor could be subtracted from creatinine clearance determinations to yield a more accurate estimate of GFR. Unfortunately, interpatient and intrapatient variability in tubular creatinine secretion makes such an approach impossible. The tendency for tubular secretion to rise proportionally with declining levels of kidney function, for example, decreases the usefulness of creatinine clearance determinations as accurate reflections of GFR in patients with kidney disease.[9]
As mentioned earlier for urea clearance, all renal clearance techniques that rely on measuring a marker of GFR in the urine are subject to the vagaries of urine collection. Variability in the adequacy of timed urine samples can introduce substantial error in the clearance determination. Having patients perform urine collections under direct supervision of trained personnel can enhance the accuracy of timed collections. However, decreasing the duration of urine collection may increase the contribution of errors due to incomplete bladder emptying, especially if urine volumes are not increased with water loading. In addition, short-interval urine collections negate the advantages of time-averaged GFR estimates made from 24-hour urine collection. The cost of the procedure can also be substantially higher if trained personnel are used to directly supervise urine collections in a clinic setting.
In principle, the renal clearance of creatinine is the urine creatinine excretion divided by the area under the plasma creatinine concentration time curve over the period of time in which the urine was sampled. In practice, creatinine clearance is usually measured by determining the urine creatinine excretion and sampling a single plasma creatinine value. It is then assumed that the plasma creatinine was constant over the time of the urine collection. Plasma creatinine remains relatively constant over 24 hours if food intake and activity are also constant.[31] However, in a 24-hour period, there may be substantial variability in plasma creatinine levels, largely due to effects of diet.[4]Thus, under usual clinical conditions, the assumption that plasma creatinine levels are constant during the period of urine collection may not valid and may, in fact, be a source of error.
The day-to-day coefficient of variation for serum creatinine is approximately 8%. [32] [33] Because two creatinine determinations must be made to calculate a creatinine clearance, the coefficient of variation of the creatinine clearance should be higher than that of serum creatinine level. Indeed, the coefficient of variation of creatinine clearance could be expected to be at least 11.3% (the square root of 2 times the square of 8%). This is, in fact, similar to the coefficient of variation for creatinine clearance reported in at least one investigation.[33] Other researchers[34] have reported a day-to-day coefficient of variation for creatinine clearance, when carried out in the routine clinical setting, as high as 27%.
Cimetidine-Enhanced Creatinine Clearance
Because tubular secretion of creatinine is a major limitation of the creatinine clearance, several investigators [35] [36] have tried to enhance the accuracy of creatinine clearance by blocking tubular creatinine secretion with the histamine-2 receptor antagonist cimetidine. In these studies, cimetidine substantially improved the creatinine clearance estimate of GFR in patients with mild to moderate renal impairment. However, in many patients, tubular secretion of creatinine was not completely blocked, and the cimetidine-enhanced creati-nine clearance value still overestimated GFR in these individuals.
A cimetidine-enhanced creatinine clearance measurement requires little additional cooperation from the patient than a standard creatinine clearance. Cimetidine is very safe; indeed, one study reported that the incidence of adverse reactions during prolonged treatment of 622 patients with cimetidine (10.9%) was similar to that seen during treatment of 516 patients with placebo (10.1%).[37] Because the cimetidine-enhanced creatinine clearance rate can be measured in most clinical laboratories, it may especially useful for patients who live in areas in which more expensive GFR measurement techniques are not readily available. Although it will not replace other, more accurate methods for measuring GFR, the cimetidine-enhanced creatinine clearance could prove to be a cost-effective alternative in many clinical situations.
Serum Creatinine Formulas to Estimate Kidney Function
The need to collect a urine sample remains a major limitation of the creatinine clearance technique, with or without cimetidine enhancement. Therefore, many attempts have been made to mathematically transform or correct serum creatinine so that it may more accurately reflect GFR (see Table 23-2 ). [29] [38] [39] [40] [41] [42] [43] [44] [45] [46] [47] [48] [49] [50] [51] [52] [53] Under ideal conditions, GFR, as measured by a marker such as creatinine, should be equal to the inverse of the creatinine value multiplied by a constant rate of creatinine GFR. However, changes in creatinine production, extrarenal elimination, and tubular secretion of creatinine can all create errors in the use of inverse creatinine value to measure changes in GFR. Indeed, none of the shortcomings of using serum creatinine as a marker of GFR is avoided by using inverse creatinine value.[4]
One of the problems with using creatinine or its inverse as a measure of GFR is that interpatient and intrapatient differences in creatinine production often occur. Variations in creatinine production owing to age- and sex-related differences in muscle mass have been measured and have been incorporated in formulas to improve the ability of serum creatinine to estimate GFR. The most widely used formula is that of Cockcroft and Gault,[42] which reduces the variability of serum creatinine estimates of glomerular filtration measured in a population of men and women of different ages. However, the formula does not take into account differences in creatinine production between individuals of the same age and sex or even in the same individual over time. [45] [47] The formula systematically overestimates GFR in individuals who are obese or edematous.[47] Moreover, it does not take into account extrarenal elimination, tubular handling, or inaccuracies in the laboratory measurement of creatinine that can contribute to error in the serum creatinine estimate of GFR. With readily available parameters and relative simplicity, the Cockcroft-Gault formula has maintained widespread support. In subjects screened for the African-American Study of Kidney Disease and Hypertension pilot study, outpatient 24-hour urine collections and timed creatinine clearances offered no more precision than the Cockcroft-Gault formula, despite requiring substantially more time and effort.[8]
The GFR has probably never been measured with more accuracy in a large population of patients than it was in the Modification of Diet in Renal Disease (MDRD) Study. The investigators[54] used the isotopically measured GFR determinations from the MDRD study to derive a formula for estimating GFR using only readily measurable clinical variables. Significantly, they derived the formula on a randomly selected subset of patients from the whole population, and then tested the formula in the remainder of the population. A formula, sometimes referred to as the MDRD study equation or the Levey formula, uses only serum chemistry values (creatinine, urea, and albumin) and patient characteristics (age, gender, and race). It was able to predict 90.3% of the variability in isotopically measured GFR in the validation sample (see Table 23-2 ).[53] A simplified version requiring only serum creatinine value, age, race, and gender was found to similarly correlate with measured GFR.[55]
Levey and colleagues[53] cautioned against the immediate application of theses formulas in patient subgroups not represented in the initial study, including individuals with normal kidney function, patients with type 1 diabetes, elderly persons, and kidney transplant recipients. It cannot be assumed that formulas to predict kidney function derived from data for one patient population will be valid when applied to another population. For example, few diabetic individuals were included in some of the original studies that examined formulas for predicting GFR. When these formulas were subsequently tested in diabetic patients, they were found by some investigators[56] to be inaccurate. Several small studies have indicated some degree of inaccuracy in the use of the MDRD equation for subjects with normal kidney function.[57] However, the National Kidney Foundation's K/DOQI guidelines consider the MDRD equation a reliable measure for GFR in adults,[3] and the European Best Practice Guidelines Expert Group on Hemodialysis prefers it over the Cockcroft-Gault equation for individuals with advanced kidney failure.[58]
Serum creatinine formulas to estimate the GFR may not be reliable in certain individuals. Individuals on a vegetarian diet, consuming creatinine supplements, with unusual muscle mass, with unusual weight (morbid obesity, amputation), or pregnant woman were not included in the study populations that were used to generate these formulas. Likewise, the formulas are not accurate for individuals with normal or near-normal kidney function [57] [59] and ethnic groups.[60] Therefore, such individuals may have better measurement of clearance utilizing a 24-hour urine sample for creatinine clearance. For example, among healthy individuals such as kidney donors, the MDRD formula underestimated GFR.[59] In kidney transplant recipients, the MDRD provided variable results.[61]
Serum Cystatin C
Several low-molecular-weight (LMW) proteins have been evaluated as endogenous markers of GFR, with cystatin C commanding the most attention. The use of serum cystatin C as a marker of GFR was first suggested in 1985, when Simonsen and co-workers[62] demonstrated a correlation between reciprocal cystatin C values and 51Cr-labeled ethylenediaminetetraacetic acid (51Cr-EDTA) clearance. Since then, numerous investigators [63] [64] [65] [66] have shown that cystatin C may be a particularly good marker of GFR. Cystatin C is a 13-kD basic protein of the cystatin superfamily of cysteine proteinase inhibitors. It is synthesized by all nucleated cells at a constant rate, fulfilling an important criterion for any endogenous marker of GFR. [67] [68] In most studies, production of cystatin C is not altered by inflammatory processes, [62] [63] by muscle mass,[69] or by gender.[70] One study did find higher levels of cystatin C in males, older patients, and those with greater height and weights. However, the study utilized 24-hour urine collections to determine creatinine clearance as the gold standard for kidney function.[71] Another study found that inflammation or immunosuppression therapy may affect cystatin C levels.[72] Concentrations of cystatin C are highest in the first days of life and rapidly decrease during the first 4 months, likely due to maturation of the glomerular filtration capacity. [73] [74] In children older than 1 year, cystatin C levels stabilize and approximate those of adults. [73] [74] An increase in levels after the 5th decade reflects the age-related decline in GFR and contrasts with stable serum creatinine values, presumably due to a decline in muscle mass with age.[75] Because of its LMW and positive charge at physiologic pH, cystatin C freely passes the glomerular filter. It is not secreted, but proximal tubular cells reabsorb and catabolize the filtered cystatin C, resulting in very low urinary concentrations. [63] [76] Although calculation of GFR using urinary cystatin C is not possible, some investigators[77] have speculated that urinary cystatin C could serve as a marker for renal tubular dysfunction.
Cystatin C can be measured using any of a number of radioimmunoassays, fluorescent, or enzymatic immunoassays.[68] Because these methods are slow and relatively imprecise, widespread clinical use is not feasible. Latex immunoassays employing latex particles conjugated with cystatin C-specific antibody demonstrate greater precision, produce more consistent reference intervals, and are far quicker.[68] Particle-enhanced turbidimetric immunoassay (PETIA) [64] [65] [70] and particle-enhanced nephelometric immunoassay (PENIA) [75] [78] [79] are the two available versions of latex immunoassay. On the basis of a 2002 meta-analysis, immunonephelometric methods appear to be superior to other assays when measuring cystatin C.[80]
Studies in a number of patients have shown that serum cystatin C may be more sensitive and specific than serum creatinine value for signifying early changes in isotopically determined GFR. [65] [66] [72] ROC analysis of one of these studies demonstrated superiority of accuracy of cystatin C over creatinine in patients with reduced GFR.[64] In addition, small reductions in GFR appear to be detected more easily using cystatin C measurement than with creatinine determination. [65] [66] Other studies have indicated that cystatin C determination has a greater ability to detect subclinical kidney dysfunction than using creatinine measurement.[81] Coll and colleagues[81] demonstrated that cystatin C levels rose when GFR fell to 88 mL/min/1.73 m2 and that creatinine levels did not rise until GFR dropped to 75 mL/min/1.73 m2. However, ROC analysis showed no difference in the diagnostic accuracy of the two tests.[81] Likewise, several other studies have not shown a significant difference between cystatin C and creatinine determinations, despite a trend toward greater accuracy with cystatin C. [82] [83] [84] A meta-analysis[80] incorporating studies published in 46 articles and 8 abstracts and using standard measures of GFR suggested superiority of reciprocal cystatin C value over reciprocal serum creatinine level as a marker of GFR.[80] Superior correlation coefficients and greater ROC-plot area under the curve (AUC) values were calculated for cystatin C. The authors of this meta-analysis speculated that prior studies indicating a lack of superiority of cystatin C could reflect a type II error or differences caused by assay methods.
Cystatin C has also been examined in a diverse number of groups. In children, cystatin C measurement appears to be at least as useful as serum creatinine determination in assessing GFR, although the number of children studied who were younger than 4 years is small. This age subgroup, for which serum creatinine levels have been unreliable, might arguably be most benefited by the measurement of cystatin C to evaluate GFR. Cystatin C has been favorably evaluated in other similar subgroups, including patients with cirrhosis,[83] spinal cord injury,[85] and rheumatoid arthritis,[86] as well as elderly patients. [87] [88] In diabetic patients, results have been mixed. [89] [90]
In kidney transplant recipients, cystatin C value has been found to be more sensitive than serum creatinine level in detecting decreases in GFR. [91] [92] However, some investigators have shown that cystatin C values underestimate GFR in this population.[93] In one study, levels of cystatin C were significantly higher in 54 pediatric kidney transplant recipients than in 56 control subjects with similar GFR values.[93] The reason for this result is not clear. However, corticosteroids have been implicated, given the finding of elevation of cystatin C in asthmatic patients treated with corticosteroids[94] and in in vitro experiments demonstrating a dose-dependent rise in cystatin C production in HeLa cells treated with dezamethasone.[95] A case-control study of kidney transplant recipients showed a dose-dependent increase in cystatin C in individuals who were receiving corticosteroids compared with those who were not.[96] In contrast, corticosteroids did not raise levels of cystatin C in a group of children treated for nephritic syndrome.[97] Mixed conclusions of other studies evaluating cystatin C as a marker of GFR in transplant recipients[98] and the discrepancy in the effects of corticosteriods illustrate a need for further studies in this population. Furthermore, the cost of the cystatin C assay, the difficulty in making the assay universally available, and the potentially high intraindividual variability in the determination of cystatin C levels are all issues that require attention if this particular marker is to be used in clinical practice. [99] [100] Currently, there is no standard for serum cystatin C measurement.[101]
Inulin
Inulin was once considered the gold standard of exogenously administered markers of GFR. However, the scarcity and high cost all but eliminated its routine use. Inulin (molecular weight 5200 Da) is a polymer of fructose found in tubers such as the dahlia, the Jerusalem artichoke, and chicory. Inulin is inert and does not bind to plasma proteins. It distributes in extracellular fluid, is freely filtered at the glomerulus, and is neither reabsorbed nor secreted by renal tubules.[102] Inulin is readily measured in plasma and urine by one of several colorimetric assays. These assays are time consuming but can be adapted for use on an autoanalyzer. Glucose is also detected in most inulin assays and must, therefore, be either removed beforehand or measured independently in the sample and subtracted. In any case, appropriate care must be taken in patients with high plasma or urine glucose levels, especially if the levels fluctuate during the GFR determination.
The renal clearance method for using inulin to measure GFR was originally developed and championed by Homer Smith. Over the years, this technique has been used by many clinical investigators and has been modified only slightly. Generally, measurements are made under standardized conditions. Patients are typically studied in the morning, after an overnight fast. An oral water load of 10 to 15 mL/kg body weight is given before inulin is infused, and additional water is administered throughout the test to ensure a constant urine flow rate of at least 4 mL/min. When a good urine flow has been established, a loading dose of inulin is given, followed by a constant infusion to maintain plasma levels. Once a steady state has been achieved, several timed (generally 30-min) urine collections are carried out. Ideally, a bladder catheter is used to ensure the accuracy of the timed urine collections. Serial plasma levels of inulin are also measured.
Inulin clearance is calculated from the plasma level (time averaged), urine concentration, and urine flow rate. Usually, an average of three to five separate determinations is made. Each of these measurements is subject to inaccuracies; indeed, the coefficient of variation between clearance periods is 10%,[54] and the coefficient of variation of inulin clearance measured on different days in the same individual is approximately 7.5%.[54] No doubt, some of the variability in inulin clearance determinations made in the same individual are due to error in measurement, and some are due to true fluctuation in GFR (see later). It has been estimated that a difference of 20 mL/1.73 m2/min in the values of inulin clearances measured in the same individual on 2 separate days predicts a real difference in GFR at P < .05.[4] A difference of 27 mL/1.73 m2/min between measurements predicts a real difference at P < .01.[4]
The renal inulin clearance method has a number of drawbacks. Bladder catheterization is associated with some risk and is not readily accepted by many patients. Although inulin clearance measurements can be carried out using spontaneous voiding, incomplete bladder emptying can introduce additional variability. Unfortunately, no studies have compared inulin clearance results obtained using bladder catheterization with those obtained using spontaneous voiding. Problems with residual urine are most likely to occur in individuals with prostatism and in patients with neurogenic bladder dysfunction. High urine volumes probably help reduce the effect of incomplete bladder emptying, but water loading is itself uncomfortable for many patients. It has been noted that inulin clearance tends to decline during serial urine collections, in part as a result of the difficulty patients have in maintaining a high water intake throughout the procedure. Use of an intravenous cannula and a constant infusion is another source of discomfort and inconvenience. Thus, despite its accuracy, the renal inulin clearance technique is cumbersome and inconvenient.
To avoid problems related to urine collection, many investigators have turned to plasma clearance techniques. Plasma clearance can be measured with the use of either a constant infusion or a bolus injection.[103] If, during a constant infusion, both the distribution space and the plasma level of inulin are constant, the rate of infusion will be equal to the rate of elimination. The inulin clearance then becomes the rate of infusion divided by the plasma concentration. There is a high degree of correlation between results from this technique and those from the renal clearance method.[103] However, maintaining constant plasma concentrations is very difficult, [104] [105] and the constant infusion technique is rarely used. The bolus injection technique has been used with inulin,[106] and this technique is discussed in greater detail in the section on radionuclide and radiocontrast markers of GFR.
As previously noted, a number of problems limit the usefulness of inulin as a marker of GFR. Although most data suggest that inulin is freely filtered and is not handled by the renal tubules, this indication may not be true in all clinical situations. For example, it has been suggested that impaired filtration, back-diffusion of inulin, or both can limit its usefulness in kidney transplant recipients.[107] However, the decline in the use of inulin as a marker of GFR has largely been due to its scarcity and cost.
Radionuclide and Radiocontrast Markers of Glomerular Filtration Rate
Any of several radionuclide-labeled and unlabeled radiocontrast markers of GFR can be used in either renal or plasma clearance studies. Estimating GFR by plasma clearance of an intravenous bolus injection of an indicator is convenient and has been used more often than constant infusion or renal clearance techniques. The assumptions underlying the measurement of renal clearance using a single injection technique are critical. Basically, renal clearance is measured as the plasma clearance, or the amount of indicator injected divided by the integrated area of the plasma concentration curve over time.[108] Because it is not possible to measure enough samples to accurately determine the area under the plasma concentration time curve, estimation of this area is based on mathematical formulations that describe the decline in plasma levels over time.
Models used to estimate plasma clearance assume that the volume of distribution and renal excretion are constant over time and that there is no extrarenal excretion. A constant renal excretion has been demonstrated for at least two indicators, 125I-iothalamate and 51Cr-EDTA.[109] However, underestimation of GFR with the use of technetium-radiolabeled diethylenetriaminepenta-acetic acid (125mTc-DTPA) may be due to plasma protein binding and decreasing renal clearance over time. [110] [111] Other researchers[112] have shown that there is a small, constant overestimation of plasma compared with renal clearance of 51Cr-EDTA.
Although the indicator is eliminated directly from the arterial circulation, it is injected intravenously, and blood samples to measure the plasma clearance are drawn from the venous compartment. The assumption that there is instantaneous equilibration between the arterial and the venous circulation is incorrect.[4] Thus, any method used to calculate renal clearance must correct for inaccuracies due to delayed equilibration between the venous and the arterial compartments.
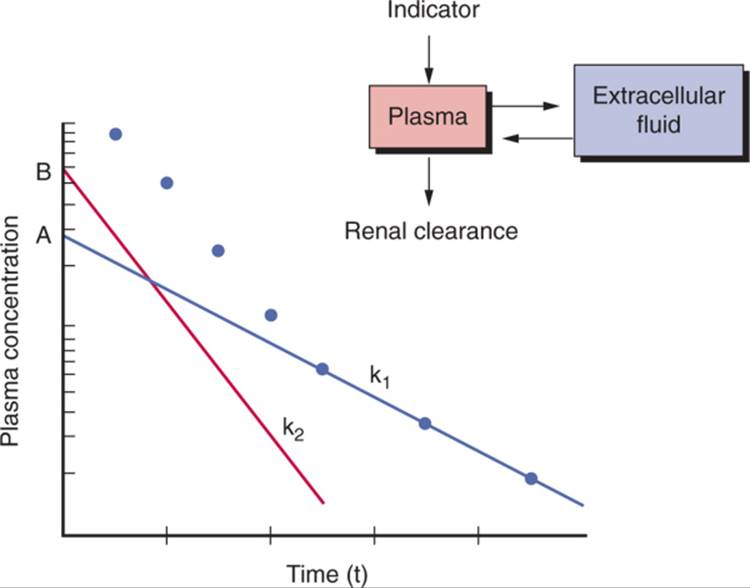
Because it is not possible to measure the entire plasma concentration time curve, a limited number of samples must be measured, and an appropriate curve fitted to these points must be used to measure the plasma clearance. Both one- and two-compartment models have been used to measure plasma clearance ( Fig. 23-2 ). In the two-compartment model, the first compartment can be thought of as corresponding to plasma and the second to extracellular fluid.[4] Two slopes and two intercepts are derived from plotting plasma values over time after injection.[113] One slope and intercept are derived from the initial data that fit a straight line when plotted on a logarithmic scale, and the other slope and intercept are derived from a line that fits the data of the terminal elimination phase.
|
|
|
|
|
|
|
FIGURE 23-2 Plasma disappearance curve for the indicator of GFR after bolus intravenous administration. Dots represent measured concentrations. The line with slope k1 and intercept A is the least-squares best fit of the terminal elimination phase. The line with slope k2 and intercept B represents best fit of the difference between actual values and values calculated from the line fitted to the terminal elimination phase. GFR (one-compartment method) is calculated as Qk1/A, where Q is the quantity of indicator administered. GFR (two-compartment method) is calculated as Qk1k2/(Ak2 + Bk1). |
|
Unfortunately, the two-compartment method, although more accurate than the one-compartment model, requires more frequent plasma sampling. Therefore, most investigators now use a one-compartment model, whereby only values measured during the terminal elimination phase (generally commencing 90–120 min after injection) are sampled. In this model, the slope and intercept of a line plotted on a logarithmic scale are used to calculate clearance by the formula:
|
|
Clearance = Vo (ln(2))/t1/2 |
where Vo is the volume of distribution, and t1/2 is the half-time for decay in plasma levels. The value derived from this relationship is multiplied by a constant to correct for systematic errors attributable to overestimation of Vo and a higher concentration of marker in venous compared with arterial blood. The clearance calculated using this simple monoexponential model is surprisingly accurate.[4] Also surprising is the fact that as few as two samples yield results that seem to be as accurate as multiple samples.[114]
Single-sample techniques have also been used to estimate plasma clearance.[115] One such method was based on the use of different sampling times dictated by the predicted GFR.[115] Tepe and co-workers[116] compared different sampling times using monoexponential models for GFR determinations in 139 subjects. They found that a single-sample method was accurate, and that sampling between 60 and 240 minutes after injection was optimal. Other researchers have confirmed that single-sample techniques can give reasonably accurate estimates of GFR that are generally suitable for clinical practice. [117] [118] Nevertheless, multiple sampling yields a GFR determination that is more accurate than that obtained by single-sample techniques and may, therefore, be more suitable for clinical investigations that must detect small differences in changes in GFR between patients.[119] There is some controversy over the applicability of standard adult formulas for calculating GFR in children using single-sample techniques, [120] [121] and further study is required.
Whether single or multiple samples are used with a monoexponential model, it is probably important that the sampling time be adjusted to the level of kidney function. [108] [119] To sample after only 2 hours may be too soon for patients with normal to moderately decreased kidney function[109]; a sampling time of 4 to 5 hours after injection is probably more appropriate.[108] However, this interval may be too short in individuals with more marked declines in kidney function or in patients with ascites. In such patients, sampling times up to 24 hours may be appropriate.[108]
The use of radiolabeling and very sensitive high-performance liquid chromatography (HPLC) detection methods have reduced the amount of marker that needs to be administered, and this, in turn, has permitted subcutaneous administration.[122] It has been shown that reasonably predictable plasma concentrations can be achieved after subcutaneous injection of a radiolabeled marker such as 125I-iothalamate. Thus, the renal clearance of such a marker can be measured after subcutaneous injection.
The measurement of plasma clearance need not require plasma sampling. A gamma camera positioned over the kidneys can be used to measure renal elimination of a radioactive indicator. [123] [124] Quantitative renal imaging most commonly uses 99mTc-DTPA, radioiodinated iodohippuran (Hippuran), 123I-ortho-iodohippurate, or 99mTc-mercaptoacetyltriglycine (MAG3). [123] [125] Estimation of GFR has now been combined with computed tomography (CT) using radiocontrast agents.[126] Magnetic resonance imaging (MRI) has also been proposed as a method for estimating GFR and renal blood flow.[127]
In general, GFR determination through quantitative renal imaging is not as precise as that arrived at through plasma sampling. [125] [128] The advantage of quantitative renal imaging is that additional information pertaining to the anatomy of renal function can be obtained. Indeed, the “split function” or relative contribution to total GFR from each kidney can be calculated. This information can be important in the evaluation of some patients with renal vascular disease and can be crucial in certain circumstances (e.g., in deciding whether or not to carry out a unilateral nephrectomy). Although currently experimental, MRI techniques may someday provide quantitative information on regional cortical and medullary perfusion. Another potential application of techniques that measure isotopes externally may exploit the rapidity with which measurements can be obtained to monitor acute changes in kidney function. Indeed, miniaturized external monitoring devices have been applied to real-time monitoring of kidney function using 99mTc-DTPA.[129]
It is assumed that, whatever indicator is used to measure plasma clearance, it is not extensively protein bound, is freely filtered, is neither secreted nor reabsorbed by the tubules, and is eliminated only by the kidneys. A number of radionuclide and radiocontrast markers have been developed to measure GFR. In general, they share most of the characteristics of inulin that make it a good indicator of GFR. The popularity of these radionuclide-labeled agents is attributable to their ready availability, ease of administration, relatively low cost, and accuracy of laboratory assay.
Probably the most extensively investigated radionuclide-bound indicator of GFR has been 51Cr-EDTA.[4] It is small (molecular weight 292 Da), appears to have little binding to plasma proteins, and is freely filtered by the glomerulus. Studies in humans have shown that the renal clearance of 51Cr-EDTA is about 10% lower than that of inulin when both are measured simultaneously. Although the reason for these lower values is not known, it could be due to plasma protein binding, tubular reabsorption, or in vivo dissociation of the nuclide from EDTA.
Iothalamate sodium, a derivative of triiodobenzoic acid, is a high-osmolar, ionic radiocontrast agent. It is small (molecular weight 614 Da) and appears to be only slightly bound to plasma proteins. Several studies in humans have found that simultaneously measured renal clearances of 125I-iothalamate and inulin are similar,[4] but whether this finding resulted from similar renal handling of inulin and iothalamate or whether there was a fortuitous cancellation of errors due, for example, to plasma protein binding countering the effects of tubular secretion is unclear. The use of 125I-iothalamate to measure kidney function is generally considered safe, although there are virtually no long-term follow-up data. The potential problem of thyroid uptake and concentration of the radionuclide can be avoided by administering a large dose of oral iodine (Lugol's solution) prior to the procedure. The half-life of 125I is approximately 60 days.[4]
DTPA (molecular weight 393 Da) has frequently been chelated to radionuclides for use in renal imaging.[123] The one most commonly used to measure GFR is 99mTc-DTPA. [130] [131] The radiolabeling of DTPA with 99mTc must be carried out immediately before use owing to the chelate's instability. The half-life of 99mTc is only 6 hours, so samples must be counted soon after the procedure.[123] Protein binding of 99mTc-DTPA may be a significant source of error in some patients. [110] [111] A comparison of clearance measurements based on whole plasma and protein-free, ultrafiltered plasma found significant differences, especially in patients taking multiple medications.[128]
All radionuclide markers are radioactive. This fact has begun to erode their acceptance by patients and has been subjected to close monitoring by regulatory agencies. In the United States, the storage and disposal of all radioactive waste has come under growing scrutiny and regulation, and the use of isotopes now requires that a number of conditions be met. The actual amount of radiation delivered to patients is generally considered to be less than the amount received while undergoing most standard radiologic procedures.[4] However, the isotope is concentrated in the urine, so that exposure of the urinary collecting system may be greater.[123] To alleviate this potential problem, patients are advised to maintain a high fluid intake and urine volume after the procedure. There are no long-term follow-up studies to assess the risk of this exposure of the collecting system to radiation. In theory, the use of radioisotopes in children and pregnant women may carry an increased risk of potential problems.
In an effort to avoid using radiolabeled compounds, techniques have been developed to measure low levels of iodine in urine and plasma. These techniques permit the use of unlabeled radiocontrast agents, which are inherently rich in iodine, to measure GFR. Radiocontrast agents are of LMW (600–1600 Da), are not protein bound, and are eliminated from plasma mainly by glomerular filtration. The HPLC assay has been used to measure renal clearance of iothalamate sodium (Conray), diatrizoate meglumine (Hypaque), and iohexol (Omnipaque). The sensitivity of the assay allows the use of as little as 1 mL of radiocontrast agent, which can be injected subcutaneously. However, the main disadvantage of HPLC is the expense, time, and labor needed to carry out the assay. A rapid and convenient method has been developed to measure relatively low concentrations of iodine with the use of x-ray fluorescence, and the method has been applied to the measurement of the plasma clearance of iohexol. [132] [133]
The use of iohexol (molecular weight 821 Da) to measure GFR has grown in popularity, probably because of the low incidence of adverse effects, which is attributable to iohexol's low osmolality and nonionic properties. Plasma clearance determinations using iohexol appear to be comparable with those obtained with the use of other radionuclide-labeled markers and with inulin. [134] [135] Up to 30 mL of iohexol may be required if samples are measured by x-ray fluorescence, but the amount administered is reduced in patients with decreased kidney function. As little as 5 mL may be needed if more sensitive techniques are used (e.g., HPLC). The technique appears to be safe, an observation that is not surprising because, even in very high-risk diabetic patients with markedly reduced kidney function, nephrotoxicity from radiocontrast agents occurred only at doses above those generally used to measure kidney function.[136]
The incidence of extrarenal adverse reactions from higher doses of nonionic radiocontrast agents used in radiographic procedures is low. All of the methods that use labeled or unlabeled radiocontrast agents share the risk of allergic reactions. Although this risk is small, none of these agents should be administered to patients who are allergic to iodine. Higher doses of iohexol can also be used when GFR is measured in conjunction with standard urography.[137]Extremely low levels of GFR can be measured, and the technique has been adapted to determining residual renal function in patients on maintenance hemodialysis.[138]
Normalizing Glomerular Filtration Rate
The measurement of GFR is usually better suited for monitoring disease progression than for detection or diagnosis, for two reasons. The first is the cost and inconvenience of the procedure. Second, the enormous physiologic variability of GFR in healthy individuals makes it difficult to define what a normal GFR should be for an individual patient.[4] An understanding of the factors that contribute to this normal variability is essential in interpreting any test of GFR.
A number of investigators have attempted to normalize GFR in populations of humans who have no known kidney disease. For years, body surface area (BSA) has been used to normalize GFR.[4] Usually, GFR is indexed to BSA; that is, GFR is expressed per unit of BSA. However, at least one report suggested that a regression relationship is more accurate than indexing for normalizing GFR to BSA.[139] The rationale has been that the weight of the kidney and the basal metabolic rate are proportional to BSA in normal individuals of different age and body size.[4] Generally, the DuBois formula for calculating BSA using power functions of height and weight has been used to estimate BSA.[4] This formula is less accurate at extremes of age. Obesity may also perturb the otherwise physiologic relationship between BSA and renal hemodynamic function.[140]
The argument has been made that extracellular fluid volume be used to normalize GFR, [141] [142] because the purpose of the kidney is to maintain the composition of the extracellular fluid. A comparison of extracellular volume and calculated BSA in normalizing GFR found that the two methods yielded very similar results.[143] Like extracellular fluid volume, blood volume is also closely correlated to calculated BSA in adult men and women.[4] In addition, both kidney and glomerular size correlate to BSA.[144] Thus, to the extent that GFR may be expected to correlate to kidney and glomerular size, the use of BSA to normalize GFR seems to be sound.
Blood volume, extracellular fluid volume, and basal metabolic rate can be more accurately predicted with the use of indices of lean body mass than calculated BSA alone. Thus, measures of lean body mass could theoretically be better predictors of normal GFR, at least in adults. However, until this is clearly demonstrated to be the case, the more convenient calculated BSA will, no doubt, continue to be the standard for normalizing GFR.[4]
Although the variability of GFR measurements in normal individuals can be reduced by taking BSA differences into account, the residual variability is substantial. A number of factors may contribute to this variability. GFR normally declines with age, but does so to a variable extent.[4] It is well known that dietary protein intake can affect GFR.[145] Similarly, salt intake, water consumption, posture, and normal diurnal variation can all affect GFR determinations in normal individuals.[4] In women, the menstrual cycle can affect GFR and may be an additional source of physiologic variability.[146]
The concept of “renal functional reserve” was introduced in studies that demonstrated higher GFR after an oral protein load.[147] This development led to an unfortunate confusion between increased function due to structural changes after a reduction in kidney mass and acute increases in GFR of a functional nature (e.g., after an oral protein load).[147] In theory, the normal intraindividual physiologic variability in GFR could be reduced if the measurement were made after an acute maneuver that maximized kidney function. However, there are inadequate data to determine whether this is the case. Moreover, such maneuvers substantially increase the complexity and expense of the measurement.
Applications
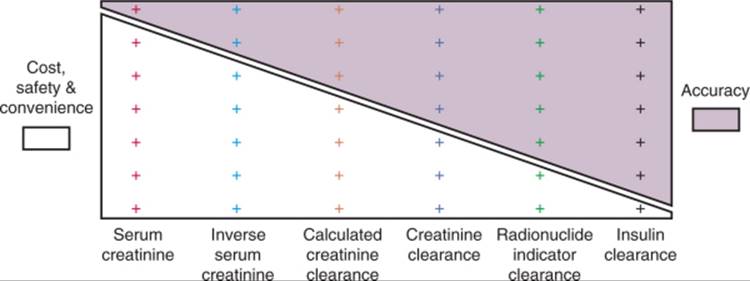
A number of factors should be considered in selecting a clinical test to measure GFR. Unfortunately, the necessary information on accuracy, precision, and expected prevalence of abnormal results is usually not available for each test in each specific clinical situation. However, recognition of how these factors affect the utility of a test, along with crude estimations of these critical parameters, can provide guidance in test selection. Finally, the usefulness of a test to measure GFR is dictated not only by issues of accuracy and precision but also by cost, safety, and convenience. In general, the tests that are most accurate and precise are also those that are most costly and inconvenient ( Fig. 23-3 ).
|
|
|
|
|
|
|
FIGURE 23-3 Conflict between practicality (cost, safety, and convenience) and accuracy of methods to estimate GFR. On one end of the spectrum, serum creatinine is most practical but least accurate. On the other end of the spectrum, inulin clearance is most accurate but least practical. |
|
No single test of GFR is ideally suited for every clinical and research application. Rather, the goal should be to select the most accurate and precise test to answer the question being addressed in the safest, most cost-effective, and convenient manner possible in the population being studied. In clinical practice, tests of GFR are most commonly used for (1) screening for the presence of kidney disease, (2) measuring disease progression to determine prognosis and effects of therapy, (3) confirming the need for treatment of end-stage renal disease with dialysis or transplantation, (4) estimating renal clearance of drugs to guide dosing, and (5) assessing GFR as a risk factor for cardiovascular disease. For research purposes, tests of GFR are most commonly asked to distinguish differences in the rate of change between two or more experimental groups.
Although precise data do not exist, it is probable that none of the currently available tests of renal function is very well suited for detecting early or mild kidney disease in the general population. Nevertheless, there is a legitimate need for tests to identify patients with moderate or marked declines in kidney function in high-risk situations. The cost and inconvenience of creatinine clearance and radionuclide measurements of GFR ordinarily preclude their use for these screening purposes. Therefore, serum creatinine has most often been used to screen for the presence of significant renal impairment. For example, serum creatinine is commonly used to screen for impaired renal function in order to identify patients who are at increased risk to develop radiocontrast-induced acute renal failure. Serum creatinine has been shown to be useful in this situation. [148] [149] Clearly, the number of patients who receive radiocontrast agents would preclude the use of other, more expensive and inconvenient tests for this purpose. Similarly, the high prevalence of essential hypertension in the Western world renders radionuclide determinations of GFR impractical as a first-line screening procedure for a renal cause of hypertension in low-risk individuals.
In contrast to the situation for individuals who are unlikely to have kidney disease, the use of more expensive, but more accurate measures of GFR may be warranted in patients at high risk for kidney functional impairment. For example, the prevalence of kidney dysfunction in patients with systemic lupus erythematosus (SLE) and low serum complements may be high enough to justify the use of a radionuclide determination of GFR to screen for kidney dysfunction that could suggest a need for therapy or additional diagnostic tests. Similarly, the high incidence of both acute and chronic kidney allograft rejection could make the use of relatively complex tests of kidney function cost effective.
Much effort has been devoted to defining methods for measuring progression of CKD. It has been noted that plots of inverse serum creatinine over time can often be closely fitted (by least-squares method) to a straight line. The use of inverse creatinine value has generally been found to provide fits as good as or better than plots of logarithmically transformed serum creatinine values.[4] Serial inverse creatinine values can be corrected for changes in creatinine excretion (measured less frequently than serum creatinine) to reduce error attributable to changes in muscle mass over time. [150] [151] Because changes in the rate of decline in inverse creatinine may indicate an effect of therapeutic intervention, a method developed to determine whether there is a “breakpoint” of two hinged regression lines has been applied to plots of inverse serum creatinine values. [152] [153]
Changes in kidney function estimated by plots of serial inverse serum creatinine can vary substantially from changes estimated by radionuclide-determined GFR. [154] [155] Correlation between radionuclide measurements of GFR and changes in creatinine clearance are no better and may be even worse than those for inverse creatinine. [155] [156] Because spontaneous changes in the slope of inverse creatinine are frequent, [151] [157] inverse serum creatinine plots are not reliable predictors of the time remaining to dialysis or transplantation or of changes in the rate of functional decline attributable to therapy.
Estimating renal clearance of drugs that are predominantly eliminated by glomerular filtration, in the absence of tubular secretion and reabsorption, is yet another potential application for tests of kidney function. [158] [159] In principle, the rate of drug elimination is often proportional to the GFR. However, because most drugs are either weak acids or weak bases, changes in urine pH can alter tubular handling and affect the relationship between GFR and renal elimination. Competition of drugs for the same secretory pathway can also perturb renal elimination. Nevertheless, impaired renal function is the most common way in which the kidney affects drug levels, and GFR can approximate renal excretion of many drugs. Cost, convenience, and timeliness make creatinine clearance and radionuclide determinations of GFR impractical for guiding drug dosing. Most investigators have used formulas to calculate GFR calculated from age, sex, and serum creatinine values to dose drugs that are excreted primarily by the kidney.[160] Although the accuracy of these calculated clearances has been studied with the use of other measures of kidney function as a gold standard, the ability of these formulas to predict pharmacokinetic profiles has not been determined for most therapeutic agents.
Many studies have attempted to examine changes in the rate of decline in GFR, determined by inverse creatinine plots or other techniques, to assess the effectiveness of therapeutic interventions. However, measuring changes in the rate of decline is problematic, as previously discussed. Moreover, it has also been shown that a substantial proportion of apparent amelioration in functional declines measured by inverse creatinine or radionuclide determinations of GFR can be attributed to regression to the mean.[156] Therefore, comparing the rate of change in GFR between two or more experimental groups has become the most reliable method for studying interventions designed to delay or prevent progression of CKD. [102] [161] Generally, cost and inconvenience are subordinated to the increased accuracy and precision of radionuclide measurements of GFR in a clinical trial, and these tests are routinely used in that setting. A study of 2250 patients participating in two large, randomized, controlled trials confirmed the reliability of serial determinations of the renal clearance of subcutaneously injected (125I)iothalamate.[162]
A doubling of serum creatinine has also been used as an end point in a number of clinical trials measuring progression of CKD. Using time to doubling of serum creatinine as an end point avoids the difficult-to-prove assumption that the rate of decline in kidney function is uniformly linear in all patients. It also avoids problems with premature patient dropout. Although the low cost and convenience of using time to doubling of serum creatinine makes this end point particularly attractive, it nevertheless has a number of important limitations.[163] First and foremost is the insensitivity of serum creatinine value to changes in GFR. False-positive results may also be problematic. It has been pointed out that changes in serum creatinine value would have given a positive result in the MDRD study, whereas no such benefit could be demonstrated when more accurate methods were used to measure changes in GFR.[163]Furthermore, variation in serum creatinine assays and calibration method can have an important impact on the ability to accurately predict levels of kidney function. Coresh and colleagues[55] analyzed frozen serum from both the MDRD study and the Third National Health and Nutrition Examination Survey (NHANES III) and showed substantial variation in calibration of serum creatinine among laboratories and through time. These errors in calibration became more important with progressively higher GFR values. Therefore, both research and clinical laboratories should consider calibrating serum creatinine to the MDRD study clinical laboratory,[55] although this may not be feasible.[164] Clearly, better techniques are still needed to measure the progression of CKD in clinical trials, techniques that can reduce the number of patients and duration of follow-up required to assess the effectiveness of therapies.
URINALYSIS
Historical Background
In common English usage, “urinalysis” is the chemical analysis of urine. However, analysis per se is “the identification or separation of ingredients of a substance,” and as such, urinalysis can take on a much broader meaning. Historically, inspection of the urine for diagnosis is virtually as old as medicine itself. The connection between sweet-tasting urine and diabetes was made as early as 600 bc. Hippocrates used the appearance, color, and consistency of urine to diagnose disease and predict outcomes. In the Middle Ages, prognostication from the examination of urine was raised to an art by the “Pisse Prophets.”[4]
The use of test strips dates back at least as far as the invention of litmus paper by Robert Boyle in about 1670. In 1848, Fehling described a chemical test for glucose in the urine, and in 1850, the French chemist Maumentú described a test strip for glucose. At about the same time, chemical tests for protein and blood were described. The early 1900s saw the development of primitive, multitest strips. It was not until 1956 that commercial urine tests strips resembling those used today were marketed.[4]
Overview
There are three ways to obtain a urine specimen: spontaneous voiding, ureteral catheterization, and percutaneous bladder puncture. Although the safety and utility of suprapubic needle aspiration of the bladder has been demonstrated, its use is generally reserved to situations in which urine cannot easily be obtained by other means. It may be particularly useful in infants, for example. Once a specimen is obtained, there are countless techniques for examining the urine and its contents.
This section reviews only those analytic techniques that are readily available and in common use and focuses on three broad areas: (1) chemical content, (2) protein composition, and (3) formed elements. The discussion of chemical content is limited to tests readily available through the use of reagent strips, such as specific gravity, pH, bilirubin, urobilinogen, nitrite, leukocyte esterase, glucose, and ketoacetate. More specific chemical tests (e.g., tests to diagnose metabolic disorders) are not discussed. Similarly, the measurement and interpretation of urine electrolyte composition are excluded from this section. The discussion on protein composition focuses on proteins from both tubular and glomerular sources. Formed elements include commonly encountered blood cells and casts.[4]
As with all laboratory procedures and clinical tests, the usefulness of urinalysis techniques depends not only on accuracy and precision but also on prior probabilities of the occurrence of positive results. Studies have found that routine hospital admission or preoperative urinalysis that includes both reagent strip testing and microscopic examination rarely lead to better patient outcomes and are generally not cost effective. [165] [166] [167] As a result, most investigators have concluded that routine urinalysis should be abandoned in this setting. Whether a more limited approach to routine screening that relies on reagent strip testing without microscopy is more effective remains to be determined. [168] [169]
The probability of a positive result on urinalysis is no doubt greater for patients who are already known to have proteinuria than for otherwise normal patients routinely admitted to a medical ward. Therefore, the utility of examining the urine sediment may be quite different in patients with proteinuria and routinely admitted patients. In one study, in patients who were believed to have kidney disease and, therefore, underwent biopsy, urine microscopy was highly predictive of abnormal kidney histology.[170] Data such as these have led to the suggestion that examining the urine sediment is critical in assessing the implications of proteinuria.[171] Although accurate data on the sensitivity and specificity of urinalysis techniques are not available for most clinical conditions, an awareness of how individual tests are influenced by the underlying likelihood of disease can be helpful in determining the appropriate use of urinalysis and in assessing the implications of the results.
CHEMICAL CONTENT
Color
The color of urine is determined by chemical content, concentration, and pH. Urine may be almost colorless if the output is high and the concentration is low. Cloudy urine is generally the result of phosphates (usually normal) or leukocytes and bacteria (usually abnormal). Black urine is seen in alkaptonuria.[4] Acute intermittent porphyria frequently causes dark urine. A number of exogenous chemicals and drugs can make urine green, but green urine may also be associated with Pseudomonas bacteruria and urine bile pigments. The most common cause of red urine is hemoglobin. Red urine in the absence of red blood cells in the sediment usually indicates either free hemoglobin or myoglobin. Red urine and red sediment indicates hemoglobin. In contrast, red urine and clear sediment are most often the result of myoglobin but may also be seen in some porphyrias, or the use of bladder analgesic phenazopyridine, or a variety of other medications, food dyes, or ingestions of beets in some individuals. Finally, red-orange urine due to rafampin is one of the better-known drug effects. Among endogenous sources, bile pigments are the most common cause of orange urine.[4]
Specific Gravity
The measurement of the specific gravity is usually included as part of the standard urinalysis. Specific gravity is a convenient and rapidly obtained indicator of urine osmolality. It can be measured accurately with a refractometer or a hygrometer or more crudely estimated with a dipstick. The accuracy and usefulness of the reagent strip method has been debated. [172] [173] Measurement of specific gravity by dipstick depends on the ionic strength of the urine and the fact that there is generally a linear relationship between ionic strength and osmolality in urine. The strip contains a polyionic polymer with binding sites saturated with hydrogen ions. The release of hydrogen ions when they are competitively replaced with urinary cations causes a change in the pH-sensitive indicator dye.[174] Specific gravity values measured by dipstick tend to be falsely high at urine pH less than 6 and falsely low if the pH is greater than 7.[175] The effects of albumin, glucose, and urea on osmolality are not reflected by changes in the dipstick specific gravity.[172] In newborns, specific gravity measurement with either a refractometer or a reagent strip is inaccurate.[176] [177] The specific gravity of urine reflects the relative proportion of dissolved solutes to total volume and, as such, is a measure of urine concentration. The normal range for specific gravity is 1.003 to 1.030, [174] [178] but values decrease with age as the kidney's ability to concentrate urine decreases. Specific gravity can be used to crudely estimate how the concentration of other urine constituents may reflect total excretion of those constituents[179] because specific gravity correlates inversely with 24-hour urine volume.[180] Indeed, self-monitoring of urine specific gravity may be useful for stone-forming patients, who benefit from maintaining a dilute urine.[173] Specific gravity can be affected by protein, glucose, mannitol, dextrans, diuretics, radiographic contrast media, and some antibiotics. Most clinical decisions should be based only on more accurate determinations of urine osmolality.
Urine pH
Urine pH is usually measured with a reagent test strip. Most commonly, the double indicators methyl red and bromthymol blue are used in the reagent strips to give a broad range of colors at different pH values. In conjunction with other specific urine and plasma measurements, urine pH is often invaluable in diagnosing systemic acid-base disorders. By itself, however, urine pH provides little useful diagnostic information. The normal range for urine pH is 4.5 to 7.8. A very alkaline urine (pH > 7.0) is suggestive of infection with a urea-splitting organism, such as Proteus mirabilis. Prolonged storage can lead to overgrowth of urea-splitting bacteria and a high urine pH. However, diet (vegetarian), diuretic therapy, vomiting, gastric suction, and alkali therapy can also cause a high urine pH. Low urine pH (pH < 5.0) is seen most commonly in metabolic acidosis. A higher value may indicate the presence of one of the forms of renal tubular acidosis. Acidic urine is also associated with the ingestion of large amounts of meat.[4]
Bilirubin and Urobilinogen
Only conjugated bilirubin is passed into the urine. Thus, the result of a reagent test for bilirubin is typically positive in patients with obstructive jaundice or in jaundice due to hepatocellular injury, whereas it is usually negative in patients with jaundice due to hemolysis. In patients with hemolysis, however, the urine urobilinogen result is often positive. Reagent test strips are very sensitive to bilirubin, detecting as little as 0.05 mg/dL. However, the detection of bilirubin in the urine is not very sensitive for detecting liver disease.[4] False-positive test results for urine bilirubin can occur if the urine is contaminated with stool. Prolonged storage and exposure to light can lead to false-negative results.[4]
Leukocyte Esterase and Nitrites
Dipstick screening for urinary tract infection has been recommended for high-risk individuals, but the issue is controversial. The U.S. Preventative Services Task Force has recommended screening for asymptomatic bacteruria in pregnant women at 12 to 16 weeks' gestation. The Task Force stated that there was insufficient evidence to recommend for or against the routine screening of elderly women, women with diabetes, or children who are asymptomatic (http://www.ahrq.gov/clinic/3rduspstf/asymbac/asymbacrs.htm![]() ).[181] However, the American College of Physicians and the Canadian Task Force on the Periodic Health Examination have recommended that urinalysis not be used to screen for bacteruria in asymptomatic persons. (http://www.ahrq.gov/clinic/3rduspstf/asymbac/asymbacrs.htm
).[181] However, the American College of Physicians and the Canadian Task Force on the Periodic Health Examination have recommended that urinalysis not be used to screen for bacteruria in asymptomatic persons. (http://www.ahrq.gov/clinic/3rduspstf/asymbac/asymbacrs.htm![]() ).[181] In children, routine screening for bacteruria has also been controversial. The American Academy of Pediatrics recommends screening in infancy, early childhood, late childhood, and adolescence.[182] However, on the basis of a cost-effectiveness analysis, Kaplan and co-workers[183] suggested that a single screening test at school entry would be more effective. Whether dipstick screening for bacteruria is sufficient (without microscopic examination) has also been debated.[184] Craver and co-workers[185] found that dipstick testing (with microscopic confirmation of positive results) was sufficient and cost-effective for children in an emergency department setting. In a study of 5486 urine samples, Bonnardeaux and co-workers[186] found that a negative dipstick result was probably sufficient to exclude microscopic abnormalities in the urine. Thus, it seems reasonable that a microscopic examination can be reserved for patients with an abnormal dipstick test result.
).[181] In children, routine screening for bacteruria has also been controversial. The American Academy of Pediatrics recommends screening in infancy, early childhood, late childhood, and adolescence.[182] However, on the basis of a cost-effectiveness analysis, Kaplan and co-workers[183] suggested that a single screening test at school entry would be more effective. Whether dipstick screening for bacteruria is sufficient (without microscopic examination) has also been debated.[184] Craver and co-workers[185] found that dipstick testing (with microscopic confirmation of positive results) was sufficient and cost-effective for children in an emergency department setting. In a study of 5486 urine samples, Bonnardeaux and co-workers[186] found that a negative dipstick result was probably sufficient to exclude microscopic abnormalities in the urine. Thus, it seems reasonable that a microscopic examination can be reserved for patients with an abnormal dipstick test result.
The esterase method relies on the fact that esterases are released from lysed urine granulocytes. These esterases liberate 3-hydroxy-5-phenyl pyrrole after substrate hydrolysis. The pyrrole reacts with a diazonium salt, yielding a pink to purple color.[187] The result is usually interpreted as negative, trace, small, moderate, or large. Urine that is allowed to stand indefinitely results in a greater lysis of leukocytes and a more intense reaction. False-positive results can occur with vaginal contamination. High levels of glucose, albumin, ascorbic acid, tetracycline, cephalezin, cephalothin, or large amounts of oxalic acid may inhibit the reaction.[188]
Urinary bacteria convert nitrates to nitrites. In the reagent strip test, nitrite reacts with an p-arsanilic acid to form a diazonium compound; further reaction with 1,2,3,4-tetrahydrobenzo(h)quinolin-3-ol, results in a pink color end point.[187] [189] Results are usually interpreted as positive or negative. High specific gravity and ascorbic acid may interfere with the test. False-positive results are common and may be due to low urine nitrates resulting from low diet intake. It may take up to 4 hours to convert nitrate to nitrite, so inadequate bladder retention time can also give false-negative results.[189] Prolonged storage of the sample can lead to degradation of nitrites, another source of false-negative results. Finally, several potential urinary pathogens such as Streptococcus faecalis, other gram-positive organisms, Neisseria gonorrhea, and Mycobacterium tuberculosis do not convert nitrate to nitrite.[189]
Studies have examined the sensitivity and specificity of reagent strip tests for urinary tract infection in different clinical settings and patient populations, including patients attending general medicine clinic,[190] patients visiting an emergency department because of abdominal pain,[191] in children with neurogenic bladders,[192] in children attending a general medical outpatient clinic,[193] in men being screened for sexually transmitted disease,[194] and in women.[195] A meta-analysis of the results of 51 relevant studies compared the use of nitrite alone, leukocyte esterase alone, disjunctive pairing (either test result positive), and conjunctive pairing (both test result positive).[196] The ROC curves were fitted to the data using logistic transformations and weighted linear regression. This analysis indicated that the disjunctive pairing of both tests is the most accurate approach to screening for infection. However, when the likelihood of infection is high (e.g., when signs and symptoms are present), negative results of both tests are still inadequate to exclude infection. These tests, in combination with other clinical information, may be more useful in situations in which the likelihood of infection is low.
Glucose
Reagent strip measurement of urine glucose level, once used to monitor diabetic therapy, has been almost completely replaced by more reliable methods that measure finger-stick blood glucose level. Urine glucose is less accurately quantitated than blood glucose and is dependent on urine volume. In addition, the appearance of glucose in the urine always occurs later than blood glucose elevations. Thus, the value of the reagent strip glucose is limited almost entirely to screening.
Most reagent strips use a glucose oxidase/peroxidase method, which generally detects levels of glucose as low as 50 mg/dL.[197] Because the renal threshold for glucose is generally 160 to 180 mg/dL, the presence of detectable urine glucose indicates blood glucose in excess of 210 mg/dL. Large quantities of ketones, ascorbate, and pyridium metabolites may interfere with the color reaction, [197] [198] and urine peroxide contamination may cause false-positive results. Nevertheless, the appearance of glucose in the urine is a specific indicator of high serum glucose levels. Glucosuria due to a low renal threshold for glucose reabsorption is rare. As a screening test for diabetes, fasting urine glucose testing has a specificity of 98% but a sensitivity of only 17%.[199]
Ketones
Ketones (acetoacetate and acetone) are generally detected with the nitroprusside reaction.[200] Ascorbic acid and phenazopyridine can give false-positive reactions. Beta-hydroxybutyrate (often 80% of total serum ketones in ketosis) is not normally detected by the nitroprusside reaction. Ketones may appear in the urine, but not in serum, with prolonged fasting or starvation. Ketones may also be measured in the urine in alcoholic or diabetic ketoacidosis.
Hemoglobin and Myoglobin
Reagent strips utilize the peroxidase-like activity of hemoglobin to catalyze the reaction of cumene hydroperoxide and 3,3′,5,5′-tetramethylbenzidine. Hematuria, or contamination of the urine with menstrual blood, produces a positive reaction. Oxidizing contaminants and povidone iodine will cause false-positive reactions.[197] Myoglobin will also react positively.
Free hemoglobin is filtered at the renal glomerulus and, thus, will appear in the urine when the capacity for plasma protein binding with haptoglobin is exceeded. Some of the hemoglobin is catabolized by the proximal tubules. The principle cause of increased serum and urine free hemoglobin is hemolysis. Conversely, rhabdomyolysis gives rise to myoglobin. A positive dipstick test for hemoglobin in the absence of red blood cells in the urine sediment may suggest either hemolysis or rhabdomyolysis. Often, the clinical history provides important differential diagnostic information. Hemolysis can usually be diagnosed by examining the peripheral blood smear and measuring levels of lactate dehydrogenase, haptoglobin, and serum free hemoglobin. Rhabdomyolysis is accompanied by increased levels of serum creatine phosphokinase. In the end, specific assays for hemoglobin and myoglobin can be used to measure urine levels.
Protein
Normal Physiology
Normally, large quantities of large high-molecular-weight (HMW) plasma proteins traverse the glomerular capillaries, mesangium, or both without entering the urinary space. Both charge- and size-selective properties of the capillary wall prevent all but a tiny fraction of albumin, globulin, and other large plasma proteins from crossing. Smaller proteins (<20,000 Da) pass readily across the capillary wall. However, because the plasma concentration of these proteins is much lower than that of albumin and globulins, the filtered load is small. Moreover, LMW proteins are normally reabsorbed by the proximal tubule. Thus, proteins such as α2-microglobulin, apoproteins, enzymes, and peptide hormones are normally excreted in only very small amounts in the urine.[4] Most healthy individuals excrete between 30 and 130 mg/day of protein, and the upper limit of normal total urine protein excretion is generally given as 150 to 200 mg/day for adults.[201] The upper limit of normal albumin excretion is usually given as 30 mg/day.[201]
A very small amount of protein that normally appears in the urine is the result of normal tubular secretion. Tamm-Horsfall protein is an HMW glycoprotein (23 × 106 Da) that is formed on the epithelial surface of the thick ascending limb of the loop of Henle and early distal convoluted tubule.[4] Tamm-Horsfall protein, also known as uromodulin, binds and inactivates the cytokines interleukin-1 and tumor necrosis factor. [202] [203] Immunoglobulin A (IgA) and urokinase are also secreted by the renal tubule and appear in the urine in small amounts.[4]
From a consideration of normal physiology, it is apparent that abnormal amounts of protein may appear in the urine as the result of three mechanisms. First, a disruption of the capillary wall barrier may lead to a large amount of HMW plasma proteins that overwhelm the limited capacity of tubular reabsorption and cause protein to appear in the urine. The resulting proteinuria can be classified as glomerular in origin. Second, tubular damage or dysfunction can inhibit the normal resorptive capacity of the proximal tubule, resulting in increased amounts of mostly LMW proteins to appear in the urine. Such proteinuria can be classified as tubular proteinuria. Third, increased production of normal or abnormal plasma proteins can be filtered at the glomerulus and overwhelms the resorptive capacity of the proximal tubule. These filtered proteins can be especially numerous if their size is small or positively charged. Although increased urine protein excretion can also result from increased tubular production of protein, this is rarely the case.
Techniques to Measure Urine Protein
Protein can be measured in random samples, in timed or untimed overnight samples, or in 24-hour collections. Inaccurate urine collection is probably the greatest source of error in quantifying protein excretion in timed collections, particularly 24-hour collections. However, urine creatinine can be measured to judge the adequacy of the 24-hour collection. If creatinine excretion is similar to that in previous 24-hour samples, then the collection is likely to be reasonably accurate. If no other collections are available for comparison, then the adequacy of collection can be judged from the expected normal range of creatinine excretion. For hospitalized men ages 20 to 50 years, this range was found to be 18.5 to 25.0 mg/kg body weight/day, and for women of the same age, 16.5 to 22.4 mg/kg/day ( Fig. 23-4 ). These values declined with age, so that for men ages 50 to 70 years, creatinine excretion was 15.7 to 20.2 mg/kg/day, and for women, 11.8 to 16.1 mg/kg/day (see Fig. 23-4 ). Patients who are malnourished or who may have reduced muscle mass for other reasons can be expected to have lower than normal creatinine excretion rates.[4]
|
|
|
|
|
|
|
FIGURE 23-4 Age-related differences in urine creatinine excretion in normal men (left panels) and normal women (right panels). Shaded areas represent 95% confidence intervals calculated from the data of Kampmann J, Siersbæk-Nielson K, Kristensen M, Mølholm-Hansen J: Rapid evaluation of creatinine clearance. Acta Med Scand 196:517–520, 1974. Values in the upper panels are in mg/day and values in the lower panels are in mg/kg of body weight/day. |
|
Tests to accurately quantitate total protein concentration in urine rely on precipitation. In the commonly used sulfosalicylic acid method, sulfosalicylic acid is added to a sample of urine, and the turbidity is measured with a photometer or a nephelometer. Protein is quantified through comparison of the turbidity of the sample with that of a standard. This method lacks precision, and the coefficient of variation is as high as 20%. A number of proteins are detected with this method, including γ-globulin light chains and albumin. The method is more sensitive to albumin than to globulins. Trichloroacetic acid can be used in place of sulfosalicylic acid to increase the sensitivity to γ-globulin. False-positive reactions may occur from high levels of tolmetin sodium (Tolectin), tolbutamide, antibiotics, and radiocontrast agents. Total protein can more accurately be quantified with the use of several monospecific antibodies to different types of urine protein, but this method is somewhat cumbersome and is seldom used in clinical laboratories.[4]
Total protein concentration in urine can be estimated with chemically impregnated plastic strips. Most dipstick reagents contain a pH-sensitive colorimetric indicator that changes color when negatively charged proteins bind to it. However, positively charged proteins are less readily detected. Positively charged immunoglobulin light chains, for example, may escape urine dipstick detection even when present in large amounts in the urine. A very high urine pH (>7.0) can also give false-positive results, as can contamination of the urine with blood. The dipstick technique is sensitive to very small urine protein concentrations (the lower limit of detection is 10-20 mg/dL). However, at these low levels, the major constituent of urine protein may be Tamm-Horsfall protein, and thus, a positive test result may not reflect kidney injury. This is especially likely to occur when the urine volume is low and the concentration is high. When urine volume is high and the urine is maximally dilute, however, a relatively large amount of protein can go undetected. Indeed, total protein excretion approaching 1 g/day may not be detected if urine output is high. If, for example, urine volume is 10 L/day, then the concentration of 1 g of protein would be 10 mg/dL, or below the limit of detection for most reagent strip tests of total protein.[4]
The consistency of results with the same sample assessed repeatedly or the precision of reagent strip tests of urine total protein concentration is generally poor.[204] Variability in interpretation both by the same technologist and among technologists has been examined and has been found to be relatively high. For example, at low levels of urine protein concentration (e.g., 6–39 mg/dL), inconsistent results between different technologists were seen in 19% to 56% of the determinations. At higher concentrations (e.g., 196–328 mg/dL), inconsistencies were seen in 19% to 44%.[4] Similar findings were reported in a later study that also found that inconsistencies depended somewhat on the experience of the operator and the type of reagent strip. Inconsistencies were found among experienced technologists in up to 33% of cases and among inexperienced technologists in up to 93% of cases.[204]
The sensitivity and specificity of reagent strip protein tests have also been assessed using more accurate quantitative determinations as gold standards. Interestingly, the sensitivity of these tests appears to be higher when assessed through the use of samples prepared by adding albumin and globulin to normal, protein-free urine than when assessed using actual patient specimens.[204] This difference likely reflects the inability of reagent strips to react to many of the heterogeneous proteins found in human urine. When 20 to 25 mg/dL is used as the limit of detection in clinical specimens, the sensitivity of reagent strips has been found to be only 32% to 46%, and the specificity was 97% to 100%.[204] The effect of the sensitivity and specificity on the utility of these reagent strip tests also, of course, depends on the prevalence of proteinuria in the population being screened. In a population with a low prevalence of disease, the low sensitivity of the reagent strip tests suggests that the majority of individuals with proteinuria would be missed. [4] [204]
Urine albumin concentrations can be quantified by a number of assays including
|
|
1. |
Radioimmunoassay can be carried out using a double-antibody technique. Albumin in a urine sample competes with a known amount of radiolabeled albumin for fixed binding sites of antibodies. Free albumin can be separated from bound albumin by immunoabsorption of the (albumin-bound) antibody. Albumin concentration in the sample is inversely proportional to the radioactivity.[205] |
|
|
2. |
The immunoturbimetric technique depends on the turbidity of a solution when albumin in a sample of urine reacts with a specific antibody. The turbidity is measured with a spectrophotometer, and the absorbency is proportional to the albumin concentration.[206] |
|
|
3. |
When albumin in the urine sample reacts with a specific antibody, it forms light-scattering antigen-antibody complexes that can be measured with a laser nephelometer. The amount of albumin is proportional to scatter in the signal.[207] |
|
|
4. |
The competitive enzyme-linked immunosorbent assay (ELISA) has also been used to measure urine albumin.[208] |
|
|
5. |
HPLC has also been used to measure urine albumin. This assay also measures the immuno-unreactive intact albumin that is not recognized by immunologic methods. However, the clinical significance of this immuno-unreactive intact albumin is not fully understood.[209] |
Although the correlation between most of these quantitative assays is very good, a good correlation only indicates a strong linear relationship. For example, the correlation coefficients (r-values) between radioimmunoassay and immunoturbidimetry and that between radioimmunoassay and nephelometry were both 0.98.[210] Intra-assay coefficients of variation for immunoturbidimetry and nephelometry, respectively, were found to be 6.6% and 11.5% at low concentrations (10–60 mg/L) and 11.1% and 4.1% at high concentrations (90–120 mg/L), respectively.[210] Interassay coefficients of variation were 11.4% and 11.5% at low concentrations (10–60 mg/L) and 5.4% and 1.4% at high concentrations (90–120 mg/L), respectively, for these two techniques.[210] However, this study had few samples in the midrange of albumin concentration (16–90 mg/L), and here there were considerable different results between the radioimmunoassay and the nephelometry assay.[210] In another study, each assay varied from one another up to threefold between radioimmunoassay, immunoturbidimetry, nephelometry, and HPLC.[211] Other studies have also found similar variations between different immunoassays.[212] In contrast, the within-run coefficient of variation for an immunoturbidometric methods was found to be 3.5% at low albumin concentrations and 2.4% at high albumin concentrations.[213] The day-to-day coefficient of variation for the same assay was 5.1% at low or high albumin concentrations.[213] Therefore, ideally the same assay should be used when comparing the albuminuria results over time for a patient. The choice of assay used to measure albuminuria is largely determined by issues of accuracy, cost, and convenience.
Reagent strip methods have recently been developed to qualitatively screen for urine albumin excretion. The Albustix (Bayer Diagnostik, Munich, Germany) reagent strip uses a protein error of indicators method that causes color changes in the presence of albumin.[214] Trace reactions indicate urine albumin concentrations between 50 and 200 mg/L. Thus, more positive reactions can be used to indicate albumin concentrations higher than those generally found in patients with microalbuminuria. In one study, the sensitivity and specificity of the Albustix was found to be only 0.81 and 0.55, respectively.[214] Thus, there was almost a 50% chance of a false-negative result with the Albustix method.
Screening methods have been developed to measure albumin concentrations low enough to detect albumin excretion rates that are abnormal, but below the level of detection with standard reagent strips (i.e., in the microalbuminuria range). [210] [215] [216] [217] [218] [219] [220] One of the most extensively investigated methods to screen for microalbuminuria is the immunometric dipstick Micral-Test (Boehringer Mannheim, Mannheim, Germany). [210] [217] The strip is made up of a series of reagent pads through which the urine sample passes sequentially. Urine is first drawn into a wick fleece and then passes into a buffer fleece that adjusts the sample pH. Next, it passes into a third pad, in which albumin in the sample is bound by a soluble conjugate of antibodies linked to the enzyme β-galactosidase. Excess antibody is then adsorbed on immobilized albumin in the next pad, so that only albumin bound to antibody and enzyme reaches the color pad. There the β-galactosidase reacts with a chemical substrate to produce a red dye, the intensity of which is proportional to the bound albumin concentration. The test strip must be read at precisely 5 minutes. [210] [217]
Another qualitative test that has been examined in several investigations is the Micro-Bumintest (Ames, Miles, Elkhart, IN). This test uses a reagent tablet containing the indicator dye bromphenol blue. The intensity of the bluish-green color produced after a drop of urine is placed on the surface of the tablet is proportional to the concentration of albumin.[210] A latex agglutination method, Albusure (Cambridge Life Sciences, Cambridge, UK), binds albumin in the urine sample to latex.[214] Agglutination occurs when mixed with sheep antihuman antibody. When urine albumin concentrations are greater than 20 mg/L, agglutination is inhibited (antigen excess). Thus, agglutination indicates urine albumin concentration of less than 20 mg/L.
A number of studies have examined the sensitivity and specificity of screening methods designed to detect very low levels of albumin in urine. [210] [215] [216] [217] [218] [219] [220] Because these tests are only semiquantitative (i.e., nonparametric), a true coefficient of variation cannot be determined. Nevertheless, in one evaluation of the Micral-Test method, an estimated coefficient of variation of the same sample interpreted by different technicians was 12.4%.[219] Experience in reading the Micral-Test was shown to be important.[218] Observer concordance for the Micro-Bumintest was found to be 95% in one study.[215] A new version of the Micral-Test, Micral-Test II, has been described[221]; it is designed to react faster, to be less dependent on timing, and to allow a better color comparison to reduce observer variance. Indeed, in one study, the interobserver concordance was 93% with the Micral-Test II.[221]
Several studies have examined the sensitivity and specificity of the newer reagent strips that measure very low concentrations of urine albumin. Most of these investigations studied patients with diabetes, and most examined the Micral-Test, [210] [216] [217] [218] [222] the Micro-Bumintest, [210] [215] or both. In general, these albumin reagent strip tests are more sensitive than standard dipsticks, but they also have a relatively high rate of false-positive results. Moreover, it should be remembered that, for the most part, these reagent strips were tested in populations of diabetic patients with a high prior probability of a positive result. The number of false-positive results would be expected to be much higher in populations in which the prevalence of albuminuria was lower. Because these strips may be in error owing to variation in urinary concentration, these should only be used to approximate urinary protein if the ability to directly measure protein is not available. [223] [224]
All of the qualitative or semiquantitative urine protein and albumin screening tests discussed so far measure only total protein, or albumin concentration. The sensitivity and specificity of these tests can be markedly influenced by fluid intake, the state of diuresis, and the resulting urine concentration. Indeed, in one study, albumin concentration had a low discriminant value for detecting increased albumin excretion in a 12-hour timed urine sample ( Fig. 23-5 ). In an effort to correct for problems arising out of variability in urine volume and concentration, many investigators have used the protein-to-creatinine or albumin-to-creatinine ratio in random, or timed urine collections. There is a high degree of correlation between 24-hour urine protein excretion and protein-to-creatinine ratios in random, single-voided urine samples in patients with a variety of kidney diseases.[225] It has been suggested that a protein-to-creatinine ratio of greater than 3.0 or 3.5 mg/mg or less than 0.2 mg/mg indicates protein excretion rates of greater than 3.0 or 3.5 g/24 hr or less than 0.2 g/24 hr, respectively.[225] However, few studies have systematically examined the sensitivity and specificity or defined optimal levels of detection for protein-to-creatinine ratios in large numbers of patients in different clinical settings.
|
|
|
|
|
|
|
FIGURE 23-5 Comparison of false-positive and false-negative rates when urine albumin concentration was used to predict 12-hour (overnight) excretion greater than 15 mg/min in diabetics. At a concentration cutoff greater than 10 mg/L, the false-positive rate is high. At a concentration cutoff greater than 20 mg/L, the false-positive rate is reduced, but the false-negative rate is high. (Data from Kouri TT, Viikari JSA, Mattila KS, Irjala KMA: Invalidity of simple concentration-based screening tests for early nephropathy due to urinary volumes of diabetic patients. Diabetes Care 14:591–593, 1991.) |
|
Much of the data on the usefulness of albumin-to-creatinine ratios has been derived from studies of patients with type 1 or type 2 diabetes. [226] [227] [228] [229] In most of these investigations, the sensitivity and specificity of albumin-to-creatinine ratios were determined using albumin excretion rates from timed urine collections as a standard. Data from several studies were combined to examine the true- and false-positive rates for albumin-to-creatinine ratios to detect albuminuria in overnight urine.[4] Independent of the albumin-to-creatinine ratio cutoff used, the sensitivities and specificities appeared to be reasonable.[4] Altogether, these data suggest that albumin-to-creatinine ratios may be useful as a screening test for kidney disease in populations in which the expected prevalence of disease is high (e.g., diabetic persons). Less clear is their potential usefulness in other patient populations in which the prior likelihood of disease may be lower than in patients with diabetes.[230] A cross-sectional study by Ruggenenti and co-workers[231] found that morning protein-to-creatinine ratios among 177 nondiabetic outpatients with CKD were predictive of declining kidney function. In kidney transplant recipients, protein-to-creatinine ratios have been shown to significantly correlate with measurements of 24-hour urine protein and appear useful as both screening devices and longitudinal tests for following the level of proteinuria.[232] Use of the protein-to- creatinine ratio has also proved reliable in detecting significant proteinuria in pregnant women, [233] [234] but the threshold for identifying pregnant women with significant proteinuria is controversial. [235] [236] [237]
Although protein-to-creatinine or albumin-to-creatinine ratios may be more quantitative than a simple dipstick screening procedure, their use has a number of limitations. For example, obtaining protein-to-creatinine or albumin-to-creatinine ratios on morning, first-void samples may underestimate 24-hour protein excretion because of the reduction in proteinuria that normally occurs at night.[238] Storage time and temperature may also affect albumin levels in urine,[239] and specimens should be analyzed as soon as possible after collection. The fact that urine creatinine must be measured in addition to albumin introduces another source of error. Indeed, the combination of the errors of two measurements is greater than the error of either one alone (the coefficient of variation is the square root of the sum of the two coefficients of variations, each squared). Urine creatinine concentration is extremely variable, so that very different ratios can be obtained in individuals with similar protein excretion rates. Moreover, a number of variables that may interfere with creatinine determinations may affect the ratios.[240] Despite these limitations, the urine protein-to-creatinine or albumin-to-creatinine ratio may be useful, especially in individuals in whom urine collection is difficult or impossible. Given the day-to-day variability in albumin excretion and the potential limitations of albumin to creatinine ratio, the American Diabetic Association recommends that at least two or three samples in a 3- to 6-month period should show elevated levels before a patient is deemed to have microalbuminuria.[223]
A number of analytic tools have been developed to separate and identify individual urinary proteins.[241] These techniques include agarose gel electrophoresis, column gel chromatography, polyacrylamide gel electrophoresis, immunoelectrophoresis, and isoelectric focusing. Proteomic techniques employing mass spectrometry and peptide mass fingerprinting have expanded the number of identified urinary proteins. [242] [243] However, these latter techniques are generally designed to identify, but not accurately quantitate, urine proteins. Some have been used in clinical laboratories to determine the selectivity of urine protein or to identify monoclonal immunoglobulin heavy and light chains. Otherwise, they have been largely confined to research applications.
Applications of Urine Protein Measurement
Screening for Kidney Disease
Although urine protein measurement can be used to assist in the diagnosis of kidney disease and to assess progression and response to therapy (discussed later), it is most commonly used as a screening test. Because screening tests are generally applied to relatively large numbers of patients, convenience and cost are major considerations. To make screening more convenient, a number of methods have been developed to measure urine protein in a single-voided, or “spot,” urine sample, so that timed urine collections can be avoided.
In 1982, Viberti and co-workers[244] reported that clinical (Albustix-positive) proteinuria subsequently developed in patients with insulin-dependent diabetes in whom albumin excretion rates of 30 to 140 mg/min were measured by radioimmunoassay in timed overnight urine collections. In contrast, patients with less than 30 mg/min did not develop overt proteinuria.[244] Viberti and co-workers[244] coined the term “microalbuminuria” to indicate increased urine albumin excretion rates in patients with normal urine total protein. A more recent follow-up of the original cohort confirmed that the patients with microalbuminuria not only had a higher risk of developing overt proteinuria but also had a greater risk of dying from cardiovascular disease.[245] Similar findings have been reported by others in patients with insulin-dependent and non-insulin-dependent diabetes. [246] [247] [248] [249] Some investigators have used 15 to 150 mg/min to define microalbuminuria,[248] whereas others have used 20 to 200 mg/min. [249] [250] Microalbuminuria has also been defined as urine albumin excretion of 30 to 300 mg/day.[201] Microalbuminuria has also been defined as a urine albumin-to-creatinine ratio of above 30 mg/g (or 0.03 mg/g) in an untimed urine sample but may vary by race and gender. Thus, others have defined microalbuminuria as 20 to 200 mg/g and 30 to 400 mg/g for males and females, respectively.[251] Whatever definition is used, microalbuminuria appears to be an important risk factor for end-organ damage in patients with diabetes. Similarly, in patients with essential hypertension, increased urine albumin excretion ratio (>30 mg/24 hr) is associated with increased cardiovascular mortality.
Most studies showing a relationship between microalbuminuria and end-organ damage have used quantitative techniques to measure urine albumin excretion. Although few studies have examined whether other screening techniques predict outcome, there is no reason to believe that the results cannot be extrapolated to other screening tests, taking differences in sensitivity and specificity into account. Indeed, albumin-to-creatinine ratios have been shown to predict the subsequent development of overt kidney disease. In a population of diabetic southwestern Native Americans, albumin-creatinine ratios of 0.03 to 0.30 mg/mg (microalbuminuria range) were a strong predictor of diabetic nephropathy.[252]
The recognition that microalbuminuria identifies diabetic patients at risk for subsequent renal and cardiovascular disease complications has given great impetus to developing effective screening tools. Borch-Johnsen and associates,[250] using published data, carried out a critical appraisal of screening for microalbuminuria in patients with diabetes. Making a number of assumptions, they performed a cost-benefit analysis of the impact of screening and antihypertensive treatment and concluded that screening and intervention programs are likely to lead to considerable reductions in cost and mortality.[250] Even though microalbuminuria has been recommended as a routine test to screen for early diabetic nephropathy, it is important to realize that there are some patients with either type 1 or type 2 diabetes who have decreased GFR due to diabetic nephropathy in the absence of microalbuminuria. [253] [254]
The use of dipstick tests for total protein excretion and microalbuminuria to screen for renal disease has not been rigorously examined in nondiabetic patient populations. Epidemiologic data suggest that even in nondiabetics, proteinuria is a risk factor for cardiovascular disease,[2] perhaps because proteinuria is a sensitive indicator of kidney damage. However strong these correlations are statistically (low P-value), the amount of unexplained variability (low r-value) is great, suggesting that the sensitivity and specificity for proteinuria detection of kidney injury in the general population could be too low to make this a useful screening tool in an individual patient. Nevertheless, data to assess this are generally not available for individuals who are not diabetic. A cost-effectiveness analysis compared a strategy of annual screening with no screening for proteinuria at age 50 years followed by treatment with an angiotensin-converting enzyme inhibitor or an angiotensin II receptor blocker and found that annual screening was not cost-effective unless selectively directed toward high-risk groups of patients older than 60 years and patients with hypertension.[255] Regardless of whether or not measuring urine protein excretion in the general population is a cost-effective approach to the early detection of kidney disease, such screening may be useful when combined with other clinical parameters in estimating vascular disease risk. However, the prospective data needed to assess the utility of this application of urine protein excretion are also incomplete.
The appropriate manner in which to use various tests to screen for renal disease has not been extensively investigated. Because the number of false-positive results on dipstick tests for protein excretion is high, a positive test should probably be followed by tests designed to more accurately quantitate urine protein excretion. However, in some clinical circumstances, the likelihood that a positive dipstick test for urine protein excretion indicates CKD is so low that the screening test should be repeated at a later date before more costly quantitation procedures are undertaken. A positive dipstick test result for protein in a patient with a urinary tract infection, for example, could be dismissed if subsequent post-treatment tests are negative. Fever can cause tubular and glomerular proteinuria that most often disappears when the fever resolves. Congestive heart failure and seizures can also cause transient proteinuria. Light or strenuous exercise is often associated with urine protein excretion that resolves spontaneously.[4]
It seems clear that, even in the absence of identifiable causes of transient proteinuria, some individuals have increases in urine protein excretion that are not associated with kidney disease.[256] This proteinuria can be classified in two categories, intermittent or persistent and postural. Several dipstick measurements of urine protein over time can be made to determine whether an individual patient fits in either of these two distinct patterns. Intermittent proteinuria is less well characterized than postural proteinuria, but it appears to be relatively benign in otherwise normal individuals. It has been shown, for example, that mortality after more than 40 years of follow-up of college students with intermittently positive urine protein screens was no different than that of normal individuals. However, few histologic studies including sufficiently large numbers of patients have been carried out to precisely characterize intermittent proteinuria.[4]
Posture can cause an increase in urine protein excretion in otherwise normal individuals.[256] This postural proteinuria should be distinguished from the increase in proteinuria seen in patients with kidney disease who assume an upright posture. Postural proteinuria usually does not exceed 1 g/24 hr. It is usually diagnosed by detecting protein excretion during the day that is absent at night while the patient is recumbent. Kidney histology in patients with postural proteinuria is generally normal or nonspecific. [257] [258] Patients with postural proteinuria have been shown to have an excellent long-term prognosis.[259] Indeed, six patients diagnosed by Thomas Addis had no evidence of kidney disease after 42 to 50 years of follow-up.[260] Even in individuals without postural proteinuria or renal disease, levels of urine protein excretion are lower at night than during the day.[261] Thus, the timing of urine collection is likely to influence the sensitivity and specificity of screening tests for urine protein excretion.
Diagnosis and Prognosis
Once proteinuria has been detected by screening, the clinician must not only confirm the results of screening but also precisely quantitate the amount of protein excretion in a timed urine collection. Quantifying urine protein excretion may help to distinguish glomerular from tubular proteinuria. If, for example, a patient's protein excretion is in the nephrotic range (e.g., >3 g/24 hr), a glomerular source is almost certain. Quantitation of urine protein excretion can also provide useful prognostic information and assist in monitoring the response to therapy.
After detection and quantification, determining the composition of urine protein may provide diagnostic information. Higher amounts of albumin and HMW proteins suggest glomerular proteinuria, whereas isolated increases in LMW protein fractions are more suggestive of tubular proteinuria. It is unusual for tubular proteinuria to exceed 1 to 2 g/day, and only a small fraction of protein excretion due to tubular damage should be albumin. Tubular proteins are heterogeneous; however, α2-microglobulin is often a major constituent.
β2-Microglobulin is an LMW (11.8-kDa) protein that has been identified as the light chain of class I major histocompatibility antigens (e.g., human leukocyte antigens [HLAs] A, B, and C).[262] β2-Microglobulin is most commonly measured in urine using radioimmunoassay or ELISA. It is freely filtered at the glomerulus and is avidly taken up and catabolized by the proximal tubule. Not surprisingly, therefore, detectable urinary levels of β2-microglobulin have been associated with many pathologic conditions involving the proximal tubule, including aminoglycoside, Balkan endemic nephropathy, heavy metal nephropathies, radiocontrast nephropathy, and kidney transplant rejection. [263] [264] [265] [266] [267] [268] β2-Microglobulin has also been found to be useful in distinguishing upper from lower urinary tract infection.[269] Because urine β2-microglobulin is a nonspecific marker of kidney tubular injury, it is not useful in differentiating among different causes of kidney disease. However, when the likely cause is already known, measurement of β2-microglobulin may be useful in detecting and monitoring injury. Nevertheless, the sensitivity and specificity for this test of tubular injury have generally not been established in different clinical situations in which prior probabilities of various kidney disorders may strongly influence its usefulness. Thus, the test may be useful in monitoring factory workers exposed to heavy metals in whom other causes of tubular injury could be expected to be uncommon. Conversely, measuring β2-microglobulin may be of limited value in diagnosing kidney transplant rejection, because other causes of tubular injury are common in transplant recipients.
Glomerular proteinuria can be further characterized as selective or nonselective. Patients with a clearance ratio of immunoglublin G (IgG; an HMW protein)–to-albumin that is less than 0.10 are said to have a selective glomerular proteinuria, whereas those with IgG-to-albumin clearance ratios of greater than 0.50 have a nonselective pattern. In general, selective proteinuria is more often seen in patients with minimal change disease and predicts a good response to treatment with corticosteroids.[4] The sensitivity and specificity of determining the selectivity of glomerular proteinuria have not been systematically examined in large numbers of patients with different kidney diseases. Moreover, the cost of the protein separation procedures has limited their widespread clinical use.
Plasma cell dyscrasias may produce monoclonal proteins, immunoglobulin, free light chains, and a combination of these. Light chains are filtered at the glomerulus and may appear in the urine as Bence Jones protein. The detection of urine immunoglobulin light chains can be the first clue to a number of important clinical syndromes associated with plasma cell dyscrasias that involve the kidney.[4] Unfortunately, urine immunoglobulin light chains may not be detected by reagent strip tests for protein. However, plasma cell dyscrasias may also manifest as proteinuria or albuminuria when the glomerular deposition of light chains causes disruption of the normally impermeable capillary wall.[270] The diagnosis of a plasma cell dyscrasia can be suspected when a tall, narrow band on electrophoresis suggests the presence of a monoclonal γ-globulin or immunoglobulin light chain. However, monoclonal proteins are best detected using serum and urine immunoelectrophoresis.[4]
Once patients have been screened and a diagnosis of kidney disease has been established, measuring the amount of urine protein can provide additional prognostic information and can be used to monitor the response to therapy. The amount of urine protein excretion has consistently been shown to predict subsequent disease progression in different clinical settings: for example, protein excretion correlated with progression in patients presenting with the nephrotic syndrome[271] and in patients with mild renal insufficiency of various causes.[272] Similar findings have been reported in patients with IgA nephropathy, [273] [274] [275] membranous nephropathy, [275] [276] [277] and type I membranoproliferative glomerulonephritis (GN).[275] The clinical course and effect of immunosuppressive therapy can also be monitored with sequential quantitation of urine protein excretion.[278]
Formed Elements
Urine Microscopy Methods
The examination of the urine by microscopy remains a useful qualitative and semiquantitative procedure. Efforts to more accurately quantitate formed elements in the urine have been made over the years. For example, Addis measured excretion rates of erythrocytes using timed urine collections. However, formed elements can quickly deteriorate in the urine, and timed collections are difficult for most patients to carry out with accuracy. Moreover, the excretion rate of many formed elements correlates with urine concentration, so that, often, little additional information is gained from the effort made to collect timed specimens.[4] For all of these reasons, the use of timed collections to obtain excretion rates of formed elements has not gained widespread acceptance. Quantifying the number of formed elements can still be carried out using untimed specimens and a counting chamber.
A number of conditions affect formed elements in the urine, and when possible, these conditions should be optimized. Contamination with bacteria can be minimized through careful attention to collection technique. A midstream, “clean-catch” specimen should be collected when possible; the patient should be instructed to retract foreskin and labia. A high urine concentration and a low urine pH help to preserve formed elements.[4] Thus, a first-void morning specimen, which is most likely to be acidic and concentrated, should be used whenever possible. Strenuous exercise and bladder catheterization can cause hematuria, and urine specimens collected to detect hematuria should not be obtained under these conditions. Urine should be examined as soon as possible after collection to avoid lysis of the formed elements and bacterial overgrowth. The specimen should not be refrigerated, because lowering the temperature causes the precipitation of phosphates and urates.
It is helpful to first measure the urine specific gravity and pH, so as to judge the density of formed elements according to the concentration and acidity of the specimen. Specimens from concentrated and acidic urine may be expected to have a greater density of formed elements than dilute and alkaline specimens from the same patients. Urine should be centrifuged at approximately 2000 revolutions per minute (rpm) for 5 to 10 minutes or 2500 to 3000 rpm for 3 to 5 minutes. The supernate should be carefully poured off, the pellet resuspended by gentle agitation, and a drop placed on a slide under a coverslip.
Most commonly, urine is examined under an ordinary bright-field microscope. However, polarized light can be used to identify anisotropic crystals, and phase-contrast microscopy can enhance the contrast of cell membranes. The urine should first be examined under low power (100x) to best judge the number of formed elements. These elements can then be examined in detail under high power (400x). Generally, the urine is examined unstained, but occasionally, stains can be helpful in distinguishing cell types.
Hematuria
Gross hematuria may first be detected by a change in urine color. Microscopic hematuria can be detected by dipstick methodology, microscopic examination, or both. These latter methods may be applied as diagnostic tests in patients with known kidney disease or as screening tools in normal or high-risk individuals. The sensitivity and specificity of screening tests for hematuria have not been thoroughly examined in many pertinent patient populations. Moreover, the cost-to-benefit ratio of screening is often unclear.
Who and when to screen for microscopic hematuria are controversial. The most cogent reason to screen for occult hematuria may be to facilitate the early, and potentially life-saving detection of urologic malignancies. A dipstick test in more than 10,000 adult men undergoing health screening was found to be positive in about 2.5%.[279] About one fourth of those who were investigated had cystoscopic abnormalities, including bladder neoplasms in 2 men. However, more than one third of those found to have occult hematuria in this retrospective study did not undergo further investigation. In study of over 2000 men, 4% were found to have occult hematuria, and 1 of these patients was found to have bladder carcinoma.[280] Higher detection rates have been reported by other investigators.[281] The U.S. Preventive Services Task Force no longer recommends screening for occult hematuria (www.preventiveservices.ahrq.gov![]() ).[181] The value of screening for occult hematuria in other populations is questionable,[282] and the role for occult hematuria screening to detect parenchymal kidney disease is unclear.
).[181] The value of screening for occult hematuria in other populations is questionable,[282] and the role for occult hematuria screening to detect parenchymal kidney disease is unclear.
Even when the urine is red, or when a dipstick-screening test is positive, the sediment should be examined to determine whether red cells are present. Other pigments such as free hemoglobin and myoglobin can masquerade as hematuria. In addition, red blood cells can be detected in the urine sediment when screening tests are negative. An occasional red blood cell can be seen in normal individuals, but generally only one or two cells per high power field.
The differential diagnosis of hematuria is broad but for practical purposes can be categorized as originating in the upper or lower urinary tract. Hematuria that is accompanied by red blood cell casts, marked proteinuria, or both is most likely to be glomerular in origin. In the absence of these important findings, distinguishing glomerular from postglomerular bleeding can be difficult. Red blood cells originating in glomeruli have been reported to have a distinctive dysmorphic appearance that is most readily appreciated using phase-contrast microscopy. [283] [284] [285] Automated blood cell analysis has also been used to determine the number of dysmorphic red cells in urine. [286] [287] In vitro studies suggest that pH and osmolality changes found in the distal tubule could explain the higher number of dysmorphic red blood cells in patients with glomerular disease.[288]
The clinical utility of tests to distinguish dysmorphic red cells in the urine has been examined in numerous studies. [287] [289] [290] [291] [292] [293] Most investigators concluded that detecting dysmorphic red cells reliably identified patients with glomerular disease; however, one investigator-blinded, controlled trial found unacceptable interobserver variability.[290] A number of investigators have attempted to develop automated methods to detect glomerular hematuria. [294] [295] [296] These techniques employ cell counters or more sophisticated flow cytometry methods. However, the use of automated cell size determinations in individuals with low-grade hematuria may be particularly unreliable owing to interference from cell debris.[295] A meta-analysis of 21 published studies using predetermined criteria for evaluation of dysmorphic urine red cells was carried out.[297] All studies originated in referral centers. The weighted average sensitivity and specificity for dysmorphic red cell test detection of glomerular disease were (with 95% confidence intervals): 0.88 (0.86–0.91) and 0.95 (0.93–0.97), respectively. The sensitivity and specificity for the use of abnormal (automated) red blood cell volumes to detect glomerular disease were 1.00 (0.98–1.00) and 0.87 (0.80–0.91). The investigators in this meta-analysis concluded that the negative predictive value of these tests was probably not sufficient to rule out important urologic lesions, especially in a referral setting in which the prevalence of urologic disease may be relatively high.
The differential diagnosis of hematuria is broad ( Table 23-4 ). Kidney vascular causes include arterial and venous thrombosis, ateriovenous malformations, arteriovenous fistula, and the nutcracker syndrome (compression of the left renal vein between the aorta and the superior mesenteric artery).[298] Most patients undergoing anticoagulant therapy who have hematuria can be found to have an underlying cause, especially if the hematuria is macroscopic. However, excessive anticoagulation or other coagulopathies can themselves be associated with hematuria. The source of hematuria in patients with sickle cell disease is often unclear, although occasionally, sickle cells may actually be seen in the urine.[299]
TABLE 23-4 -- Common Sources of Hematuria
|
|||||||||||||||||||||||||||
|
|||||||||||||||||||||||||||
|
|||||||||||||||||||||||||||
|
|||||||||||||||||||||||||||
|
Worldwide, the most common cause of glomerular hematuria is probably IgA nephropathy.[300] However, thin basement membrane diseases and other causes of glomerular nephritis are common as well. The differential diagnosis of glomerular hematuria is influenced by the geographic locale and the clinical setting. Thus, in Asia, IgA nephropathy is a very common cause of microscopic hematuria.[300] However, in another report, 25 to 30 of otherwise normal candidates for kidney donation who had asymptomatic microscopic hematuria were found to have hereditary nephritis.[301] Interstitial nephritis, whether allergic or infectious, is frequently associated with microscopic hematuria. Uroepithelial causes of hematuria include nephrolithiasis, acute and chronic infections, and malignancies. Malignancies are more common in patients who are male, are older, have macroscopic versus microscopic hematuria, are white rather than black, or have a history of analgesic abuse or other toxic exposure.
A reasonable approach to the patient with asymptomatic hematuria is to first perform a thorough history and physical examination ( Fig. 23-6 ). If the findings are unenlightening, important clues can sometimes be obtained by examining the urine. Red blood cell casts, significant proteinuria, or both may suggest a glomerular source for the hematuria. For the patients in whom glomerular proteinuria is likely, a kidney biopsy may give the diagnosis. If the source of proteinuria is not evident from the history, physical examination, or urinalysis, a renal ultrasound is probably a reasonable next step. In the young patient (e.g., <40 years) in whom renal ultrasonography findings are normal and who is otherwise at low risk for a uroepithelial malignancy, the next step can be 24-hour urine collection to exclude hypercalciuria and hyperuricosuria. If urinalysis tests are normal, it is reasonable to observe the patient without further evaluation. However, some patients may wish to undergo kidney biopsy to better understand the prognosis. Patients who are older than 40 years, have risk factors for uroepithelial malignancies, or both should undergo an intravenous pyelogram and, possibly, cystoscopy in addition to the renal ultrasonography.
|
|
|
|
|
|
|
FIGURE 23-6 An approach to the patient with hematuria. RBCs, red blood cells. |
|
Leukocyturia
The number of white blood cells that can normally be found in the urine is controversial. A conservative approach is to consider more than one per high-power field to be abnormal. The differential diagnosis of leukocyturia is broad. White blood cells can enter the urine from anywhere along the excretory system. The presence of other formed elements (e.g., proteinuria and casts) suggests a glomerular source. In the absence of other formed elements, the clinician must look beyond the urine sediment for additional clues to find the origin of urine leukocytes. Unlike red blood cells, there are no effective methods to identify the origin of white blood cells found in the urine. Contamination is a common cause of leukocyturia that should always be considered in the absence of other suggestive clinical findings.
Most often, leukocytes in the urine are polymorphonuclear. However, it should not be assumed that all urinary leukocytes are neutrophils. The presence of non-neutrophil white blood cells in the urine—for example, eosinophils—can sometimes be an important diagnostic clue. The association between eosinophiluria and drug-induced hypersensitivity reactions was first reported by Eisenstaedt, in 1951. Since then, a number of investigators have reported on the association between eosinophiluria and kidney disease.[4] Wright stain can be used to detect urine eosinophils, but a urine pH less than 7 inhibits Wright stain.[302] The use of Hansel stain improves the sensitivity of urinary eosinophil detection over the standard Wright stain.[303] In one retrospective investigation, the use of Hansel stain rather than Wright stain improved the sensitivity of using the presence of any urinary eosinophils for detecting acute interstitial nephritis from 25% to 63%[303]; the positive predictive value was improved from 25% to 50%.[303] However, not all patients in this study underwent renal biopsy to establish the diagnosis of interstitial nephritis, and the retrospective inclusion of only patients in whom urinary eosinophils were sought by clinicians makes interpretation of these data difficult. The true sensitivity and specificity of urinary eosinophils for detecting different clinical kidney diseases are unclear. Indeed, the list of diseases that may be associated with eosinophiluria is long and continues to grow ( Table 23-5 ). Moreover, the sensitivity and specificity of eosinophiluria in detecting kidney disease can be expected to vary with the threshold value used.[304]
TABLE 23-5 -- Diseases Associated with Eosinophiluria[4]
|
|||||||||||||||||||||||||||||||||||||||
|
From Silkensen JR, Kasiske BL: Laboratory assessment of renal disease: Clearance, urinalysis, and renal biopsy. In Brenner BM (ed): Brenner and Rector's The Kidney, 7th ed. Philadelphia, Saunders, 2004, p 1131.
Other Cells
It is difficult to identify the origin of cells that are neither leukocytes nor red blood cells without special stains. Most common are probably squamous epithelial cells. These are shed from the bladder or urethra and are rarely pathologic. Renal tubular cells may appear whenever there has been tubular damage. Transitional epithelial cells are rare but may be seen with collecting system infection or neoplasias.
Podocytes are normally absent or seen in small numbers in urine of normal individuals or those with inactive kidney disease. Although not visible utilizing a microscope, it is possible to visualize these podocytes in urine with immunofluoresence staining and after incubation with antihuman podocalyxin monoclonal antibody PHM-5 (Australian Monoclonal Development, Artarmon, New South Wales, Australia). The number of podocytes in urine or podocyturia increases with active kidney disease even before proteinuria appears and seems to improve with treatment.[305] The clinical utility of podocyturia is still being investigated and is not available in the clinical setting.
Urine Fat
In the absence of contamination, urinary lipids are almost always pathologic. Lipids are not usually seen as an isolated finding; however, their presence is rarely diagnostic. Lipids usually appear as free fat droplets or oval fat bodies. They have a distinctive appearance but are most readily seen under polarized light as doubly refractile “Maltese crosses.” The Maltese cross is indicative of cholesterol and cholesterol esters. Maltese crosses can also be seen with some crystals and with starch granules. Neutral fat can be identified with special lipid stains. Urinary lipids are most commonly associated with proteinuria and are particularly common in patients with the nephrotic syndrome; they can also occur in the absence of heavy proteinuria.[4] Urine fat can also be seen in bone marrow or fat embolization syndromes.
Casts
Casts are cylindrical bodies severalfold larger than leukocytes and red blood cells. They form in distal tubules and collecting ducts where Tamm-Horsfall glycoprotein precipitates and entraps cells present in the urinary space.[4]Dehydration and the resulting increased tubular fluid concentration favor the formation of casts. An acid urine is also conducive to cast formation. Observing casts in the urine sediment often provides helpful diagnostic information. The differential diagnosis of cast formation is aided by first considering the type of cast found. A number of different types can be readily distinguished ( Fig. 23-7 ; see also Color Plate IV).
|
|
|
|
|
|
|
FIGURE 23-7 Abnormalities in urine sediment stained to enhance detail. A, Red blood cell cast (×900). B, Hyaline cast (×900). C, Hyaline and granular casts (×400). D, Coarse granular cast with adjacent white blood cells (×750). E, Fine and coarse granular cast (×900). F, Oval fat body with adjacent hyalin cast (×400). G, White blood cell cast (×400). |
|
Hyaline or finely granular casts can be seen in normal individuals and provide little useful diagnostic information. Cellular casts are generally more helpful. Red blood cell casts, for example, are distinctive and most often indicate glomerular disease. White blood cell casts are most commonly associated with interstitial nephritis but can also be seen in GN. Casts made up of renal tubular epithelial cells are always indicative of tubular damage. Coarsely granular casts often result from the degeneration of different cellular casts. They also contain protein aggregates. Thus, the presence of granular casts is usually pathologic, but nonspecific. Waxy casts are also nonspecific. They are believed to result from the degeneration of cellular casts and, thus, can be seen in a variety of kidney diseases. Pigmented casts usually derive their distinctive color from bilirubin or hemoglobin, and they are found in hyperbilirubinemia and hemoglobinuria, respectively. Fatty casts contain lipid and oval fat bodies (see preceding section).
Crystals and Other Elements
A large variety of crystals can be seen in the urine sediment. Most result from urine concentration, acidification, and ex vivo cooling of the sample and have little pathologic significance. However, an experienced observer can gain useful information in patients with microhematuria, nephrolithiasis, or toxin ingestion by examining a freshly voided, warm specimen.[306] For example, a large number of calcium oxalate crystals may suggest ethylene glycol toxicity when seen in the right clinical setting. Another example, a large number of uric acid crystals in the setting of acute renal failure suggest tumor lysis syndrome. Calcium oxalate crystals are uniform, small, double pyramids that often appear as crosses in a square. Calcium phosphate crystals, conversely, are usually narrow rectangular needles, often clumped in a flower-like configuration. Uric acid crystals form only in an acidic urine, which favors the conversion of relatively insoluble urate salts into insoluble uric acid. Calcium magnesium ammonium pyrophosphate (so-called triple phosphate) crystals form domed rectangles that take on the appearance of coffin lids. These magnesium ammonium phosphate (struvite) and calcium carbonate-apatite stones occur when ammonia production is increased and the urine pH is elevated to decrease the solubility of phosphate. This combination of events occurs with urease-producing organisms in the urine, such as Proteus or Klebsiella.
Microorganisms
The most common cause of bacteria in the urine is contamination, particularly in specimens that have been improperly collected. The concomitant presence of leukocytes, however, suggests infection. Fungal elements can also be seen, especially in women. Like bacteria, fungi can be contaminants or pathogens. The most common protozoan seen in the urine is Trichomonas vaginalis. Urinary parasites are generally not seen in the urine sediment. In Africa and the Middle East, however, Schistosoma haematobium is common.
KIDNEY BIOPSY
Historical Perspective
The first biopsies of the kidney were likely surgical biopsies performed by the New York gynecologist and surgeon Michael Edelbohls. In 1904, he summarized his experience with therapeutic, surgical stripping of kidneys and mentions that “in a number of cases the diagnosis was confirmed by histological examination of kidney tissue.” Percutaneous kidney biopsy was performed by Ball in 1934, using an aspiration technique to diagnose kidney tumors.[4] In the 1940s, kidney tissue was occasionally obtained accidentally during attempts to biopsy the liver. This development inspired Nils Awall, who began to biopsy the kidney in patients with kidney disease on a regular basis in 1944 (using x-ray guidance), although his results were not reported until 1952.[4]
Antonio Perez-Ara, a pathologist in Cuba, described the use of the cutting Vim-Silverman needle to obtain diagnostic kidney tissue in 1950. His work went largely unnoticed outside of Cuba and was unknown to Poul Iversen and Claus Brun when they began to conduct kidney biopsies in Copenhagen in 1949 using an aspiration needle. Their publication in 1951 brought kidney biopsy to the attention of clinicians everywhere. Biopsies were initially performed in the sitting position, but in the technique described by Robert Kark and Robert Muehrcke in 1954, patients were biopsied in the prone position, with the use of a Vim-Silverman needle and methods similar to those commonly used today. Their introduction of the Franklin-modified Vim-Silverman needle and the initial localization of the kidney with a small atraumatic needle resulted in a better core of tissue and an improved success rate.[4] Since these initial reports, the major advances that have been made center on improved localization of the kidney using ultrasound technology[307] and the introduction of more automated and smaller biopsy needles. Improved methods of tissue processing, staining, and the correlation of the light-microscopic findings with those of electron microscopy and immunofluorescence techniques[4] have led to dramatic increases in our knowledge of kidney disease.
Clinical Utility
A kidney biopsy may be obtained to help establish the diagnosis, suggest prognosis, or direct therapy. The information obtained from a biopsy is still largely qualitative. Although morphometric techniques have been developed to quantify histopathologic alterations, these techniques have been used almost exclusively in research.[308] Even in this setting, few data compare the reproducibility of different techniques to quantify kidney biopsy results.
Overall, relatively few studies have documented the reproducibility of the qualitative, clinical interpretation of kidney biopsy findings. Marcussen and co-workers[309] examined interobserver variation in the interpretation of biopsy specimens (light microscopy only) using the World Health Organization (WHO) classification of GN. One hundred biopsy specimens of a variety of glomerular diseases were circulated among members of a panel, who made their diagnosis without knowledge of the interpretation of other panel members. There was very good overall diagnostic agreement, with a k statistic of 0.61. The highest k values (best agreement) were reported for crescentic GN (0.81), endocapillary GN (0.79), and membranous GN (0.74), whereas the lowest values were for membranoproliferative GN (0.40) and diffuse mesangial proliferative GN (0.44).[309]
The reliability of the National Institutes of Heath histologic scoring system for lupus nephritis was shown to be only moderately reproducible in a nonreferral setting.[310] Probably as important, there is a virtual absence of data clearly indicating which specific renal histopathologic finding predicts progression of structural injury. In general, the relationship between the extent of tubulointerstitial and vascular damage is better correlated with the level of kidney function than is the extent of glomerular injury. A number of studies have inversely correlated the extent of tubulointerstitial damage and fibrosis with kidney function in a variety of kidney diseases.[4] Because biopsy results are largely qualitative, the sensitivity and specificity of biopsy findings are often unclear.
Indications
Since the 1960s, the kidney biopsy has been most instrumental in the development of our understanding of the various types of kidney histopathologic abnormalities that contribute to abnormalities of the urinary sediment. The use of this technique has not only improved our diagnostic acumen but also given new insights into the pathogenesis of human kidney disease. However, as our sophistication and knowledge of the various forms of kidney disease has expanded, questions regarding the routine use of kidney biopsy in all patients with clinical evidence of kidney disease have been articulated.
Paone and Meyer[311] conducted a retrospective evaluation to determine whether kidney biopsy findings influenced therapeutic judgments. Although a definite or probable diagnosis was ascertained in 77% of patients, therapy was modified in only 19%. In large part, changes in therapy based on biopsy findings were confined to patients with proteinuria, with little change seen in those with hematuria. Although therapy was also unaltered in those with acute or chronic kidney disease, it should be underscored that therapy for these indications is relatively nonspecific. Similarly, Cohen and associates,[312] Turner and colleagues,[313] and Shah and co-workers[314] reported the influence of the kidney histopathology results on physicians' judgments regarding diagnosis, prognosis, and treatment in patients with diverse types of kidney disease. They reported changes in judgments in more than one half of patients as a result of information gained directly from the biopsy results. Likewise, Richards and co-workers[315] conducted a prospective study of 276 biopsies and found that biopsy results altered management in 42% of cases. On the other hand, Whiting-O'Keefe and co-workers[316] retrospectively analyzed the case histories of 30 patients who underwent kidney biopsy for severe lupus nephritis. Knowledge of the kidney biopsy failed to improve predictive accuracy scores of estimates of future serum creatinine levels, urine protein levels, renal death, and long-term immunosuppressive therapy.
Questions about the role of kidney biopsy in patients with idiopathic nephrotic syndrome have also emerged. [317] [318] Levey and colleagues[319] reported results of a decision analysis suggesting that initial therapy based on clinical data alone could avoid the use of kidney biopsy in all patients. However, decision analysis cannot replace prospective trials, and additional studies detailing patient outcomes, quality of life, and complications of therapeutic misadventures are needed before biopsy is abandoned as a diagnostic technique in these patients. It is also important to recognize that kidney biopsy is relatively safe and provides a specific diagnosis that may quickly and efficiently define a therapeutic strategy.
At present, there are no specific clinical indications that mandate the use of kidney biopsy, and its utility must be taken in the context of the patients' needs in terms of diagnosis, prognosis, and therapy. Nonetheless, there are clinical settings in which kidney biopsy is likely to be most useful. In the following section, we provide some guidelines that may be used in defining the relative clinical value of a kidney biopsy.
Nephrotic Syndrome
The causes of the nephrotic syndrome are numerous, and the laboratory parameters consistent with this diagnosis are discussed elsewhere. The nephrotic syndrome is either primary or secondary, the latter reflecting either a systemic disease or drug toxicity. Once the secondary forms of the nephrotic syndrome are excluded by appropriate clinical or laboratory data, there remains a group of patients with idiopathic nephrotic syndrome who can be precisely differentiated only by kidney biopsy. This latter category includes minimal change glomerulopathy, focal glomerulosclerosis, and membranous nephropathy. The distribution of these entities is quite different in adults and children, and as a result, different approaches have emerged. In children with the idiopathic nephrotic syndrome, a kidney biopsy is generally not performed initially, and empirical steroid therapy is initiated. This is in large part due to the fact that minimal change glomerulopathy, which is sensitive to steroid therapy, accounts for nearly 80% of cases of the syndrome in children.[4] However, in children who have no response to an appropriate course of steroids or have frequent relapses over a year, a kidney biopsy may become indicated. This would allow specific diagnosis and the potential for tailoring therapy with more potent immunosuppressive therapy.
In the adult patient, minimal change disease is responsible for 20% to 25% of cases of idiopathic nephrotic syndrome; thus, a propensity for performance of a kidney biopsy has traditionally been followed. [311] [320] Therefore, empirical treatment of adults, in the absence of a biopsy diagnosis in idiopathic nephrotic syndrome, would expose a high proportion of patients to the adverse effects of corticosteroids unnecessarily. The goals for therapy as well as disease-specific protocols have evolved over the past few years, making the rationale for an initial biopsy more compelling. Richards and colleagues[315] reported that a biopsy for nephrotic range proteinuria influenced management in 24 out of 28 cases (86%) that were biopsied.
In patients with evidence of elevated levels of serum or urinary light chains in association with proteinuria in the range seen in nephrotic syndrome, a kidney biopsy frequently helps to distinguish amyloidosis from light chain glomerulopathy. In the presence or absence of multiple myeloma, the detection of light chain deposits in the kidney biopsy specimen appears to have prognostic and therapeutic implications.[321]
Systemic Lupus Erythematosus
The diagnosis of SLE is generally established using a variety of clinical and laboratory criteria. Rarely, the diagnosis is first suggested by kidney biopsy findings, particularly when the laboratory test results are negative. However, the yield of kidney biopsy in this clinical situation is low and the information obtained that would affect therapy is relatively low. Kidney involvement in SLE correlates with overall prognosis; the more severe the kidney involvement, the worse the prognosis.[4]
In SLE, the principal glomerular lesion is cellular proliferation, which is variably present in amount and distribution. These changes have most frequently formed the basis for a number of histologic classification schema,[4] the WHO classification being the most commonly used today. The WHO class is correlated with clinical features such as hypertension, urinary sediment, extent of proteinuria, and reduction in GFR as well as with prognosis. In this system, patients with minimal proliferative glomerular changes (class I) have the best prognosis, whereas those with diffuse proliferative changes (class IV) have the worst prognosis.[322] Hence, the treatment is different depending on the biopsy changes. When the types of SLE changes are not clinically evident, a renal biopsy is helpful.
In patients with diffuse proliferative glomerular changes, immunosuppressive therapy with high-dose prednisone has consistently demonstrated improved survival of kidney and patient, although no prospective trial has been performed.[4] It has been proposed that the biopsy results in this form of SLE may help in the selection of the dose and route of administration of steroids as well as the selection of other immunosuppressive drugs. However, this proposition has not been proved in controlled trials. Some, [323] [324] but not all, [310] [325] [326] have found the morphologic findings of activity, chronicity of glomerular and interstitial lesions, or both are related to the risk of subsequent progression of kidney disease in a manner independent of their correlation with clinical indicators of severity of kidney disease. In addition, the intraobserver variability when these approaches are used in routine clinical settings makes their utility marginal at best.[310]
Currently, it appears that the use of more sophisticated quantitative analysis adds little to selection of therapy or prognosticating outcomes. Chagnac and co-workers[327] have performed morphometric studies of glomerular capillary surface area on serial biopsy specimens obtained from SLE patients. These investigators reported evidence of progressive loss of glomerular capillary surface area with no or minimal changes in proteinuria, GFR, or serum creatinine value. These studies would suggest that the kidney biopsy findings may be a more sensitive index of progression than clinical features alone. However, the lack of standardization of morphometric analysis and the time to perform these studies does not allow for their routine histopathologic use.
Rapidly Progressive Glomerulonephritis
In patients with abnormalities of the urinary sediment consistent with a nephritic syndrome and rapidly progressive loss of kidney function, a kidney biopsy may provide invaluable information. Commonly, patients with this syndrome demonstrate the histologic presence of crescents. Ellis is credited with first noting the relationship between the loss of kidney function and the presence of glomerular crescents.[4] Although the number of glomeruli with crescents is variable, most clinical studies that have evaluated outcomes report a poor prognosis when the proportion of glomeruli with circumferential crescents exceed 50%.[328] The pathogenesis of rapidly progressive-cresenteric GN is diverse and is most commonly seen with three types of immunologic injury: anti-glomerular basement membrane antibody with or without pulmonary hemorrhage (Goodpasture's syndrome), immune complex disease, and the so-called pauci-immune GN. This last entity is the most frequently diagnosed disease, particularly when systemic illnesses are excluded. Recognition of the association between antineutrophilic cytoplasmic antibodies, systemic vasculitic syndromes, and pauci-immune cresenteric GN has provided new and important insights in the understanding of the pathogenesis of this disease as well as therapeutic strategies that are clinically useful.[329] Nonetheless, the kidney biopsy still may provide important information about the severity of disease and, thus, has clinical management implications.
Post-Transplantation Biopsy
Biopsy of the transplanted kidney has been established as an important diagnostic and therapeutic technique in the management of patients in whom rejection of the kidney allograft is suspected. It has become particularly important in an era when the differential diagnosis of decreased allograft function includes nephrotoxicity from the immunosuppressive drugs that are most commonly used.[330] Although a variety of histologic techniques, including fine-needle aspiration cytology, have been used, the standard needle-core biopsy processed for conventional, light microscopic histology remains the most reliable technique for diagnosis in the setting of kidney allograft dysfunction.[331]Several classification systems have been proposed to standardize the interpretation of kidney allograft biopsy specimens, but the Banff classification scheme has been most widely adopted.[332] Studies have documented that the interpretation of allograft biopsy findings using the Banff classification system is relatively reproducible and correlates with clinical outcomes.[333] Studies have also examined the amount of tissue necessary to reach concordance in the interpretation of kidney allograft biopsy findings. For example, Sorof and associates[334] found that two cores (obtained with a 15-gauge needle) were needed to avoid missing moderate or severe acute rejection in almost 10% of cases.
Kidney allograft biopsy is generally safe. Most clinicians now carry out the procedure using spring-loaded, automated biopsy needles under direct ultrasound visualization. The principle complication is bleeding. In one study, risk factors for bleeding included biopsy within 30 days of transplantation and the use of a 14-gauge Vim-Silverman rather than an 18-gauge automated needle.[335] Other investigators have confirmed the safety and efficacy of allograft biopsy using 18-gauge, automated needles under direct ultrasound visualization.[336] Although the most common diagnosis resulting from kidney allograft biopsy is acute rejection, biopsies also play a role in differentiating between acute cellular and acute humoral rejection and also in determining the cause of proteinuria and chronic allograft dysfunction. Recurrence of the original glomerulopathy in the transplanted kidney has been observed with a variety of kidney diseases. Other than focal glomerulosclerosis, most of the other recurrent glomerulopathies appear to have little functional impact outcome after transplantation.[4] Biopsy findings, particularly the amount of interstitial fibrosis,[337] are useful in predicting the long-term function of the transplanted kidney independent of the underlying cause of kidney damage.
Asymptomatic Urinary Abnormalities
The finding of small quantities of isolated proteinuria is a common clinical problem. In a survey of 68,000 army recruits without a history of hypertension or kidney disease, only 1% were found to have isolated proteinuria.[338] Of the 45 patients who underwent biopsy, 33 (73%) had mild mesangial proliferation with or without glomerulosclerosis. If the proteinuria was intermittent or postural, significant glomerular lesions were infrequent. No lesion was serious enough to warrant therapy. Although no changes in kidney function were noted over a 3-year interval in these patients, longer-term follow-up has not been reported. At present, there is no evidence that a kidney biopsy provides more prognostic information than evaluation of the pattern of proteinuria and routine clinical follow-up.
Isolated hematuria occurs as commonly as isolated proteinuria.[339] Frequently, routine evaluation of the urinary tract will indicate the nonrenal source of the hematuria and kidney biopsy is not necessary. However, kidney biopsy has been proposed as an accurate and direct way to identify the cause of isolated hematuria. Kidney biopsy is abnormal in over 75% of patients with hematuria in whom proteinuria or reduced kidney function is present.[340] In this setting, IgA nephropathy is the most common diagnosis, although hereditary nephritis or thinning of the glomerular basement membrane is also seen.[340] Proven, effective, and specific therapies for such entities as IgA nephropathy have not as yet been developed, and thus, the utility of the biopsy to guide therapy has not been shown. Although a number of histopathologic changes predict renal outcomes, several clinical features such as reduced kidney function, proteinuria, and hypertension accurately predict a poor prognosis.[341] At present, additional therapeutic or prognostic information is not gained from a kidney biopsy. Richards and colleagues[315] reported in a study of 276 native kidney biopsies that the renal biopsies changed management in only 1 out of 36 cases of isolated hematuria. However, for some patients, the specific diagnosis may be useful for genetic counseling purposes such as in Alport's syndrome.
Other Indications
A kidney biopsy does not seem indicated in patients with chronic, end-stage renal failure, and biopsy in this setting is probably associated with an increased risk of complications. In patients with acute kidney injury, in whom no obvious cause for rapid deterioration in kidney function can be found, kidney biopsy may be indicated.[4] Biopsy in this setting appears valuable mostly for those few patients with acute allergic interstitial nephritis in whom a course of corticosteroids may be of benefit.
Cholesterol embolic acute renal failure without the typical clinical presentation has been more commonly observed in older patients with atherosclerotic disease, presenting a diagnostic challenge. Because some of these patients may regain kidney function after prolonged intervals, closer attention to kidney function while on dialysis is appropriate. However, a clear-cut case for the utility of a kidney biopsy for diagnosis, prognosis, or therapy has not been made in patients with acute kidney injury.[4]
Occasionally, patients with diabetes mellitus may be considered for kidney biopsy, particularly when they present with severe proteinuria in the absence of other manifestations of diabetic microvascular disease or when the duration of the disease is short. In this setting, other kidney diseases, such as idiopathic nephrotic syndrome, can be seen.[4]
Patient Preparation
Before biopsy, the patient should be evaluated for condi-tions that may increase the risk or worsen consequences of complications. Postbiopsy bleeding can necessitate nephrectomy, and the consequences of this complication are obviously greater in patients with only one functioning kidney. It was once believed that the presence of a solitary (native) kidney was an absolute contraindication to kidney biopsy.[342] However, the use of 18-gauge automated needles and direct ultrasound visualization have reduced the risk, and biopsy of a solitary kidney is no longer considered to be contraindicated.[343] Most clinicians consider the biopsy of a very small, shrunken kidney to be ill advised. In any case, a practical approach is to first visualize both kidneys with ultrasonography. If the kidneys are reasonable in size, the operator can proceed directly to biopsy under direct ultrasonographic guidance. This approach obviates the need for a second radiologic procedure to assess the size and number of kidneys.
Because bleeding is the major complication of biopsy, most clinicians obtain a coagulation profile. A platelet count, prothrombin time, and partial thromboplastin time (and, possibly, a bleeding time if the patient is uremic) can be used to screen for bleeding tendencies. Although the exact correlation between abnormalities in these coagulation screening tests and postbiopsy bleeding is not known, prudence would dictate that biopsies should be carried out with great reluctance in patients with coagulation abnormalities. Probably the most commonly encountered abnormality is a prolonged bleeding time caused by platelet dysfunction in patients who are uremic. A number of steps can be taken to correct the prolonged bleeding time associated with uremia. They include the use of fresh frozen plasma, arginine vasopressin, and estrogens.[344] If the patient is acutely uremic, hemodialysis is usually of value in improving the coagulopathy. Salicylates or nonsteriodal anti-inflammatory drugs should be discontinued, if possible, at least 1 to 2 weeks after the procedure.[345] For patients with bleeding diathesis or those undergoing anticoagulation for a thromboembolic disorder, the accepted approach is not clear. Guidelines devised for the management of anticoagulated patients before and after elective surgery are of uncertain relevance to a kidney biopsy, a closed procedure in which the level of hemostasis cannot be determined.[346] Suspending anticoagulation or treating the diathesis is feasible, although many investigators recommend open biopsy with direct visualization of the kidney.[347] Alternatively, transjugular kidney biopsy has been successfully performed in some institutions,[348] although some centers have reported significant rates of bleeding owing to capsular perforation.[348] Significant anemia that would substantially increase risk of bleeding should be corrected before a kidney biopsy is performed.
Uncontrolled hypertension can raise the risk of bleeding after biopsy.[349] Therefore, it is advisable to control blood pressure before the procedure is undertaken. Having the patient void immediately before the biopsy may help reduce the risk of inadvertently puncturing the bladder. Because a major complication of biopsy can require surgical intervention, it may be advisable to carry out the procedure with the patient fasting in order to reduce the potential risks of vomiting and aspiration during anesthesia induction. However, these risks must be weighed against the risk of hypoglycemia in diabetic patients and the rarity of complications requiring surgical intervention.
With the use of direct ultrasound visualization and 18-gauge, automated needles, the complication rate from biopsy has been reduced. [350] [351] Indeed, it is now possible to perform biopsies safely in an outpatient setting, [351] [352]making the procedure more convenient for both patients and clinicians and greatly reducing cost.
Localization
There are few controlled studies comparing the use of different radiographic localization techniques for percutaneous kidney biopsy. Fluoroscopy was used in the past, but adequate imaging of the kidneys often requires intravenous administration of contrast media, which can be nephrotoxic. CT can be used, but the inability to guide the biopsy needle in “real time” makes the procedure somewhat cumbersome.[353] The greatest value of CT is likely in morbidly obese patients,[354] a group in whom the use of ultrasonography is sometimes limited. Ultrasound with continuous visualization of the biopsy needle, however, usually provides adequate imaging[355] and is less costly than CT. It appears that newer techniques using direct ultrasonographic guidance are safer than older techniques; however, ultrasonographic guidance and automated needle devises were introduced simultaneously, making it difficult to determine which of these advances resulted in the apparent reduction in the rate of complications.[356]
Needle Selection
In the past, the Tru-Cut (Travenol) and the Franklin-modified Vim-Silverman needles were most commonly used to perform percutaneous kidney biopsies. Automated, spring-loaded biopsy devices have been developed.[356] Some studies, although largely uncontrolled, have suggested that the new automated devices may reduce the incidence of postbiopsy bleeding without reducing the chances of obtaining adequate tissue.[357] Automated devices have led to significantly larger sample sizes than with manual devices using comparable-gauged needles.[345] A prospective, randomized trial involving 100 consecutive allograft biopsy procedures showed a correlation between needle gauge and sample size, with 14-gauge needles providing the largest number of glomeruli per core and the greatest diagnostic success compared with 16-gauge and 18-gauge needles. The complication rates of the three groups were not significantly different, although the 14-gauge needle was associated with more pain.[358]
Processing of the Specimen
Proper interpretation of a kidney biopsy specimen optimally requires examination by light, immunofluorescence, and electron microscopy. Immediate placement of tissue in appropriate fixatives is important to obtain the best histologic-stained material. The availability of a pathologist experienced in processing kidney specimens is particularly helpful in preparing adequate kidney tissue. In general, obtaining two cores of cortical tissue usually provides sufficient material for all examinations. Each core is divided longitudinally with a razor blade in order to obtain glomeruli in each section. The majority of the tissue is processed for light microscopy, and the remainder for immunofluorescence and electron microscopy. If difficulty is encountered in obtaining sufficient tissue cores, the small fragments can be processed for electron microscopy, and the remainder processed for immunofluorescence microscopy.
Numerous fixatives are available for histologic preparation, and tissue for light microscopy is usually fixed in paraffin or plastic and cut in 2-mm-thick sections, which are routinely stained with hematoxylin and eosin, a silver methenamine stain, and a periodic acid-Schiff or trichrome stain. If amyloidosis is suspected, Congo red and thioflavin T stains are performed. Tissue for immunofluorescence microscopy is placed in pre-cooled isopentane and snap frozen in liquid nitrogen. Frozen sections are cut 4 mm thick and typically stained with fluoresceinated antisera against IgG, immunoglobulin M (IgM), IgA, complement components C3 and C4, fibrin/fibrinogen, and albumin. When indicated, antibodies for specific immunoglobulin light chains or specific cell surface markers can be used. The complement-split product C4d has been found to be an independent predictor of kidney allograft injury and a specific marker for antibody-dependent allograft injury.[359]
For electron microscopic studies, small (1-mm) pieces of the biopsy specimen are fixed in buffered glutaraldehyde or other suitable fixatives, dehydrated in graded alcohols, embedded in plastic, and sectioned. Ultrathin sections are stained with uranyl acetate and lead citrate and examined with a transmission electron microscope. Electron microscopy provides useful diagnostic information in nearly one half of all native kidney biopsy specimens.[360] However, to reduce cost, it is reasonable to set aside tissue for electron microscopy until the light-microscopic evaluation of tissue has been completed.
Complications
The most common complication of a kidney biopsy is hematuria. Microscopic hematuria occurs virtually in all patients, whereas gross hematuria occurs in less than 10% of patients. Gross hematuria has also been associated with intrarenal arteriovenous fistulas.[361] The presence of uncontrolled hypertension, anticoagulation, or azotemia increases the risk for hematuria.[362] Hematuria usually resolves spontaneously in 48 to 72 hours, although in approximately 0.5 % of patients, hematuria persists for 2 to 3 weeks. [342] [361] Occasionally, gross hematuria occurs days after the biopsy, but it usually resolves within a few days with rest.[342] Transfusions are necessary in 0.1% to 3% of patients.[342] Surgery for persistent bleeding is required in less than 0.3% of patients. [342] [361]
Perinephric hematomas occur commonly. In patients who are evaluated by CT immediately after kidney biopsy, hematomas were detected in 57% to 85% of patients. [363] [364] Most of these are clinically occult, perhaps associated with only a fall in hemoglobin.[342] In 1% to 2% of patients, perinephric hematoma is manifested as flank pain and swelling associated with signs of volume contraction and a decrease in hematocrit. Rarely, these hematomas can become infected, requiring antibiotic therapy and surgical drainage,[361] and rarely, they lead to chronic hypertension owing to pressure-induced ischemia from a large subcapsular hematoma producing a persistent activation of the renin-angiotensin system.[365]
Less common complications of renal biopsy include arteriovenous fistulas, aneurysms, and infections. Arteriovenous fistulas can be demonstrated by arteriography in 15% to 18% of patients. They are usually clinically silent, and the majority spontaneously resolve in 2 years.[4] Postbiopsy aneurysms have been reported in less than 1% of patients.[342] Infections are unusual except in the presence of pyelonephritis. The development of sepsis and bacteremia after kidney biopsy has been reported.[4]
A number of unusual complications of kidney biopsy have been reported including ileus, lacerations of other abdominal organs, pneumothorax, ureteral obstruction, and dissemination of carcinoma. The mortality associated with 14,492 reported kidney biopsies is 0.12%,[361] although only 1 death have been reported since 1980.[345]
References
1. Sarnak MJ, Levey AS, Schoolwerth AC, et al: Kidney disease as a risk factor for development of cardiovascular disease: A statement from the American Heart Association Councils on Kidney in Cardiovascular Disease, High Blood Pressure Research, Clinical Cardiology, and Epidemiology and Prevention. Hypertension 2003; 42:1050-1065.
2. Gerstein HC, Mann JF, Yi Q, et al: Albuminuria and risk of cardiovascular events, death, and heart failure in diabetic and nondiabetic individuals. JAMA 2001; 286:421-426.
3. National Kidney Foundation Kidney: K/DOQI Clinical Practice Guidelines for Chronic Kidney Disease: Evaluation, classification and stratification. Am J Kidney Dis 2002; 39(suppl 1):S1-S266.
4. Silkensen JR, Kasiske BL: Laboratory assessment of renal disease: Clearance, urinalysis, and renal biopsy. In: Brenner BM, ed. Brenner and Rector's The Kidney, 7th ed. Philadelphia: Saunders; 2004:1107-1150.
5. Young DS: Effects of Drugs on Clinical Laboratory Tests, 3rd ed. Washington, DC: American Association for Clinical Chemistry Press; 1990:3-4.
6. Young DS: Effects of Drugs on Clinical Laboratory Tests, 3rd ed. Washington, DC: American Association for Clinical Chemistry Press; 1990:3-359.
7. Levey AS, Berg RL, Gassman JJ, et al: Creatinine filtration, secretion and excretion during progressive renal disease. Kidney Int 1989; 36(suppl 27):S-73-S-80.
8. Coresh J, Toto RD, Kirk KA, et al: Creatinine clearance as a measure of GFR in screenees for the African-American Study of Kidney Disease and Hypertension pilot study. Am J Kidney Dis 1998; 32:32-42.
9. Shemesh O, Golbetz H, Kriss JP, Myers BD: Limitations of creatinine as a filtration marker in glomerulopathic patients. Kidney Int 1985; 28:830-838.
10. Mitch WE, Collier VU, Walser M: Creatinine metabolism in chronic renal failure. Clin Sci 1980; 58:327-335.
11. Hankins DA, Babb AL, Uvelli DA, Scribner BH: Creatinine degradation: I: The kinetics of creatinine removal in patients with chronic kidney disease. Int J Artif Organs 1981; 4:35-39.
12. Dunn SR, Gabuzda GM, Superdock KR, et al: Induction of creatininase activity in chronic renal failure: Timing of creatinine degradation and effect of antibiotics. Am J Kidney Dis 1997; 29:72-77.
13. Bonsnes RW, Taussky HH: On the colorimetric determination of creatinine by Jaffé reaction. J Biol Chem 1945; 158:581-591.
14. Hare RS: Endogenous creatinine in serum and urine. Proc Soc Exp Biol Med 1950; 74:148.
15. Mandel EE, Jones FL: Studies in nonprotein nitrogen: III. Evaluation of methods measuring creatinine. J Lab Clin Med 1953; 41:323-334.
16. Fabiny DL, Ertingshausen G: Automated reaction-rate method for determination of serum creatinine with the Centritichem. Clin Chem 1971; 17:696-700.
17. Toffaletti J, Blosser N, Hall T, et al: An automated dry-slid enzymatic method evaluated for measurement of creatinine in serum. Clin Chem 1983; 29:684-687.
18. Jacobs DS, De Mott WR, Strobel SL, Fody EP: Chemistry. In: Jacobs DS, Kasten BL, De Mott WR, Wolfson WL, ed. Laboratory Test Handbook, Baltimore: Williams & Wilkins; 1990:171-172.
19. Miller WG, Myers GL, Ashwood ER, et al: Creatinine measurement: State of the art in accuracy and interlaboratory harmonization. Arch Pathol Lab Med 2005; 129:297-304.
20. Swain RR, Briggs SL: Positive interference with the Jaffé reaction by cephalosporin antibiotics. Clin Chem 1977; 23:1340-1342.
21. Durham SR, Bignell AHC, Wise R: Interference of cefoxitin in the creatinine estimation and its clinical relevance. J Clin Pathol 1979; 32:1148-1151.
22. Saah AJ, Koch TR, Drusano GL: Cefoxitin falsely elevates creatinine levels. JAMA 1982; 247:205-206.
23. Young DS: Effects of Drugs on Clinical Laboratory Tests, 3rd ed. Washington, DC: American Association of Clinical Chemistry Press; 1990:3-128.
24. Doolan PD, Alpen EL, Theil GB: A clinical appraisal of the plasma concentration and endogenous clearance of creatinine. Am J Med 1962; 32:65-79.
25. Gerard SK, Khayam-Bashi H: Characterization of creatinine error in ketotic patients: A prospective comparison of alkaline picrate methods with an enzymatic method. Am J Clin Pathol 1985; 84:659-664.
26. Osberg IM, Hammond KB: A solution to the problem of bilirubin interference with the kinetic Jaffé method for serum creatinine. Clin Chem 1978; 24:1196-1197.
27. Kasiske BL: Creatinine excretion after renal transplantation. Transplantation 1989; 48:424-428.
28. Payne RB: Creatinine clearance: A redundant clinical investigation. Ann Clin Biochem 1986; 23:243-250.
29. DeSanto NG, Coppola S, Anastasio P, et al: Predicted creatinine clearance to assess glomerular filtration rate in chronic renal disease in humans. Am J Nephrol 1991; 11:181-185.
30. Fuller NJ, Elia M: Factors influencing the production of creatinine: Implications for the determination and interpretation of urinary creatinine and creatine in man. Clin Chim Acta 1988; 175:199-210.
31. van Acker BAC, Koomen GCM, Koopman MG, et al: Discrepancy between circadian rhythms of inulin and creatinine clearance. J Lab Clin Med 1992; 120:400-410.
32. Morgan DB, Dillon S, Payne RB: The assessment of glomerular function: Creatinine clearance or plasma creatinine?. Postgrad Med J 1978; 54:302-310.
33. Rosano TG, Brown HH: Analytical and biological variability of serum creatinine and creatinine clearance: Implications for clinical interpretation. Clin Chem 1982; 28:2330-2331.
34. Bröchner-Mortensen J, Rödbro P: Selection of routine method for determination of glomerular filtration rate in adult patients. Scand J Clin Lab Invest 1976; 36:35-43.
35. Roubenoff R, Drew H, Moyer M, et al: Oral cimetidine improves the accuracy and precision of creatinine clearance in lupus nephritis. Ann Intern Med 1990; 113:501-506.
36. van Acker BAC, Koomen GCM, Koopman MG, et al: Creatinine clearance during cimetidine administration for measurement of glomerular filtration rate. Lancet 1992; 340:1326-1329.
37. Richter JM, Colditz GA, Huse DM, et al: Cimetidine and adverse reactions: A meta-analysis of randomized clinical trials of short-term therapy. Am J Med 1989; 87:278-284.
38. Jelliffe RW, Jelliffe SM: Estimation of creatinine clearance from changing serum-creatinine levels. Lancet 1971; 2:710.
39. Mawer GE, Knowles BR, Lucas SB, Stirland RM: Computer-assisted dosing of kanamycin for patients with renal insufficiency. Lancet 1972; 1:12-14.
40. Jelliffe RW: Creatinine clearance: Bedside estimate. Ann Intern Med 1973; 79:604.
41. Kampmann J, Siersbæk-Nielson K, Kristensen M, Mølholm-Hansen J: Rapid evaluation of creatinine clearance. Acta Med Scand 1974; 196:517-520.
42. Cockcroft DW, Gault MH: Prediction of creatinine clearance from serum creatinine. Nephron 1976; 16:31-41.
43. Hull JH, Hak LJ, Koch GG, et al: Influence of range of renal function and liver disease on predictability of creatinine clearance. Clin Pharmacol Ther 1981; 29:516-521.
44. Sawyer WT, Canaday BR, Poe TE, et al: A multicenter evaluation of variables affecting the predictability of creatinine clearance. Am J Clin Pathol 1982; 78:832-838.
45. Taylor GO, Bamgboye EA, Oyedriran ABOO, Longe O: Serum creatinine and prediction formulae for creatinine clearance. Afr J Med Sci 1982; 11:175-181.
46. Bjornsson TD, Cocchetto DM, McGowan FX, et al: Nomogram for estimating creatinine clearance. Clin Pharmacokinet 1983; 8:365-369.
47. Rolin III HA, Hall PM, Wei R: Inaccuracy of estimated creatinine clearance for prediction of iothalamate glomerular filtration rate. Am J Kidney Dis 1984; 4:48-54.
48. Gates GF: Creatinine clearance estimation from serum creatinine values: An analysis of three mathematical models of glomerular function. Am J Kidney Dis 1985; 5:199-205.
49. Sinton TJ, De Leacy EA, Cowley DM: Comparison of 51Cr EDTA clearance with formulae in the measurement of glomerular filtration rate. Pathology 1986; 18:445-447.
50. Trollfors B, Alestig K, Jagenburg R: Prediction of glomerular filtration rate from serum creatinine, age, sex and body weight. Acta Med Scand 1987; 221:495-498.
51. Gault MH, Longerich LL, Harnett JD, Wesolowski C: Predicting glomerular function from adjusted serum creatinine. Nephron 1992; 62:249-256.
52. Walser M, Drew HH, Guldan JL: Prediction of glomerular filtration rate from serum creatinine concentration in advanced chronic renal failure. Kidney Int 1993; 44:1145-1148.
53. Levey AS, Bosch JP, Lewis JB, et al: A more accurate method to estimate glomerular filtration rate from serum creatinine: A new prediction equation. Modification of Diet in Renal Disease Study Group. Ann Intern Med 1999; 130:461-470.
54. Levey AS: Use of glomerular filtration rate measurements to assess the progression of renal disease. Semin Nephrol 1989; 9:370-379.
55. Coresh J, Astor BC, McQuillan G, et al: Calibration and random variation of the serum creatinine assay as critical elements of using equations to estimate glomerular filtration rate. Am J Kidney Dis 2002; 39:920-929.
56. Waz WR, Feld LG, Quattrin T: Serum creatinine, height, and weight do not predict glomerular filtration rate in children with IDDM. Diabetes Care 1993; 16:1067-1070.
57. Vervoort G, Willems HL, Wetzels JF: Assessment of glomerular filtration rate in healthy subjects and normoalbuminuric diabetic patients: Validity of a new (MDRD) prediction equation. Nephrol Dial Transplant 2002; 17:1909-1913.
58. European Best Practice Guidelines for Haemodialysis (Part 1). Section I : Measurement of renal function, when refer and when to start dialysis. Nephrol Dial Transplant 2002; 17(suppl 7):7-15.
59. Lin J, Knight EL, Hogan ML, Singh AK: A comparison of prediction equations for estimating glomerular filtration rate in adults without kidney disease. J Am Soc Nephrol 2003; 14:2573-2580.
60. Li Z, Lew NL, Lazarus JM, Lowrie EG: Comparing the urea reduction ratio and the urea product as outcome-based measures of hemodialysis dose. Am J Kidney Dis 2000; 35:598-605.
61. Gaspari F, Ferrari S, Stucchi N, et al: Performance of different prediction equations for estimating renal function in kidney transplantation. Am J Transplant 2004; 4:1826-1835.
62. Simonsen O, Grubb A, Thysell H: The blood serum concentration of cystatin C (gamma-trace) as a measure of the glomerular filtration rate. Scand J Clin Lab Invest 1985; 45:97-101.
63. Grubb A: Diagnostic value of analysis of cystatin C and protein HC in biological fluids. Clin Nephrol 1992; 38(suppl 1):S20-S27.
64. Kyhse-Andersen J, Schmidt C, Nordin G, et al: Serum cystatin C, determined by a rapid, automated particle-enhanced turbidimetric method, is a better marker than serum creatinine for glomerular filtration rate. Clin Chem 1994; 40:1921-1926.
65. Newman DJ, Thakkar H, Edwsards RG, et al: Serum cystatin C measured by automated immunoassay: A more sensitive marker of changes in GFR than serum creatinine. Kidney Int 1995; 47:312-318.
66. Tian S, Kusano E, Ohara T, et al: Cystatin C measurement and its practical use in patients with various renal diseases. Clin Nephrol 1997; 48:104-108.
67. Randers E, Erlandsen EJ: Serum cystatin C as an endogenous marker of the renal function—A review. Clin Chem Lab Med 1999; 37:389-395.
68. Laterza OF, Price CP, Scott MG: Cystatin C: An improved estimator of glomerular filtration rate?. Clin Chem 2002; 48:699-707.
69. Vinge E, Lindergard B, Nilsson-Ehle P, Grubb A: Relationships among serum cystatin C, serum creatinine, lean tissue mass and glomerular filtration rate in healthy adults. Scand J Clin Lab Invest 1999; 59:587-592.
70. Norlund L, Fex G, Lanke J, et al: Reference intervals for the glomerular filtration rate and cell-proliferation markers: Serum cystatin C and serum beta 2-microglobulin/cystatin C-ratio. Scand J Clin Lab Invest 1997; 57:463-470.
71. Knight EL, Verhave JC, Spiegelman D, et al: Factors influencing serum cystatin C levels other than renal function and the impact on renal function measurement. Kidney Int 2004; 65:1416-1421.
72. Rule AD, Bergstralh EJ, Slezak JM, et al: Glomerular filtration rate estimated by cystatin C among different clinical presentations. Kidney Int 2006; 69:399-405.
73. Bokenkamp A, Domanetzki M, Zinck R, et al: Reference values for cystatin C serum concentrations in children. Pediatr Nephrol 1998; 12:125-129.
74. Bokenkamp A, Domanetzki M, Zinck R, et al: Cystatin C—A new marker of glomerular filtration rate in children independent of age and height. Pediatrics 1998; 101:875-881.
75. Finney H, Newman DJ, Price CP: Adult reference ranges for serum cystatin C, creatinine and predicted creatinine clearance. Ann Clin Biochem 2000; 37(pt 1):49-59.
76. Tenstad O, Roald AB, Grubb A, Aukland K: Renal handling of radiolabelled human cystatin C in the rat. Scand J Clin Lab Invest 1996; 56:409-414.
77. Uchida K, Gotoh A: Measurement of cystatin-C and creatinine in urine. Clin Chim Acta 2002; 323:121-128.
78. Hayashi T, Nitta K, Hatano M, et al: The serum cystatin C concentration measured by particle-enhanced immunonephelometry is well correlated with inulin clearance in patients with various types of glomerulonephritis. Nephron 1999; 82:90-92.
79. Herget-Rosenthal S, Feldkamp T, Volbracht L, Kribben A: Measurement of urinary cystatin C by particle-enhanced nephelometric immunoassay: Precision, interferences, stability and reference range. Ann Clin Biochem 2004; 41:111-118.
80. Dharnidharka VR, Kwon C, Stevens G: Serum cystatin C is superior to serum creatinine as a marker of kidney function: A meta-analysis. Am J Kidney Dis 2002; 40:221-226.
81. Coll E, Botey A, Alvarez L, et al: Serum cystatin C as a new marker for noninvasive estimation of glomerular filtration rate and as a marker for early renal impairment. Am J Kidney Dis 2000; 36:29-34.
82. Stickle D, Cole B, Hock K, et al: Correlation of plasma concentrations of cystatin C and creatinine to inulin clearance in a pediatric population. Clin Chem 1998; 44:1334-1338.
83. Woitas RP, Stoffel-Wagner B, et al: Correlation of serum concentrations of cystatin C and creatinine to inulin clearance in liver cirrhosis. Clin Chem 2000; 46:712-715.
84. Donadio C, Lucchesi A, Ardini M, Giordani R: Cystatin C, beta 2-microglobulin, and retinol-binding protein as indicators of glomerular filtration rate: Comparison with plasma creatinine. J Pharm Biomed Anal 2001; 24:835-842.
85. Thomassen SA, Johannesen IL, Erlandsen EJ, et al: Serum cystatin C as a marker of the renal function in patients with spinal cord injury. Spinal Cord 2002; 40:524-528.
86. Mangge H, Liebmann P, Tanil H, et al: Cystatin C, an early indicator for incipient renal disease in rheumatoid arthritis. Clin Chim Acta 2000; 300:195-202.
87. Fliser D, Ritz E: Serum cystatin C concentration as a marker of renal dysfunction in the elderly. Am J Kidney Dis 2001; 37:79-83.
88. Shlipak MG, Sarnak MJ, Katz R, et al: Cystatin C and the risk of death and cardiovascular events among elderly persons. N Engl J Med 2005; 352:2049-2060.
89. Oddoze C, Morange S, Portugal H, et al: Cystatin C is not more sensitive than creatinine for detecting early renal impairment in patients with diabetes. Am J Kidney Dis 2001; 38:310-316.
90. Mussap M, Dalla VM, Fioretto P, et al: Cystatin C is a more sensitive marker than creatinine for the estimation of GFR in type 2 diabetic patients. Kidney Int 2002; 61:1453-1461.
91. Le Bricon T, Thervet E, Froissart M, et al: Plasma cystatin C is superior to 24-h creatinine clearance and plasma creatinine for estimation of glomerular filtration rate 3 months after kidney transplantation. Clin Chem 2000; 46:1206-1207.
92. Risch L, Herklotz R, Blumberg A, Huber AR: Effects of glucocorticoid immunosuppression on serum cystatin C concentrations in renal transplant patients. Clin Chem 2001; 47:2055-2059.
93. Bokenkamp A, Domanetzki M, Zinck R, et al: Cystatin C serum concentrations underestimate glomerular filtration rate in renal transplant recipients. Clin Chem 1999; 45:1866-1868.
94. Cimerman N, Brguljan PM, Krasovec M, et al: Serum cystatin C, a potent inhibitor of cysteine proteinases, is elevated in asthmatic patients. Clin Chim Acta 2000; 300:83-95.
95. Bjarnadottir M, Grubb A, Olafsson I: Promoter-mediated, dexamethasone-induced increase in cystatin C production by HeLa cells. Scand J Clin Lab Invest 1995; 55:617-623.
96. Risch L, Blumberg A, Huber A: Rapid and accurate assessment of glomerular filtration rate in patients with renal transplants using serum cystatin C. Nephrol Dial Transplant 1999; 14:1991-1996.
97. Bokenkamp A, van Wijk JA, Lentze MJ, Stoffel-Wagner B: Effect of corticosteroid therapy on serum cystatin C and beta2-microglobulin concentrations. Clin Chem 2002; 48:1123-1126.
98. Bokenkamp A, Ozden N, Dieterich C, et al: Cystatin C and creatinine after successful kidney transplantation in children. Clin Nephrol 1999; 52:371-376.
99. Keevil BG, Kilpatrick ES, Nichols SP, Maylor PW: Biological variation of cystatin C: Implications for the assessment of glomerular filtration rate. Clin Chem 1998; 44:1535-1539.
100. Deinum J, Derkx FH: Cystatin for estimation of glomerular filtration rate?. Lancet 2000; 356:1624-1625.
101. Mussap M, Plebani M: Biochemistry and clinical role of human cystatin C. Crit Rev Clin Lab Sci 2004; 41:467-550.
102. Levey AS: Measurement of renal function in chronic renal disease. Kidney Int 1990; 38:167-184.
103. Schnurr E, Lahme W, Küppers H: Measurement of renal clearance of inulin and PAH in the steady state without urine collection. Clin Nephrol 1980; 13:26-29.
104. van Guldener C, Gans ROB, ter Wee PM: Constant infusion clearance is an inappropriate method for accurate assessment of an impaired glomerular filtration rate. Nephrol Dial Transplant 1995; 10:47-51.
105. van Acker BAC, Koomen GCM, Arisz L: Drawbacks of the constant-infusion technique for measurement of renal function. Am J Physiol 1995; 268:F543-F552.(Renal Fluid Electrolyte Physiol 37)
106. Florijn KW, Barendregt JNM, Lentjex EGWM, et al: Glomerular filtration rate measurement by “single-shot” injection of inulin. Kidney Int 1994; 46:252-259.
107. Rosenbaum RW, Hruska KA, Anderson C, et al: Inulin: An inadequate marker of glomerular filtration rate in kidney donors and transplant recipients?. Kidney Int 1979; 16:179-186.
108. Brochner-Mortensen J: Current status on assessment and measurement of glomerular filtration rate. Clin Physiol 1984; 5:1-17.
109. Pihl B: The single injection technique for determination of renal clearance. V. A comparison with the continuous infusion technique in the dog and in man. Scand J Urol Nephrol 1974; 8:147-154.
110. Carlsen JE, Moller ML, Lund JO, Trap-Jensen J: Comparison of four commercial Tc-99m(Sn)DTPA preparations used for the measurement of glomerular filtration rate: Concise communications. J Nucl Med 1980; 21:126-129.
111. Russell CD, Bischoff PG, Rowell KL, et al: Quality control of Tc-99m DTPA for measurement of glomerular filtration: Concise communication. J Nucl Med 1983; 24:722-727.
112. Sambataro M, Thomaseth K, Pacini G, et al: Plasma clearance rate of 51Cr-EDTA provides a precise and convenient technique for measurement of glomerular filtration rate in diabetic humans. J Am Soc Nephrol 1996; 7:118-127.
113. Bianchi C, Donadio C, Tramonti G: Noninvasive methods for the measurement of total renal function. Nephron 1981; 28:53-57.
114. Gaspari F, Mosconi L, Viganò G, et al: Measurement of GFR with a single intravenous injection of nonradioactive iothalamate. Kidney Int 1992; 41:1081-1084.
115. Tauxe WN: Determination of glomerular filtration rate by single sample technique following injection of radioiodinated diatrizoate. J Nucl Med 1986; 27:45-50.
116. Tepe PG, Tauxe WN, Bagchi A, et al: Comparison of measurement of glomerular filtration rate by single sample, plasma disappearance slope/intercept and other methods. Eur J Nucl Med 1987; 13:28-31.
117. Rydström M, Tengström B, Cederquist I, Ahlmén J: Measurement of glomerular filtration rate by single-injection, single-sample techniques, using 51Cr-EDTA or iohexol. Scand J Urol Nephrol 1995; 29:135-139.
118. Lundqvist S, Hietala SO, Groth S, Sjodin JG: Evaluation of single sample clearance calculations of 902 patients. A comparison of multiple and single sample techniques. Acta Radiol 1997; 38:68-72.
119. Gaspari F, Guerini E, Perico N, et al: Glomerular filtration rate determined from a single plasma sample after intravenous iohexol injection: Is it reliable?. J Am Soc Nephrol 1996; 7:2689-2693.
120. Ham HR, Piepsz A: Feasibility of estimating glomerular filtration rate in children using single-sample adult technique. J Nucl Med 1996; 37:1808.
121. Fleming JS, Waller DG: Feasibility of estimating glomerular filtration rate on children using single-sample adult technique. Letter. J Nucl Med 1997; 38:1665-1667.
122. Al-Uzri A, Holliday MA, Gambertoglio JG, et al: An accurate practical method for estimating GFR in clinical studies using a constant subcutaneous infusion. Kidney Int 1992; 41:1701-1706.
123. Sanger JJ, Kramer EL: Radionuclide quantitation of renal function. Urol Radiol 1992; 14:69-78.
124. Blaufox MD, Aurell M, Bubeck B, et al: Report of the Radionuclides in Nephrourology Committee on Renal Clearance. J Nucl Med 1996; 37:1883-1890.
125. Oriuchi N, Inoue T, Hayashi I, et al: Evaluation of gamma camera-based measurement of individual kidney function using iodine-123 orthoiodohippurate. Eur J Nucl Med 1996; 23:371-375.
126. Blomley MJK, Dawson P: Review article: The quantification of renal function with enhanced computed tomography. Br J Radiol 1996; 69:989-995.
127. Niendorf ER, Grist TM, Lee Jr FT, et al: Rapid in vivo measurement of single-kidney extraction fraction and glomerular filtration rate with MR imaging. Radiology 1998; 206:791-798.
128. Goates JJ, Morton KA, Whooten WW, et al: Comparison of methods for calculating glomerular filtration rate: Technetium-99m-DTPA scintigraphic analysis, protein-free and whole-plasma clearance of technetium-99m-DTPA and iodine-125-iothalamate clearance. J Nucl Med 1990; 31:424-429.
129. Rabito CA, Panico F, Rubin R, et al: Noninvasive, real-time monitoring of renal function during critical care. J Am Soc Nephrol 1994; 4:1421-1428.
130. Bianchi C, Bonadio M, Donadio C, et al: Measurement of glomerular filtration rate in man using DTPA-99mTc. Nephron 1979; 24:174-178.
131. Dubovsky EV, Russell CD: Quantitation of renal function with glomerular and tubular agents. Semin Nucl Med 1982; 12:308-329.
132. O'Reilly PH, Brooman PJC, Martin PJ, et al: Accuracy and reproducibility of a new contrast clearance method for the determination of glomerular filtration rate. BMJ 1986; 293:234-236.
133. O'Reilly PH, Jones DA, Farah NB: Measurement of the plasma clearance of urographic contrast media for the determination of glomerular filtration rate. J Urol 1988; 139:9-11.
134. Lewis R, Kerr N, Van Buren C, et al: Comparative evaluation of urographic contrast media, inulin, and 99mTc-DTPA clearance methods for determination of glomerular filtration rate in clinical transplantation. Transplantation 1989; 48:790-796.
135. Gaspari F, Perico N, Matalone M, et al: Precision of plasma clearance of iohexol for estimation of GFR in patients with renal disease. J Am Soc Nephrol 1998; 9:310-313.
136. Manske CL, Sprafka JM, Strony JT, Wang Y: Contrast nephropathy in azotemic diabetic patients undergoing coronary angiography. Am J Med 1990; 89:615-620.
137. Lundqvist S, Hietala S-O, Berglund C, Karp K: Simultaneous urography and determination of glomerular filtration rate. A comparison of total plasma clearances of iohexol and 51Cr-EDTA in plegic patients. Acta Radiol 1994; 35:391-395.
138. Swan SK, Halstenson CE, Kasiske BL, Collins AJ: Determination of residual renal function with iohexol clearance in hemodialysis patients. Kidney Int 1996; 49:232-235.
139. Turner ST, Reilly SL: Fallacy of indexing renal and systemic hemodynamic measurements for body surface area. Am J Physiol 1995; 268:R978-R988.(Regul Integr Comp Physiol 37)
140. Schmieder RE, Beil AH, Weihprecht H, Messerli FH: How should renal hemodynamic data be indexed in obesity?. J Am Soc Nephrol 1995; 5:1709-1713.
141. Newman EV, Bordley J, Winternitz J: The interrelationships of glomerular filtration rate (mannitol clearance), extracellular fluid volume, surface area of the body, and plasma concentration of mannitol. Johns Hopkins Med J 1944; 75:253-268.
142. Peters AM, Allison H, Ussov WY: Simultaneous measurement of extracellular fluid distribution and renal function with a single injection of 99mTc DTPA. Nephrol Dial Transplant 1995; 10:1829-1833.
143. White AJ, Strydom WJ: Normalisation of glomerular filtration rate measurements. Eur J Nucl Med 1991; 18:385-390.
144. Kasiske BL, Umen AJ: The influence of age, sex, race, and body habitus on kidney weight in humans. Arch Pathol Lab Med 1986; 110:55-60.
145. King AJ, Levey AS: Dietary protein and renal function. J Am Soc Nephrol 1993; 3:1723-1737.
146. van Beek E, Houben AJHM, van Es PN, et al: Peripheral haemodynamics of renal function in relation to the menstrual cycle. Clin Sci 1996; 91:163-168.
147. Zuccalá A, Zucchelli P: Use and misuse of the renal functional reserve concept in clinical nephrology. Nephrol Dial Transplant 1990; 5:410-417.
148. Lautin EM, Freeman NJ, Schoenfeld AH, et al: Radiocontrast-associated renal dysfunction: Incidence and risk factors. AJR Am J Roentgenol 1991; 157:49.
149. D'Elia JA, Gleason RE, Alday M, et al: Nephrotoxicity from angiographic contrast material. Am J Med 1982; 72:719.
150. Walser M, Drew HH, LaFrance ND: Creatinine measurements often yield false estimates of progression in chronic renal failure. Kidney Int 1988; 34:412-418.
151. Kasiske BL, Heim-Duthoy KL, Tortorice KL, Rao KV: The variable nature of chronic declines in renal allograft function. Transplantation 1991; 51:330-334.
152. Jones RH, Molitoris BA: A statistical method for determining the breakpoint of two lines. Anal Biochem 1984; 141:287-290.
153. Wright JP, Salzano S, Brown CB, El Nahas AM: Natural history of chronic renal failure: A reappraisal. Nephrol Dial Transplant 1992; 7:379-383.
154. Viberti GC, Bilous RW, Mackintosh D, Keen H: Monitoring glomerular function in diabetic nephropathy. Am J Med 1983; 74:256-264.
155. Walser M, Drew HH, LaFrance ND: Creatinine measurements often yielded false estimates of progression in chronic renal failure. Kidney Int 1988; 34:412-418.
156. Levey AS, Gassman JJ, Hall PM, Walker WG: Assessing the progression of renal disease in clinical studies: Effects of duration of follow-up and regression to the mean. J Am Soc Nephrol 1991; 1:1087-1094.
157. Shah BV, Levey AS: Spontaneous changes in the rate of decline in reciprocal serum creatinine: Errors in predicting the progression of renal disease from extrapolation of the slope. J Am Soc Nephrol 1992; 2:1186-1191.
158. Dettli L: Drug dosage in renal disease. Clin Pharmacokinet 1983; 1:126-134.
159. Reidenberg MM: Kidney function and drug action. N Engl J Med 1985; 313:816-817.
160. Maderazo EG, Sun H, Jay GT: Simplification of antibiotic dose adjustments in renal insufficiency: the DREM system. Lancet 1992; 340:767-770.
161. Walser M: Progression of chronic renal failure in man. Kidney Int 1990; 37:1195-1210.
162. Levey AS, Greene T, Schluchter MD, et al: Glomerular filtration rate measurements in clinical trials. J Am Soc Nephrol 1993; 4:1159-1171.
163. Rossing P: Doubling of serum creatinine: Is it sensitive and relevant?. Nephrol Dial Transplant 1998; 13:244-246.
164. Murthy K, Stevens LA, Stark PC, Levey AS: Variation in the serum creatinine assay calibration: A practical application to glomerular filtration rate estimation. Kidney Int 2005; 68:1884-1887.
165. Kroenke K, Hanley JF, Copley JB, et al: The admission urinalysis: Impact on patient care. J Gen Intern Med 1986; 1:238-242.
166. Akin BV, Hubbell FA, Frye EB, et al: Efficacy of the routine admission urinalysis. Am J Med 1987; 82:719-722.
167. Mitchell N, Stapleton FB: Routine admission urinalysis examination in pediatric patients: A poor value. Pediatrics 1990; 86:345-349.
168. Schumann GB, Greenberg NF: Usefulness of macroscopic urinalysis as a screening procedure. Am J Clin Pathol 1979; 71:452-456.
169. Is routine urinalysis worthwhile?. Lancet 1988; 1:747.
170. Györy AZ, Hadfield C, Lauer CS: Value of urine microscopy in predicting histological changes in the kidney: Double blind comparison. BMJ 1984; 288:819-822.
171. Morrin PAF: Urinary sediment in the interpretation of proteinuria. Ann Intern Med 1983; 98:254-255.
172. Assadi FK, Fornell L: Estimation of urine specific gravity in neonates with a reagent strip. J Pediatr 1986; 108:995-996.
173. Siegrist D, Hess B, Montandon M, et al: Spezifisches Gewicht des Urins—vergleichende Messungen mit Teststreifen und Refraktometer bei 340 Morgenurinproben. Schweiz Rundsch Med Prax 1993; 82:112-116.
174. Jacobs DS, De Mott WR, Willie GR: Urinalysis and clinical microscopy. In: Jacobs DS, Kasten BL, De Mott WR, Wolfson WL, ed. Laboratory Test Handbook, Baltimore: Williams & Wilkins; 1990:933-934.
175. Adams LJ: Evaluation of Ames MultistixR SG for urine specific gravity versus refractometer specific gravity. Am J Pathol 1983; 80:871-873.
176. Benitez OA, Benitez M, Stijnen T, et al: Inaccuracy of neonatal measurement of urine concentration with a refractometer. J Pediatr 1986; 108:613-616.
177. Gouyon JB, Houchan N: Assessment of urine specific gravity by reagent strip test in newborn infants. Pediatr Nephrol 1993; 7:77-78.
178. Sheets C, Lyman JL: Urinalysis. Emerg Med Clin North Am 1986; 4:263-280.
179. Jung K: Enzyme activities in urine: How should we express their excretion? A critical literature review. Eur J Clin Chem Clin Biochem 1991; 29:725-729.
180. McCormack M, Dessureault J, Guitard M: The urine specific gravity dipstick: A useful tool to increase fluid intake in stone forming patients. J Urol 1991; 146:1475-1477.
181. The U.S. Preventive Services Task Force: Screening for asymptomatic bacteriuria, hematuria and proteinuria. Am Fam Physician 1990; 42:389-395.
182. American Academy of Pediatrics : American Academy of Pediatrics. Recommendations for preventive pediatric health care. Policy Reference Guide: A Comprehensive Guide to AAP Policy statement, Elk Grove Village, IL, AAP, 1993.
183. Kaplan RE, Springate JE, Feld LG: Screening dipstick urinalysis: A time to change. Pediatrics 1997; 100:919-921.
184. Arant Jr BS: Screening for urinary abnormalities: Worth doing and worth doing well. Lancet 1998; 351:307-308.
185. Craver RD, Abermanis JG: Dipstick only urinalysis screen for the pediatric emergency room. Pediatr Nephrol 1997; 11:331-333.
186. Bonnardeaux A, Somerville P, Kaye M: A study on the reliability of dipstick urinalysis. Clin Nephrol 1994; 41:167-172.
187. Goldsmith BM, Campos JM: Comparison of urine dipstick, microscopy, and culture for the detection of bacteriuria in children. Clin Pediatr (Phila) 1990; 29:214-218.
188. Jacobs DS, De Mott WR, Willie GR: Urinalysis and clinical microscopy. In: Jacobs DS, Kasten BL, De Mott WR, Wolfson WL, ed. Laboratory Test Handbook, Baltimore: Williams & Wilkins; 1990:914-915.
189. Jacobs DS, De Mott WR, Willie GR: Urinalysis and clinical microscopy. In: Jacobs DS, Kasten BL, De Mott WR, Wolfson WL, ed. Laboratory Test Handbook, Baltimore: Williams & Wilkins; 1990:919.
190. Ditchburn RK, Ditchburn JS: A study of microscopical and chemical tests for the rapid diagnosis of urinary tract infections in general practice [see comments]. Br J Gen Pract 1990; 40:406-408.
191. McGlone R, Lambert M, Clancy M, Hawkey PM: Use of Ames SG10 Urine Dipstick for diagnosis of abdominal pain in the accident and emergency department. Arch Emerg Med 1990; 7:42-47.
192. Liptak GS, Campbell J, Stewart R, Hulbert Jr WC: Screening for urinary tract infection in children with neurogenic bladders. Am J Phys Med Rehabil 1993; 72:122-126.
193. Lohr JA, Portilla MG, Geuder TG, et al: Making a presumptive diagnosis of urinary tract infection by using a urinalysis performed in an on-site laboratory. J Pediatr 1993; 122:22-25.
194. McNagny SE, Parker RM, Zenilman JM, Lewis JS: Urinary leukocyte esterase test: A screening method for the detection of asymptomatic chlamydial and gonococcal infections in men. J Infect Dis 1992; 165:573-576.
195. Blum RN, Wright RA: Detection of pyuria and bacteriuria in symptomatic ambulatory women. J Gen Intern Med 1992; 7:140-144.
196. Hurlbut III TA, Littenberg B: The diagnostic accuracy of rapid dipstick tests to predict urinary tract infection. Am J Clin Pathol 1991; 96:582-588.
197. Jacobs DS, De Mott WR, Willie GR: Urinalysis and clinical microscopy. In: Jacobs DS, Kasten BL, De Mott WR, Wolfson WL, ed. Laboratory Test Handbook, Baltimore: Williams & Wilkins; 1990:906-909.
198. Brigden ML, Edgell D, McPherson M, et al: High incidence of significant urinary ascorbic acid concentrations in a west coast population—Implications for routine urinalysis. Clin Chem 1992; 38:426-431.
199. Singer DE, Coley CM, Samet JH, Nathan DM: Tests of glycemia in diabetes mellitus: Their use in establishing a diagnosis and in treatment. Ann Intern Med 1989; 110:125-137.
200. Jacobs DS, De Mott WR, Willie GR: Urinalysis and clinical microscopy. In: Jacobs DS, Kasten BL, De Mott WR, Wolfson WL, ed. Laboratory Test Handbook, Baltimore: Williams & Wilkins; 1990:912.
201. Shihabi ZK, Konen JC, O'Connor ML: Albuminuria vs urinary total protein for detecting chronic renal disorders. Clin Chem 1991; 37:621-624.
202. Hession C, Decker JM, Sherblom AP, et al: Uromodulin (Tamm-Horsfall glycoprotein): A renal ligand for lymphokines. Science 1987; 237:1479-1484.
203. Pennica D, Kohr WJ, Kuang W-J, et al: Identification of human uromodulin as the Tamm-Horsfall urinary glycoprotein. Science 1987; 236:83-88.
204. Allen JK, Krauss EA, Deeter RG: Dipstick analysis of urinary protein. A comparison of Chemstrip-9 and Multistix-10SG. Arch Pathol Lab Med 1991; 115:34-37.
205. Rowe DJF, Dawnay A, Watts GF: Microalbuminuria in diabetes mellitus: Review and recommendations for the measurement of albumin in urine. Ann Clin Biochem 1990; 27:297-312.
206. Harmoinen A, Vuorinen P, Jokela H: Turbidimetric measurement of microalbuminuria. Clin Chim Acta 1987; 166:85-89.
207. Stamp RJ: Measurement of albumin in urine by end-point immunonephelometry. Ann Clin Biochem 1988; 25:442-443.
208. Neuman RG, Cohen MP: Improved competitive enzyme-linked immunoassay (ELISA) for albuminuria. Clin Chim Acta 1989; 179:229-238.
209. Comper WD, Osicka TM, Jerums G: High prevalence of immuno-unreactive intact albumin in urine of diabetic patients. Am J Kidney Dis 2003; 41:336-342.
210. Tiu SC, Lee SS, Cheng MW: Comparison of six commerical techniques in the measurement of microalbuminuria in diabetic patients. Diabetes Care 1993; 16:616-620.
211. Comper WD, Jerums G, Osicka TM: Differences in urinary albumin detected by four immunoassays and high-performance liquid chromatography. Clin Biochem 2004; 37:105-111.
212. Giampietro O, Penno G, Clerico A, et al: Which method for quantifying “microalbuminuria” in diabetics? Comparison of several immunological methods (immunoturbidimetric assay, immunonephelometric assay, radioimmunoassay and two semiquantitative tests) for measurement of albumin in urine. Acta Diabetol 1992; 28:239-245.
213. Ballantyne FC, Gibbons J, O'Reilly DS: Urine albumin should replace total protein for the assessment of glomerular proteinuria. Ann Clin Biochem 1993; 30(pt 1):101-103.
214. Sawicki PT, Heinemann L, Berger M: Comparison of methods for determination of microalbuminuria in diabetic patients. Diabet Med 1989; 6:412-415.
215. Tai J, Tze WJ: Evaluation of Micro-Bumintest reagent tablets for screening of microalbuminuria. Diabetes Res Clin Pract 1990; 9:137-142.
216. Bangstad HJ, Try K, Dahl-Jørgensen K, Hanssen KF: New semiquantitative dipstick test for microalbuminuria. Diabetes Care 1991; 14:1094-1097.
217. Marshall SM, Schearing PA, Alberti KG: Micral-test strips evaluated for screening for albuminuria. Clin Chem 1992; 38:588-591.
218. Poulsen PL, Hansen B, Amby T, et al: Evaluation of a dipstick test for microalbuminuria in three different clinical settings, including the correlation with urinary albumin excretion rate. Diabetes Metab 1992; 18:395-400.
219. Schaufelberger H, Caduff F, Engler H, Spinas GA: Evaluation eines Streifentests (Micral-TestR) zur semiquantitativen Erfassung der mikroalbinurie in der praxis. Schweiz Med Wochenschr 1992; 122:576-581.
220. Schwab SJ, Dunn FL, Feinglos MN: Screening for microalbuminuria. Diabetes Care 1992; 15:1581-1584.
221. Mogensen CE, Viberti GC, Peheim E, et al: Multicenter evaluation of the Micral-Test II test strip, an immunologic rapid test for the detection of microalbuminuria. Diabetes Care 1997; 20:1642-1646.
222. Minetti EE, Cozzi MG, Granata S, Guidi E: Accuracy of the urinary albumin titrator stick “Micral-Test” in kidney-disease patients. Nephrol Dial Transplant 1997; 12:78-80.
223. Molitch ME, Defronzo RA, Franz MJ, et al: Nephropathy in diabetes. Diabetes Care 2004; 27(suppl 1):S79-S83.
224. Gross JL, de Azevedo MJ, Silveiro SP, et al: Diabetic nephropathy: Diagnosis, prevention, and treatment. Diabetes Care 2005; 28:164-176.
225. Schwab SJ, Christensen L, Dougherty K, Klahr S: Quantitation of proteinuria by the use of protein-to-creatinine ratios in single urine samples. Arch Intern Med 1987; 147:943-944.
226. Gatling W, Knight C, Hill RD: Screening for early diabetic nephropathy: Which sample to detect microalbuminuria?. Diabet Med 1985; 2:451-455.
227. Marshall SM, Alberti KGMM: Screening for early diabetic nephropathy. Ann Clin Biochem 1986; 23:195-197.
228. Cohen DL, Close CF, Viberti GC: The variability of overnight urinary albumin excretion in insulin-dependent diabetic and normal subjects. Diabet Med 1987; 4:437-440.
229. Hutchison AS, O'Reilly DStJ, MacCuish AC: Albumin excretion rate, albumin concentration, and albumin creatinine ratio compared for screening diabetics for slight albuminuria. Clin Chem 1988; 34:2019-2021.
230. Sessoms S, Mehta K, Kovarsky J: Quantitation of proteinuria in systemic lupus erythematosus by use of a random, spot urine collection. Arthritis Rheum 1983; 26:918-920.
231. Ruggenenti P, Gaspari F, Perna A, Remuzzi G: Cross-sectional longitudinal study of spot morning urine protein:creatinine ratio, 24-hour urine protein excretion rate, glomerular filtration rate, and end-stage renal failure in chronic renal disease in patients without diabetes. BMJ 1998; 316:504-509.
232. Torng S, Rigatto C, Rush DN, et al: The urine protein to creatinine ratio (P/C) as a predictor of 24-hour urine protein excretion in renal transplant patients. Transplantation 2001; 72:1453-1456.
233. Ramos JG, Martins-Costa SH, Mathias MM, et al: Urinary protein/creatinine ratio in hypertensive pregnant women. Hypertens Pregnancy 1999; 18:209-218.
234. Rodriguez-Thompson D, Lieberman ES: Use of a random urinary protein-to-creatinine ratio for the diagnosis of significant proteinuria during pregnancy. Am J Obstet Gynecol 2001; 185:808-811.
235. Neithardt AB, Dooley SL, Borensztajn J: Prediction of 24-hour protein excretion in pregnancy with a single voided urine protein-to-creatinine ratio. Am J Obstet Gynecol 2002; 186:883-886.
236. Durnwald C, Mercer B: A prospective comparison of total protein/creatinine ratio versus 24-hour urine protein in women with suspected preeclampsia. Am J Obstet Gynecol 2003; 189:848-852.
237. Al RA, Baykal C, Karacay O, et al: Random urine protein-creatinine ratio to predict proteinuria in new-onset mild hypertension in late pregnancy. Obstet Gynecol 2004; 104:367-371.
238. Zuppi C, Baroni S, Scribano D, et al: Choice of time for urine collection for detecting early kidney abnormalities in hypertensives. Ann Clin Biochem 1995; 32:373-378.
239. Hara F, Nakazato K, Shiba K, et al: Studies of diabetic nephropathy. I. Effects of storage time and temperature on microalbuminuria. Biol Pharm Bull 1994; 17:1241-1245.
240. Watts GF, Pillay D: Effect of ketones and glucose on the estimation of urinary creatinine: Implications for microalbuminuria screening. Diabet Med 1990; 7:263-265.
241. Weber MH: Urinary protein analysis. J Chromatogr 1988; 429:315-344.
242. Vidal BC, Bonventre JV, Hong HS: Towards the application of proteomics in renal disease diagnosis. Clin Sci (Lond) 2005; 109:421-430.
243. Thongboonkerd V, Malasit P: Renal and urinary proteomics: Current applications and challenges. Proteomics 2005; 5:1033-1042.
244. Viberti GC, Jarrett RJ, Mahmud U, et al: Microalbuminuria as a predictor of clinical nephropathy in insulin-dependent diabetes mellitus. Lancet 1982; 1:1430-1431.
245. Messent JWC, Elliott TG, Hill RD, et al: Prognostic significance of microalbuminuria in insulin-dependent diabetes mellitus: A twenty-three year follow-up study. Kidney Int 1992; 41:836-839.
246. Mogensen CE: Microalbuminuria predicts clinical proteinuria and early mortality in maturity-onset diabetes. N Engl J Med 1984; 310:356-360.
247. Jarrett RJ, Viberti CG, Argyropoulos A, et al: Microalbuminuria predicts mortality in non-insulin-dependent diabetes. Diabet Med 1984; 1:17-19.
248. Mogensen CE, Christensen CK: Predicting diabetic nephropathy in insulin-dependent patients. N Engl J Med 1984; 311:89-93.
249. Mattock MB, Morrish NJ, Viberti G, et al: Prospective study of microalbuminuria as predictor of mortality in NIDDM. Diabetes 1992; 41:736-741.
250. Borch-Johnsen K, Wenzel H, Viberti GC, Mogensen CE: Is screening and intervention for microalbuminuria worthwhile in patients with insulin dependent diabetes?. Br Med J 1993; 306:1722-1725.
251. Mattix HJ, Hsu CY, Shaykevich S, Curhan G: Use of the albumin/creatinine ratio to detect microalbuminuria: Implications of sex and race. J Am Soc Nephrol 2002; 13:1034-1039.
252. Nelson RG, Knowler WC, Pettitt DJ, et al: Assessment of risk of overt nephropathy in diabetic patients from albumin excretion in untimed urine specimens. Arch Intern Med 1991; 151:1761-1765.
253. Caramori ML, Fioretto P, Mauer M: Low glomerular filtration rate in normoalbuminuric type 1 diabetic patients: An indicator of more advanced glomerular lesions. Diabetes 2003; 52:1036-1040.
254. MacIsaac RJ, Tsalamandris C, Panagiotopoulos S, et al: Nonalbuminuric renal insufficiency in type 2 diabetes. Diabetes Care 2004; 27:195-200.
255. Boulware LE, Jaar BG, Tarver-Carr ME, et al: Screening for proteinuria in US adults: A cost-effectiveness analysis. JAMA 2003; 290:3101-3114.
256. Robinson RR: Nephrology Forum: Isolated proteinuria in asymptomatic patients. Kidney Int 1980; 18:395-406.
257. Robinson RR: Isolated proteinuria. Contrib Nephrol 1981; 24:53-62.
258. von Bonsdorff M, Koskenvuo K, Salmi HA, Pasternack A: Prevalence and causes of proteinuria in 20-year-old Finnish men. Scand J Urol Nephrol 1981; 15:285-290.
259. Springberg PD, Garrett Jr LE, Thompson Jr AL, et al: Fixed and reproducible orthostatic proteinuria: Results of a 20-year follow-up. Ann Intern Med 1982; 97:516-519.
260. Rytand DA, Spreiter S: Prognosis in postural (orthostatic) proteinuria. N Engl J Med 1981; 305:618-621.
261. Houser MT: Characterization of recumbent, ambulatory, and postexercise proteinuria in the adolescent. Pediatr Res 1987; 21:442-446.
262. Schardijn GHC, Statius van Eps LW: β2-Microglobulin: Its significance in the evaluation of renal function. Kidney Int 1987; 32:635-641.
263. Schentag JJ, Sutfin TA, Plaut ME, Jusko WJ: Early detection of aminoglycoside nephrotoxicity with urinary B-2 microglobulin. J Med 1978; 9:201-210.
264. Hall III PW, Dammin GJ: Balkan nephropathy. Nephron 1978; 22:281-300.
265. Taniguchi N, Tanaka M, Kishihara C, et al: Determination of carbonic anhydrase C and β2-microglobulin by radioimmunoassay in urine of heavy-metal-exposed subjects and patients with renal tubular acidosis. Environ Res 1979; 20:154-161.
266. Roxe DM, Siddiqui F, Santhanam S, et al: Rationale and application of beta-2-microglobulin measurements to detect acute transplant rejection. Nephron 1981; 27:260-264.
267. Statius van Eps LW, Schardijn GHC: Value of determination of B2-microglobulin in toxic nephropathy and interstitial nephritis. Klin Wochenschr 1984; 18:673-678.
268. Bäckman L, Ringdén O, Björkhem I, Lindbäck B: Increased serum β2-microglobulin during rejection, cyclosporine-induced nephrotoxicity and cytomegalovirus infection in renal transplant recipients. Transplantation 1986; 42:368-371.
269. Schardijn GHC, Statius van Eps LW, Pauw W, et al: Comparison of reliability of tests to distinguish upper from lower urinary tract infections. BMJ 1984; 289:284-287.
270. Buxbaum JN, Chuba JV, Hellman GC, et al: Monoclonal immunoglobulin deposition disease: Light chain and light and heavy chain deposition diseases and their relation to light chain amyloidosis. Ann Intern Med 1990; 112:455-464.
271. Hunt LP, Short CD, Mallick NP: Prognostic indicators in patients presenting with the nephrotic syndrome. Kidney Int 1988; 34:382-388.
272. Williams PS, Fass G, Bone JM: Renal pathology and proteinuria determine progression in untreated mild/moderate chronic renal failure. Q J Med 1988; 67:343-354.
273. Neelakantappa K, Gallo GAR, Baldwin DS: proteinuria in IgA nephropathy. Kidney Int 1988; 33:716-721.
274. Alamartine E, Sabatier J-C, Guerin C, et al: Prognostic factors in mesangial IgA glomerulonephritis: An extensive study with univariate and multivariate analyses. Am J Kidney Dis 1991; 18:12-19.
275. D'Amico G: Influence of clinical and histological features on actuarial renal survival in adult patients with idiopathic IgA nephropathy, membranous nephropathy, and membranoproliferative glomerulonephritis: Survey of the recent literature. Am J Kidney Dis 1992; 20:315-323.
276. Donadio Jr JV, Torres VE, Velosa JA, et al: Idiopathic membranous nephropathy: The natural history of untreated patients. Kidney Int 1988; 33:708-715.
277. Cattran DC, Pei Y, Greenwood C: Predicting progression in membranous glomerulonephritis. Nephrol Dial Transplant Suppl 1992; 1:48-52.
278. Brahm M, Brammer M, Balsløv JT, et al: Prognosis in glomerulonephritis. III. A longitudinal analysis of changes in serum creatinine and proteinuria during the course of disease: Effect of immunosuppressive treatment. Report from Copenhagen Study Group of Renal Diseases. J Intern Med 1992; 231:339-347.
279. Ritchie CD, Bevan EA, Collier SJ: Importance of occult haematuria found at screening. BMJ 1986; 292:681-683.
280. Thompson IM: The evaluation of microscopic hematuria: A population-based study. J Urol 1987; 138:1189-1190.
281. Messing EM, Vaillancourt A: Hematuria screening for bladder cancer. J Occup Med 1990; 32:838-845.
282. Lieu TA, Grasmeder III HM, Kaplan BS: An approach to the evaluation and treatment of microscopic hematuria. Pediatr Clin North Am 1991; 38:579-592.
283. Fairley KF, Birch DF: Hematuria: A simple method for identifying glomerular bleeding. Kidney Int 1982; 21:105-108.
284. Fassett RG, Horgan BA, Mathew TH: Detection of glomerular bleeding by phase-contrast microscopy. Lancet 1982; 1:1432-1434.
285. Van Iseghem PH, Hauglastaine D, Bollens W, Michielsen P: Urinary erythrocyte morphology in acute glomerulonephritis. BMJ 1983; 287:1183.
286. Shichiri M, Nishio Y, Suenaga M, et al: Red-cell volume distribution curves in diagnosis of glomerular and non-glomerular haematuria. Lancet 1988; 1:908-911.
287. Goldwasser P, Antignani A, Mittman N, et al: Urinary red cell size: Diagnostic value and determinants. Am J Nephrol 1990; 10:148-156.
288. Schramek P, Moritsch A, Haschkowitz H, et al: In vitro generation of dysmorphic erythrocytes. Kidney Int 1989; 36:72-77.
289. Thal SM, DeBellis CC, Iverson SA, Schumann GB: Comparison of dysmorphic erythrocytes with other urinary sediment parameters of renal bleeding. Am J Clin Pathol 1986; 86:784-787.
290. Raman GV, Pead L, Lee HA, Maskell R: A blind controlled trial of phase-contrast microscopy by two observers for evaluating the source of hematuria. Nephron 1986; 44:304-308.
291. Sayer J, McCarthy MP, Schmidt JD: Identification and significance of dysmorphic versus isomorphic hematuria. J Urol 1990; 143:545-548.
292. Marcussen N, Schumann JL, Schumann GB, et al: Analysis of cytodiagnostic urinalysis findings in 77 patients with concurrent renal biopsies. Am J Kidney Dis 1992; 20:618-628.
293. Dinda AK, Saxena S, Guleria S, et al: Diagnosis of glomerular haematuria: Role of dysmorphic red cell, G1 cell and bright-field microscopy. Scand J Clin Lab Invest 1997; 57:203-208.
294. Lettgen B, Hestermann C, Rascher W: Differentiation of glomerular and non-glomerular hematuria in children by measurement of mean corpuscular volume of urinary red cells using a semi-automated cell counter. Acta Paediatr 1994; 83:946-949.
295. Apeland T: Flow cytometry of urinary erythrocytes for evaluating the source of haematuria. Scand J Urol Nephrol 1995; 29:33-37.
296. Hyodo T, Kumano K, Haga M, et al: Analysis of urinary red blood cells of healthy individuals by an automated urinary flow cytometer. Nephron 1997; 75:451-457.
297. Offringa M, Benbassat J: The value of urinary red cell shape in the diagnosis of glomerular and post-glomerular haematuria. A meta-analysis. Postgrad Med J 1992; 68:648-654.
298. Shaper KR, Jackson JE, Williams G: The nutcracker syndrome: An uncommon cause of haematuria. Br J Urol 1994; 74:144-146.
299. Fogazzi GB, Leong SO, Cameron JS: Don't forget sickled cells in the urine when investigating a patient for haematuria. Nephrol Dial Transplant 1996; 11:723-725.
300. Tanaka H, Kim S-T, Takasugi M, Kuroiwa A: Isolated hematuria in adults: IgA nephropathy is a predominant cause of hematuria compared with thin glomerular basement membrane nephropathy. Am J Nephrol 1996; 16:412-416.
301. Sobh MA, Moustafa FE, el-Din Saleh MA, et al: Study of asymptomatic microscopic hematuria in potential living related kidney donors. Nephron 1993; 65:190-195.
302. Jacobs DS, De Mott WR, Willie GR: Urinalysis and clinical microscopy. In: Jacobs DS, Kasten BL, De Mott WR, Wolfson WL, ed. Laboratory Test Handbook, Baltimore: Williams & Wilkins; 1990:903-904.
303. Corwin HL, Bray RA, Haber MH: The detection and interpretation of urinary eosinophils. Arch Pathol Lab Med 1989; 113:1256-1258.
304. Corwin HL, Korbet SM, Schwartz MM: Clinical correlates of eosinophiluria. Arch Intern Med 1985; 145:1097-1099.
305. Yu D, Petermann A, Kunter U, et al: Urinary podocyte loss is a more specific marker of ongoing glomerular damage than proteinuria. J Am Soc Nephrol 2005; 16:1733-1741.
306. Jacobs DS, De Mott WR, Willie GR: Urinalysis and clinical microscopy. In: Jacobs DS, Kasten BL, De Mott WR, Wolfson WL, ed. Laboratory Test Handbook, Baltimore: Williams & Wilkins; 1990:938.
307. Arenson AM: Ultrasound guided percutaneous renal biopsy. Australas Radiol 1991; 35:38-39.
308. Grimm PC, Nickerson P, Gough J, et al: Computerized image analysis of Sirius Red-stained renal allograft biopsies as a surrogate marker to predict long-term allograft function. J Am Soc Nephrol 2003; 14:1662-1668.
309. Marcussen N, Olsen S, Larsen S, et al: Reproducibility of the WHO classification of glomerulonephritis. Clin Nephrol 1995; 44:220-224.
310. Wernick RM, Smith DL, Houghton DC, et al: Reliability of histologic scoring for lupus nephritis: A community-based evaluation. Ann Intern Med 1993; 119:805-811.
311. Paone DB, Meyer LE: The effect of biopsy on therapy in renal disease. Arch Intern Med 1981; 141:1039-1041.
312. Cohen AH, Nast CC, Adler SG, Kopple JD: The clinical usefulness of kidney biopsies in the diagnosis and management of renal disease. Kidney Int 1985; 27:135.
313. Turner MW, Hutchinson TA, Barré PE, et al: A prospective study on the impact of the renal biopsy in clinical management. Clin Nephrol 1986; 26:217-221.
314. Shah RP, Vathsala A, Chiang GS, et al: The impact of percutaneous renal biopsies on clinical management. Ann Acad Med Singapore 1993; 22:908-911.
315. Richards NT, Darby S, Howie AJ, et al: Knowledge of renal histology alters patient management in over 40% of cases. Nephrol Dial Transplant 1994; 9:1255-1259.
316. Whiting-O'Keefe Q, Riccardi PJ, Henke JE, et al: Recognition of information in renal biopsies of patients with lupus nephritis. Ann Intern Med 1982; 96(pt 1):723-727.
317. Primack WA, Schulman SL, Kaplan BS: An analysis of the approach to management of childhood nephrotic syndrome by pediatric nephrologists. Am J Kidney Dis 1994; 23:524.
318. Adu D: The nephrotic syndrome: Does renal biopsy affect management?. Nephrol Dial Transplant 1996; 11:12-14.
319. Levey AS, Lau J, Pauker SG, Kassirer JP: Idiopathic nephrotic syndrome: Puncturing the biopsy myth. Ann Intern Med 1987; 107:697-713.
320. Tomura S, Tsutani K, Sakuma A, Takeuchi J: Discriminant analysis in renal histological diagnosis of primary glomerular diseases. Clin Nephrol 1985; 23:55-62.
321. Ganeval D, Noel L-H, Preud'homme J-L, et al: Light-chain deposition disease: Its relation with AL-type amyloidosis. Kidney Int 1984; 26:1.
322. Schwartz MM, Lan SP, Bonsib SM, et al: Clinical outcome of 3 discrete glomerular lesions in severe lupus glomerulonephritis. The Lupus Nephritis Collaborative Study Group. Am J Kidney Dis 1989; 13:273-283.
323. Fries JF, Porta J, Liang MH: Marginal benefit of renal biopsy in systemic lupus erythematosus. Arch Intern Med 1978; 138:1386.
324. Whiting-O'Keefe Q, Henke JE, Shearn MA, et al: The information content from renal biopsy in systemic lupus erhythematosus. Ann Intern Med 1982; 96(pt 1):718-723.
325. Schwartz MM, Bernstein J, Hill GSLupus Nephritis Collaborative Study Group, et al: Predictive value of renal pathology in diffuse proliferative lupus glomerulonephritis. Kidney Int 1989; 36:891-896.
326. Schwartz MM, Lan SP, Bernstein J, et al: Role of pathology indices in the management of severe lupus glomerulonephritis. Lupus Nephritis Collaborative Study Group. Kidney Int 1992; 42:743-748.
327. Chagnac A, Kiberd BA, Farinas MC, et al: Outcome of acute glomerular injury in proliferative lupus nephritis. J Clin Invest 1989; 84:922-930.
328. Schwartz MM, Korbet SM: Crescentic glomerulonephritis. Prog Reprod Urinary Tract Pathol 1989; 1:163.
329. Falk RJ: ANCA-associated renal disease. Kidney Int 1990; 38:998.
330. Nankivell BJ, Borrows RJ, Fung CL, et al: The natural history of chronic allograft nephropathy. N Engl J Med 2003; 349:2326-2333.
331. Gray DWR, Richardson A, Hughes D, et al: A prospective, randomized, blind comparison of three biopsy techniques in the management of patients after renal transplantation. Transplantation 1992; 53:1226-1232.
332. Racusen LC, Colvin RB, Solez K, et al: Antibody-mediated rejection criteria—An addition to the Banff 97 classification of renal allograft rejection. Am J Transplant 2003; 3:708-714.
333. Solez K, Hansen HE, Kornerup HJ, et al: Clinical validation and reproducibility of the Banff schema for renal allograft pathology. Transplant Proc 1995; 27:1009-1011.
334. Wang HJ, Kjellstrand CM, Cockfield SM, Solez K: On the influence of sample size on the prognostic accuracy and reproducibility of renal transplant biopsy. Nephrol Dial Transplant 1998; 13:165-172.
335. Kolb LG, Velosa JA, Bergstralh EJ, Offord KP: Percutaneous renal allograft biopsy. A comparison of two needle types and analysis of risk factors. Transplantation 1994; 57:1742-1746.
336. Riehl J, Maigatter S, Kierdorf H, et al: Percutaneous renal biopsy: Comparison of manual and automated puncture techniques with native and transplanted kidneys. Nephrol Dial Transplant 1994; 9:1568-1574.
337. Diaz Encarnacion MM, Griffin MD, Slezak JM, et al: Correlation of quantitative digital image analysis with the glomerular filtration rate in chronic allograft nephropathy. Am J Transplant 2004; 4:248-256.
338. Sinniah R, Law CH, Pwee HS: Glomerular lesions in patients with asymptomatic persistent and orthostatic proteinuria discovered on routine medical examination. Clin Nephrol 1977; 7:1-14.
339. Sinniah R, Pwee HS, Lim CM: Glomerular lesions in asymptomatic microscopic hematuria discovered on routine medical examination. Clin Nephrol 1976; 5:216-228.
340. Copley JB, Hasbargen JA: Idiopathic hematuria: A prospective evaluation. Arch Intern Med 1987; 147:434-437.
341. Nomoto Y, Endoh M, Suga T, et al: Minimum requirements for renal biopsy size for patients with IgA nephropathy. Nephron 1992; 60:171-175.
342. Wickre CG, Golper TA: Complications of percutaneous needle biopsy of the kidney. Am J Nephrol 1982; 2:173-178.
343. Mendelssohn DC, Cole EH: Outcomes of percutaneous kidney biopsy, including those of solitary native kidneys. Am J Kidney Dis 1995; 26:580-585.
344. Shemin D, Elnour M, Amarantes B, et al: Oral estrogens decrease bleeding time and improve clinical bleeding in patients with renal failure. Am J Med 1990; 89:436-440.
345. Korbet SM: Percutaneous renal biopsy. Semin Nephrol 2002; 22:254-267.
346. Kearon C, Hirsh J: Management of anticoagulation before and after elective surgery. N Engl J Med 1997; 336:1506-1511.
347. Stiles KP, Yuan CM, Chung EM, et al: Renal biopsy in high-risk patients with medical diseases of the kidney. Am J Kidney Dis 2000; 36:419-433.
348. Abbott KC, Musio FM, Chung EM, et al: Transjugular renal biopsy in high-risk patients: An American case series. BMC Nephrol 2002; 3:5.
349. Christensen J, Lindequist S, Knudsen DU, Pedersen RS: Ultrasound-guided renal biopsy with biopsy gun technique—Efficacy and complications. Acta Radiol 1995; 36:276-279.
350. Doyle AJ, Gregory MC, Terreros DA: Percutaneous native renal biopsy: Comparison of a 1.2-mm spring-driven system with a traditional 2-mm hand-driven system. Am J Kidney Dis 1994; 23:498-503.
351. Voss DM, Lynn KL: Percutaneous renal biopsy: An audit of a 2-year experience with the Biopty gun. N Z Med J 1995; 108:8-10.
352. Fraser IR, Fairley CK: Renal biopsy as an outpatient procedure. Am J Kidney Dis 1995; 25:876-878.
353. Kudryk BT, Martinez CR, Gunasekeran S, Ramirez G: CT-guided renal biopsy using a coaxial technique and an automated biopsy gun. South Med J 1995; 88:543-546.
354. Lee SM, King J, Spargo BH: Efficacy of percutaneous renal biopsy in obese patients under computerized tomographic guidance. Clin Nephrol 1991; 35:123-129.
355. Burstein DM, Schwartz MM, Korbet SM: Percutaneous renal biopsy with the use of real-time ultrasound. Am J Nephrol 1991; 11:195-200.
356. Burstein DM, Korbet SM, Schwartz MM: The use of the automatic core biopsy system in percutaneous renal biopsies: A comparative study. Am J Kidney Dis 1993; 22:545-552.
357. Kim D, Kim H, Shin G, et al: A randomized, prospective, comparative study of manual and automated renal biopsies. Am J Kidney Dis 1998; 32:426-431.
358. Nicholson ML, Wheatley TJ, Doughman TM, et al: A prospective randomized trial of three different sizes of core-cutting needle for renal transplant biopsy. Kidney Int 2000; 58:390-395.
359. Mauiyyedi S, Crespo M, Collins AB, et al: Acute humoral rejection in kidney transplantation: II. Morphology, immunopathology, and pathologic classification. J Am Soc Nephrol 2002; 13:779-787.
360. Haas M: A reevaluation of routine electron microscopy in the examination of native renal biopsies. J Am Soc Nephrol 1997; 8:70-76.
361. Parrish AE: Complications of percutaneous renal biopsy: A review of 37 years' experience. Clin Nephrol 1992; 38:135-141.
362. Manno C, Strippoli GF, Arnesano L, et al: Predictors of bleeding complications in percutaneous ultrasound-guided renal biopsy. Kidney Int 2004; 66:1570-1577.
363. Ginsburg JC, Fransman SL, Singer MA, et al: Use of computerized tomography (CT) to evaluate bleeding after renal biopsy. Nephron 1980; 26:240.
364. Alter AJ, Zimmerman S, Kirachaiwanich C: Computerized tomographic assessment of retroperitoneal hemorrhage after percutaneous renal biopsy. Arch Intern Med 1980; 140:1323.
365. McCune TR, Stone WJ, Breyer JA: Page kidney: Case report and review of the literature. Am J Kidney Dis 1991; 18:593-599.
366. Kouri TT, Viikari JSA, Mattila KS, Irjala KMA: Invalidity of simple concentration-based screening tests for early nephropathy due to urinary volumes of diabetic patients. Diabetes Care 1991; 14:591-593.