DRUG CONCENTRATIONS
When planning drug therapy for a patient, deciding on the choice of drug and its dosing schedule is obviously critical. To make such decisions, an observable pharmacological effect is usually selected, and the dosing rate is manipulated until this effect is observed. This approach works quite well with some drugs. For example, blood pressure can be monitored in a hypertensive patient (Fig. 3-1, Drug A) and the dose of drug modified until blood pressure is reduced to the desired level. However, for other drugs this approach is more problematic, usually because of the lack of an easily observable effect, a narrowTI (ratio of therapeutic to toxic dose), or changes in the condition of the patient that require modification of dosing rate.
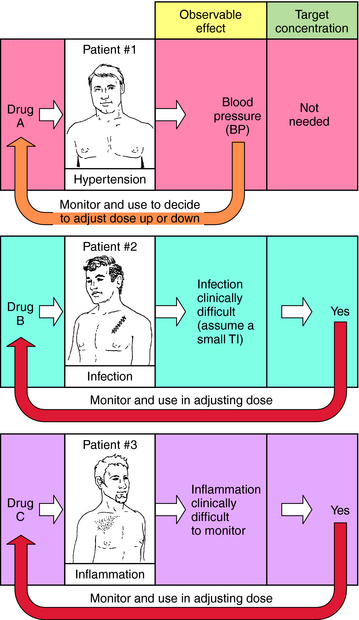
FIGURE 3–1 Concept of target plasma concentration of drug as an alternative to observable effect for determining whether drug input rate is sufficient or must be modified. For a discussion of target concentration, see the text.
For example, when an antibiotic with a low TI is used to treat a severe infection (Fig. 3-1, Drug B), it can be difficult to quantify therapeutic progress, because a visible effect is not apparent immediately. Because of its narrow TI, care must be taken to ensure that the drug concentration does not become too high and cause toxicity. Similarly, if the desired effect is not easily visualized because of other considerations, such as inflammation in an internal organ, this approach is also problematic (Fig. 3-1, Drug C). Finally, changes in the condition of the patient can also necessitate adjustments in dose rates. For example, if a drug is eliminated through the kidneys, changes in renal function will be important. Without an observable effect that is easily monitored (as with drugs B and C), it is not always clear that such adjustments are beneficial.
An alternative approach is to define a target drug concentration in blood, rather than an observable effect. The plasma concentration of a drug is usually chosen for simplicity and can be very useful in achieving therapeutic responses while minimizing undesirable side effects. This chapter will concentrate on factors controlling drug plasma concentration, how it changes with different routes and schedules of drug administration, and how drug input rates and dosing schedules can be rationally developed, or modified, to achieve plasma concentrations associated with beneficial therapeutic effects.
In most clinical situations, it is important to maintain an appropriate response for prolonged periods. This requires maintaining plasma concentration of drug over a specified time interval. Multiple doses or continuous administration is usually required, with dose size and frequency of administration constituting the dosing schedule or dosing regimen. In providing instructions for treatment of a patient, the choice of drug, the dosing
|
Abbreviations |
|
|
AUC |
Area under the drug plasma concentration–time curve |
|
Css |
Steady-state concentration of drug |
|
C(t) |
Concentration of drug in plasma at any time “t” |
|
CL |
Clearance |
|
CLp |
Plasma clearance |
|
E |
Hepatic extraction ratio |
|
F |
Bioavailability |
|
GI |
Gastrointestinal |
|
IA |
Intraarterial |
|
IM |
Intramuscular |
|
IV |
Intravenous |
|
Q |
Hepatic blood flow |
|
SC |
Subcutaneous |
|
t1/2 |
Half-life |
|
T |
Dosing interval |
|
TI |
Therapeutic index |
|
Vd |
Apparent volume of distribution |
schedule, and the mode and route of administration must be specified. Pharmacokinetic considerations have a major role in establishing the dosing schedule, or in adjusting an existing schedule, to increase effectiveness of the drug or to reduce symptoms of toxicity.
Before addressing how to design or adjust a dosing schedule, several key pharmacokinetic parameters and principles must be described. For clarity, a single acute dose of drug is presented here and used in a later part of this chapter for the design or modification of multiple dosing regimens. The relevant pharmacokinetic concepts and parameters can be developed either intuitively or mathematically and used in the rational design of dosing schedules. The emphasis in this chapter is to combine both approaches to stress general principles and parameters and provide sufficient background for understanding their general importance.
ROUTES OF ADMINISTRATION
Major routes of administration are divided into (1) enteral, drugs entering the body via the gastrointestinal (GI) tract, and (2) parenteral, drugs entering the body by injection. Specific examples are given in Box 3-1. The oral route is most popular because it is most convenient. However, poor absorption in the GI tract, first-pass metabolism in the liver, delays in stomach emptying, degradation by stomach acidity, or complexation with food may preclude oral administration. Intramuscular (IM), subcutaneous (SC), and topical routes bypass these problems. In many cases absorption into the blood is rapid for drugs given IM and only slightly slower after SC administration. The advantage of the intravenous (IV) route is a very rapid onset of action and a controlled rate of administration; however, this is countered by the disadvantages of possible infection, coagulation problems, and a greater incidence of allergic reactions. Also, most injected drugs, especially when given IV, require trained personnel.
BOX 3–1 Main Routes of Drug Administration
Per os (by mouth)
Oral (swallowed)
Sublingual (under the tongue)
Buccal (in the cheek pouch)
Injection
IV
IM
SC
IA
Intrathecal (into subarachnoid space)
Pulmonary
Rectal
Topical
Transdermal patch
Crème
DOSE ADJUSTMENT FOR SIZE OF PATIENT
The average male adult weighs approximately 70 kg and has a body surface area of 1.7 m2. The dose of drug is sometimes scaled to give a constant mg/kg body weight for persons of different sizes. For some drugs, especially with children, such scaling works better when based on body surface area, because this correlates better with cardiac output and glomerular filtration rate. Body weight is favored by most clinicians because it is easily measured. Because therapeutic plasma concentrations of many drugs can cover a considerable range without evidence of toxicity, significant dose adjustments for patient size are required only in certain cases.
SINGLE DOSES
Single-Dose IV Injection and Plasma Concentration
If a drug is injected into a vein as a single bolus over 5 to 30 seconds and blood samples are taken periodically and analyzed for the drug, the results appear as in Figure 3-2, A. The concentration will be greatest shortly after injection, when distribution of drug in the circulatory system has reached equilibrium. This initial mixing of drug and blood (red blood cells and plasma) is essentially complete after several passes through the heart. Drug leaves the plasma by several processes:
• Distribution across membranes to tissue or other body fluids
• Excretion of unchanged drug by renal or biliary routes
• Metabolism to other active or inactive compounds
• Exhalation through the lungs, if the drug is volatile
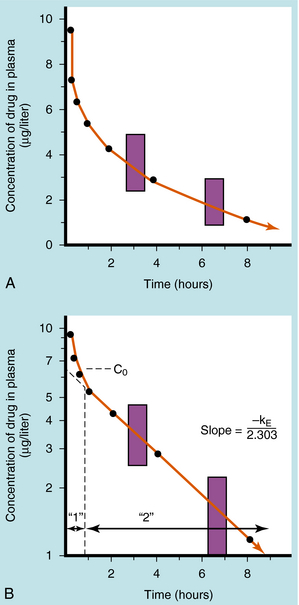
FIGURE 3–2 Plasma concentration of drug as a function of time after IV injection of a single bolus over 5 to 30 seconds. A, Arithmetic plot. B, Same data with concentrations plotted on a logarithmic scale. The 1 represents the distribution (or α) phase, and 2 represents the elimination (or β) phase. Fractional decrease in concentration is constant for a fixed time interval during the straight-line portion of B, shown here as an 18.6% decrease for any 1-hour period (shaded areas).
Some of the drug in plasma is bound to proteins or other plasma constituents; this binding occurs very rapidly and usually renders the bound portion of the drug inactive. Similarly, a considerable fraction of the injected dose may pass through capillary walls and bind to extravascular tissue, also rendering this fraction of drug inactive. The values of drug concentration plotted on the vertical scale in Figure 3-2represent the sum of unbound drug and bound drug. Note that the concentration-time profile shows continuous curvature.
If concentrations are plotted on a logarithmic scale (Fig. 3-2, B), the terminal data points (after 1 hour) lie on a straight line. The section marked “1” on this graph represents the distribution phase(sometimes called alpha phase), representing the main process of drug distribution across membranes and into body regions that are not well perfused. Section “2” (beta phase or elimination) represents elimination of the drug, which gradually decreases plasma concentration. In many clinical situations, the duration of the distribution phase is very short compared with that of the elimination phase.
If the distribution phase in Figure 3-2 (A or B) is neglected, the equation of the line is:
(3-1) ![]()
where:
C(t) = Concentration of drug in the plasma at any time
C0 = Concentration at time zero
e = Base for natural logarithms
kE = First-order rate constant for the elimination phase
t = Time
Equation 3-1 describes a curve on an arithmetic scale (Fig. 3-2, A) that becomes a straight line on a semilogarithmic scale (Fig. 3-2, B). In this case the slope will be –kE/2.3, and the y-intercept is log C0. A characteristic of this type of curve is that a constant fraction of drug dose remaining in the body is eliminated per unit time.
When elimination is rapid, the error in describing C(t) becomes appreciable if the distribution phase is omitted. Although the mathematical derivation is beyond the scope of this text, such a situation is plotted in Figure 3-3 to emphasize the importance of the distribution phase. For most drugs, distribution occurs much more rapidly than elimination, and therefore the distribution term becomes zero after only a small portion of the dose is eliminated. By back extrapolation of the linear postdistribution data, the value of C0 can be obtained, whereas kE can be determined from the slope. The concentration component responsible for the distribution phase (shaded area in Fig. 3-3) is obtained as the difference between the actual concentration and the extrapolated elimination line. This difference can be used to calculate the rate constant for distribution (kd) and the extrapolated time zero-concentration component for the distribution phase ![]() . However, this complexity is often ignored because C(t) for many drugs can be described adequately in terms of the monoexponential equation 3-1. Therefore this chapter discusses only the postdistribution phase kinetics described by equation 3-1.
. However, this complexity is often ignored because C(t) for many drugs can be described adequately in terms of the monoexponential equation 3-1. Therefore this chapter discusses only the postdistribution phase kinetics described by equation 3-1.
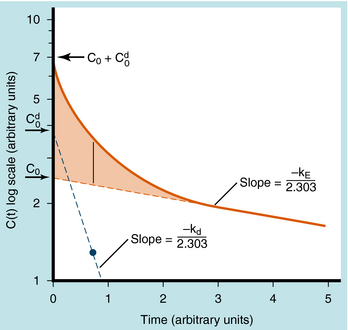
FIGURE 3–3 Semilogarithmic plot of plasma concentration of drug versus time where the distribution phase is included. Solid line represents an equation (not shown) governing distribution and elimination, which can be obtained using one of many available computer programs. This equation can also be obtained by graphical means in which extrapolation of the linear portion of the data (elimination phase) is used to obtain C0 and kE. The differences between the data points and the red dotted extrapolated line in the distribution phase (vertical line at 0.65 time units and plotted as 1.3 concentration units shaded area) are plotted (blue dotted line) and extrapolated linearly to obtain Cd0 and kd.
Single Oral Dose and Plasma Concentration
The plot of C(t) versus time after oral administration is different from that after IV injection only during the drug absorption phase, assuming equal bioavailability. The two plots become identical for the postabsorption or elimination phase. A typical plot of plasma concentration versus time after oral administration is shown in Figure 3-4. Initially, there is no drug in the plasma because the preparation must be swallowed, undergo dissolution if administered as a tablet, await stomach emptying, and be absorbed, mainly in the small intestine. As the plasma concentration of drug increases as a result of rapid absorption, the rate of elimination also increases, because elimination is usually a first-order process, where rate increases with increasing drug concentration. The peak concentration is reached when the rates of absorption and elimination are equal.
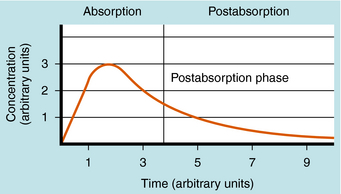
FIGURE 3–4 Typical profile for plasma concentration of drug versus time after oral administration and with a rate constant for drug absorption of at least 10 times larger than that for drug elimination.
CALCULATION OF PHARMACOKINETIC PARAMETERS
As shown in Figures 3-2 and 3-4, the concentration-time profile of a drug in plasma is different after IV and oral administration. The shape of the area under the concentration-time curve (AUC) is determined by several factors, including dose magnitude, route of administration, elimination capacity, and single or multiple dosing. In experiments the information derived from such profiles allows derivation of the important pharmacokinetic parameters—clearance, volume of distribution, bioavailability, and t 1/2. These terms are used to calculate drug dosing regimens.
Clearance
Drug clearance is defined as the volume of blood cleared of drug per unit time (e.g., mL/min) and describes the efficiency of elimination of a drug from the body. Clearance is an independentpharmacokinetic parameter; it does not depend on the volume of distribution, t1/2, or bioavailability, and is the most important pharmacokinetic parameter to know about any drug. It can be considered to be the volume of blood from which all drug molecules must be removed each minute to achieve such a rate of removal (Fig. 3-5). Chapter 2 contains descriptions of the mechanisms of clearance by renal, hepatic, and other organs. Total body clearance is the sum of all of these and is constant for a particular drug in a specific patient, assuming no change in patient status.
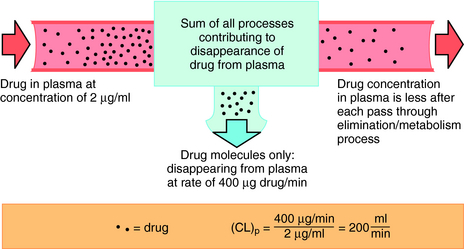
FIGURE 3–5 Concept of total body clearance of drug from plasma. Only some drug molecules disappear from plasma on each pass of blood through kidneys, liver, or other sites, contributing to drug disappearance (elimination). In this example, 200 mL of plasma were required to account for the amount of drug disappearance each minute (400 μg/min) at the concentration of 2 μg/mL. Total body clearance is thus 200 mL/min.
The plot of C(t) versus time (see Fig. 3-2) shows the concentration of drug decreasing with time. The corresponding elimination rate (e.g., mg/min) represents the quantity of drug being removed. The rate of removal is assumed to follow first-order kinetics, and total body clearance can be defined as follows:
(3-2) ![]()
where CLp indicates total body removal from plasma (p).
Clearance is the parameter that determines the maintenance dose rate required to achieve the target plasma concentration at steady state.
(3-3) ![]()
Thus for a given maintenance dose rate, steady-state drug concentration is inversely proportional to clearance.
Volume of Distribution
The actual volume in which drug molecules are distributed within the body cannot be measured. However, a Vd can be obtained and is of some clinical utility. Vd is defined as the proportionality factor between the concentration of drug in blood or plasma and the total amount of drug in the body. Although it is a hypothetical term with no actual physical meaning, it can serve as an indicator of drug binding to plasma proteins or other tissue constituents. Vd can be calculated from the time zero concentration (C0) after IV injection of a specified dose (D).
(3-4) ![]()
If C0 is in mg/L and D in mg, then Vd would be in liters. In some cases it is meaningful to compare the Vd with typical body H2O volumes. The following volumes in liters and percentage of body weight apply to adult humans:
|
Body Weight |
Body H2O (percentage) |
Volume (approx. liters) |
|
Plasma |
4 |
3 |
|
Extracellular |
20 |
15 |
|
Total body |
60 |
45 |
Experimental values of Vd vary from 5 to 10 L for drugs, such as warfarin and furosemide, to 15,000 to 40,000 L for chloroquine and loratadine in a 70 kg adult. How can one have Vd values grossly in excess of the total body volume? This usually occurs as a result of different degrees of protein and tissue binding of drugs and using plasma as the sole sampling source for determination of Vd (Fig. 3-6). For a drug such as warfarin, which is 99% bound to plasma albumin at therapeutic concentrations, nearly all the initial dose is in the plasma; a plot of log C(t) versus time, when extrapolated back to time zero, gives a large value for C0 (for bound plus unbound drug). Using a rearranged equation 3-4, Vd = D/C0, the resulting value of Vd is small (usually 2 to 10 L). At the other extreme is a drug such as chloroquine, which binds strongly to tissue sites but weakly to plasma proteins. Most of the initial dose is at tissue sites, thereby resulting in very small concentrations in plasma samples. In this case a plot of log C(t) versus time will give a small value for C0 that can result in Vd values greatly in excess of total body volume.
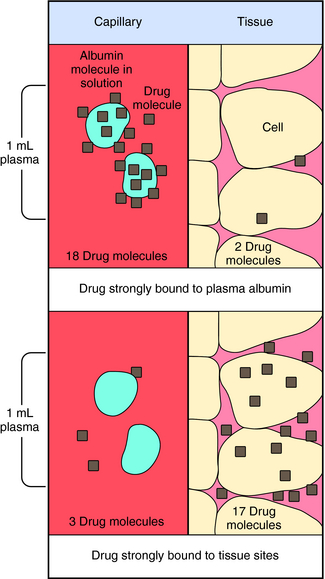
FIGURE 3–6 Influence of drug binding to plasma protein versus tissue sites on Vd. Numbers represent relative quantity of drug in 1 mL of plasma as compared with adjacent tissue. Only the plasma is sampled to determine Vd, and the albumin-bound drug is included in this sample.
Vd can serve as a guide in determining whether a drug is bound primarily to plasma or tissue sites or distributed in plasma or extracellular spaces. Vd is also an independent pharmacokinetic parameter and does not depend on clearance, t1/2, or bioavailability.
In some clinical situations it is important to achieve the target drug concentration (Css) instantaneously. A loading dose is often used, and Vd determines the size of the loading dose. This is discussed in more detail later.
(3-5) ![]()
Half-Life
Equation 3-1 for C(t) was given earlier without explanation of its derivation or functional meaning. Experimental data for many drugs demonstrate that the rates of drug absorption, distribution, and elimination are generally directly proportional to concentration. Such processes follow first-order kinetics because the rate varies with the first power of the concentration. This is shown quantitatively as:
(3-6) ![]()
where dC(t)/dt is the rate of change of drug concentration, and kE is the elimination rate constant. It is negative because the concentration is being decreased by elimination.
Rate processes can also occur through zero-order kinetics, where the rate is independent of concentration. Two prominent examples are the metabolism of ethanol and phenytoin. Under such conditions the process becomes saturated, and the rate of metabolism is independent of drug concentration.
Half-life (t1/2) is defined as the time it takes for the concentration of drug to decrease by half. The value of t1/2 can be read directly from a graph of log C(t) versus t, as shown in Figure 3-2. Note that t1/2can be calculated following any route of administration (e.g., oral or SC). Values of t1/2 for the elimination phase range in practice from several minutes to days or longer for different drugs.
t1/2 is a dependent pharmacokinetic parameter derived from the independent parameters of clearance and volume of distribution.
(3-7) ![]()
Changes in the t1/2 of a drug can result from a change in clearance, Vd, or both. t1/2 determines how long it takes to reach steady-state after multiple dosing or when dosage is altered and how long it takes to eliminate the drug from the body when dosing is ended. It is generally agreed that steady-state is achieved after dosages of five half-lives. When dosing is terminated, most of the drug will have been eliminated after five half-lives (but could still exist as metabolites with longer half-lives).
Bioavailability and First-Pass Effect
Bioavailability (F) is defined as the fraction of the drug reaching the systemic circulation after administration. When a drug is administered by IV injection, the entire dose enters the circulation, and F is 100%. However, this is not true for most drugs administered by other routes, especially drugs given orally. Physical or chemical processes that account for reduced bioavailability include poor solubility, incomplete absorption in the GI tract, metabolism in the enterocytes lining the intestinal wall, efflux transport out of enterocytes back into the intestinal lumen, and rapid metabolism during the first pass of the drug through the liver. Values of F can be determined by comparing the AUC for oral and IV doses.
(3-8) ![]()
In interpreting bioavailability, clearance is assumed to be independent of the route of administration. For drugs in which absorption from the GI tract is not always 100%, the drug formulations must now pass a stringent bioavailability test to verify that bioavailability is constant, within certain limits, among lots, and between generic formulations.
Low bioavailability can also result when the drug is well absorbed from the GI tract, but metabolism is high during its transit from the splanchnic capillary beds through the liver and into the systemic circulation. The drug concentration in the plasma is at its highest level during this first pass through the liver. Therefore drugs that are metabolized by the liver may encounter a very significant reduction in their plasma concentration during this first pass. For example, the first-pass effect of lidocaine is so large that this drug is not administered orally. Some drugs that show high first-pass effects include, but are not limited to, felodipine and propranolol (antihypertensives), isoproterenol (bronchodilator), methylphenidate (central nervous system stimulant), morphine and propoxyphene (analgesics), sumatriptan (antimigraine), and venlafaxine (antidepressant).
In summary, two calculations must be performed on plasma concentration-time data: the AUC and the terminal slope. These two calculations can then be used to calculate clearance, volume of distribution, t1/2, and bioavailability.
Binding of Drug to Plasma Constituents
The degree of binding of a drug to plasma constituents is important because it helps with interpreting the mechanisms of clearance and volume of distribution. The free drug concentration is referred to as the unbound fraction. Some drugs, such as caffeine, have high unbound fractions (0.9), whereas other drugs, such as warfarin, have low unbound fractions (0.01).
The rates of drug disappearance and the concentration of free drug available to the site of action are altered substantially if a significant portion of the drug is plasma bound. Clinical tests for plasma drug concentrations are based on the total (bound plus unbound) concentration of drug and do not provide information about protein binding. A knowledge of the free drug concentration in plasma would be clinically useful because only the free drug is available to interact at its receptor(s); this information is only rarely available.
The binding of drugs to plasma or serum constituents involves primarily albumin, α1-acid glycoprotein, or lipoprotein (Table 3-1). Serum albumin is the most abundant protein in human plasma. It is synthesized in the liver at roughly 140 mg/kg of body weight/day under normal conditions, but this can change dramatically in certain disease states. Many acidic drugs bind strongly to albumin, but because of the normally high concentration of plasma albumin, drug binding does not saturate all the sites. Basic drugs bind primarily to α1-acid glycoprotein, which is present in plasma at much lower concentrations than albumin but varies more widely between and within people as a result of disease. Less is known about drug binding to lipoproteins, although this is also often altered during disease.
TABLE 3–1 Drugs that Bind Appreciably to Serum or Plasma Constituents
|
Bind Primarily to Albumin |
Bind Primarily to α1-Acid Glycoprotein |
Bind Primarily to Lipoproteins |
|
Barbiturates |
Alprenolol |
Amphotericin B |
|
Benzodiazepines |
Bupivacaine |
Cyclosporin |
|
Bilirubin* |
Dipyridamole |
Tacrolimus |
|
Digitoxin |
Disopyramide |
|
|
Fatty acids* |
Etidocaine |
|
|
Penicillins |
Imipramine |
|
|
Phenylbutazone |
Lidocaine‡ |
|
|
Phenytoin |
Methadone |
|
|
Probenecid |
Prazosin |
|
|
Streptomycin |
Propranolol |
|
|
Sulfonamides |
Quinidine |
|
|
Tetracycline |
Sirolimus |
|
|
Tolbutamide |
Verapamil |
|
|
Valproic acid |
||
|
Warfarin |
* May be displaced by drugs in some disease states.
‡ In the United Kingdom the drug name is lignocaine.
MULTIPLE OR PROLONGED DOSING
As mentioned previously, most drugs require administration over a prolonged period to achieve the desired therapeutic effect. The two principal modes of administration used to achieve such a prolonged effectiveness are continuous IV infusion or discrete multiple doses on a designated dosing schedule. The basic objective is to increase the plasma concentration of drug until a steady-state is reached that produces the desired therapeutic effect with little or no toxicity. This steady-state concentration is then maintained for minutes, hours, days, weeks, or longer, as required.
Continuous Intravenous Infusion
Continuous IV infusion of a drug is used when it is necessary to obtain a rapid onset of action and maintain this action for an extended period under controlled conditions. This usually occurs in a hospital or emergency setting.
During continuous infusion the drug is administered at a fixed rate. The plasma concentration of drug gradually increases and plateaus at a concentration where the rate of infusion equals the rate of elimination. A typical plasma concentration profile is shown in Figure 3-7. The plateau is also known as the steady-state concentration (Css). Key points are:
• At steady-state the rate of drug input must equal the rate of drug disappearance.
• The input rate is the infusion rate (mg/min).
• Conversion of the steady-state concentration (mg/L) to the disappearance rate (mg/min) requires a knowledge of clearance (L/min).
• Thus at steady-state one calculates the maintenance dose rate = target concentration × clearance (see Equation 3-3).
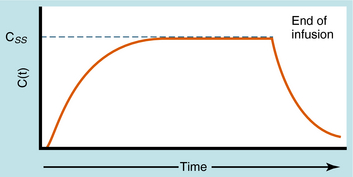
FIGURE 3–7 Typical profile showing drug plasma concentrations with time for continuous IV injection (called infusion) at a constant rate and without a loading dose. Css is the concentration at plateau, or steady-state, where rate of drug input equals rate of drug elimination. At termination of infusion, decay in the concentration will be the same as for any acute IV injection with Co being equal to Css.
The plateau concentration is influenced by the infusion rate and the total body clearance. Of these factors, only the infusion rate can be easily modified. For example, if the plateau concentration is 2 ng/mL with an infusion rate of 16 µg/hr, and it is determined that the concentration is too high, such that 1.5 ng/mL would be better, this concentration can be achieved by decreasing the infusion rate by 25% to 12 µg/hr, which should give a 25% decrease in the plateau concentration.
Dosing Schedule
Discrete multiple dosing is usually specified so that the size of the dose and T (the time between doses) are fixed. Two considerations are important in selecting T. Smaller intervals result in minimal fluctuations in plasma drug concentration; however, the interval must be a relatively standard number of hours to ensure patient compliance. In addition, for oral dosing, the quantity must be compatible with the size of available preparations. Thus an oral dosing schedule of 28 mg every 2.8 hours is impractical, because the drug is probably not available as a 28-mg tablet, and taking a tablet every 2.8 hours is completely impractical. More practical dosing intervals for patient compliance are every 6, 8, 12, or 24 hours.
Alterations in plasma concentration of drug versus time for multiple dosing by repeated IV injections is shown in Figure 3-8. In panel A, T is selected so that all drug from the previous dose disappears before the next dose is injected and there is no accumulation of drug; no plateau or steady-state is reached. If a plateau concentration is desired, T must be short enough so that some drug from the previous dose is still present when the next dose is administered. In this way the plasma concentration gradually increases until the drug lost by elimination during T is equal to the dose of drug added at the start of T. When this is achieved, the mean concentration for each time period has reached a plateau. This stepwise accumulation is illustrated by panel B in Figure 3-8, where a plot of plasma drug concentration versus time for multiple IV injections is shown, with T roughly equivalent to the t1/2 of drug elimination. The average rate (over a dose interval) of drug input is constant at D/T. The amount of drugeliminated is small during the first T but increases with drug concentration during subsequent intervals, until the average rate of elimination and the average rate of input are equal. That is, the dose is eliminated during T. For significant accumulation, T must be at least as short as the t1/2 and preferably shorter.
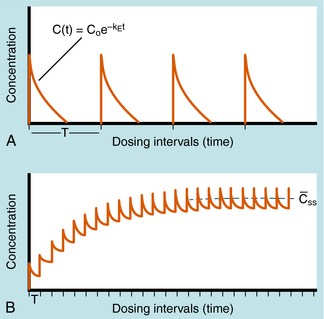
FIGURE 3–8 Discrete multiple-dosing profile of plasma concentration of drug given by IV injections with the same dose given each time. A, T is long enough so that each dose completely disappears before administration of the next dose. B, T is much shorter so that drug from previous injection is present before administration of the next dose. Accumulation results, with Css representing the mean concentration of drug at plateau level, where the mean rate of drug input equals the mean rate of drug elimination for each T. No loading dose is shown.
At the plateau the Css is equal to the input dose rate divided by the clearance, just as for continuous infusion.
(3-9) ![]()
This equation illustrates that the size of the dose or the duration of T can be changed to modify the mean plateau concentration of drug during multiple dosing regimens.
Loading Dose
If all of the multiple doses are the same size, the term maintenance dose is used. In certain clinical situations, however, a more rapid onset of action is required, which can be achieved by giving a much larger, or loading dose, before starting the smaller maintenance dose regimen. A single IV loading dose (bolus) is often used before starting a continuous IV infusion, or a parenteral or oral loading dose may be used at the start of discrete multiple dosing. Ideally, the loading dose is calculated to raise the plasma drug concentration immediately to the plateau target concentration (see Equation 3-5), and the maintenance doses are designed to maintain the same plateau concentration. Multiplying the plateau concentration by the Vd results in a value for the loading dose (see Equation 3-5). However, the uncertainty in Vd for individual patients usually leads to administration of a more conservative loading dose to prevent overshooting the plateau and encountering toxic concentrations. This is particularly important with drugs with a narrow TI.
Duration of Time to Steady-State
For a continuous IV infusion or a series of discrete multiple doses, the time to reach the plateau concentration or to move from one plateau concentration to another depends only on the t1/2 of the drug. After one t1/2, 50% of plateau steady-state concentration is achieved. In practice, steady-state occurs when 95% of the plateau steady-state concentration has been achieved, which occurs after five half-lives. In summary, clearance determines the steady-state concentrations and t1/2 determines when steady-state has been achieved.
PRACTICAL EXAMPLE
A patient has received the cardiac drug digoxin orally at 0.25 mg (one tablet/day) for several weeks, and symptoms of toxicity have recently appeared. A blood sample was taken and underwent assay to give a plasma concentration of 3.2 ng/mL (in the toxic range). For therapeutic reasons, you do not want to drop the plasma concentration too low, but decide to try reducing it to 1.6 ng/mL. What new dosing schedule should be used, and how long will it take to reach the new plateau?
The once-a-day dosing interval is convenient, so you now specify 0.125 mg/day (one-half tablet/day); a 50% reduction in the plateau level requires a 50% decrease in dose. There are two options for reaching the lower plateau: (1) immediately switch to the 0.125 mg/day dosing rate and achieve the 1.6 ng/mL concentration in approximately five half-lives (you do not know what the t1/2 for digoxin is in your patient), or (2) stop the digoxin dosing for an unknown number of days until the concentration reaches 1.6 ng/mL, and then begin again at a dosing schedule of 0.125 mg/day. The second procedure undoubtedly will be more rapid, but you must determine how many days to wait. You decide to stop all digoxin dosing, wait 24 hours from the previous 3.2 ng/mL sample, and get another blood sample. The concentration now has decreased to 2.7 ng/mL or by approximately one-sixth in a day. From equation 3-1, the fractional decrease each day should remain constant. Therefore a decrease of one-sixth of the remaining concentration each day should result in 2.25 ng/mL after day 2, 1.85 ng/mL after day 3, and 1.55 ng/mL after day 4. Therefore, by withholding drug for a total of 4 days, you can reduce the plasma concentration to 1.6 ng/mL. Because the t1/2 is calculated to be 3.8 days in this patient, switching to the 0.125 mg/day dosing rate without withholding drug would have required 15 to 19 days to reach the 1.6 ng/mL concentration.
CLEARANCE AND ELIMINATION
Elimination refers to the removal of drug from the body. There are two processes involved in drug elimination, as discussed in Chapter 2: metabolism, in which there is conversion of the drug to another chemical species, and excretion, in which there is loss of the chemically unchanged form of the drug. The two principal organs of elimination are the liver and kidneys. The liver is mainly concerned with metabolism but has a minor role in excretion of some drugs into the bile. The kidney is mainly involved in drug excretion.
The relative importance of these two elimination pathways is often determined by giving a dose (IV) of drug, collecting all urine over five half-lives, measuring how much unchanged drug is present in urine (the rest is assumed to have been metabolized), and expressing this as a fraction of the dose. This is called the fraction excreted unchanged and can vary from less than 5% (essentially all the drug is metabolized, for example, amiodarone) to greater than 90% (essentially none of the drug is metabolized, for example, gentamicin). The fraction of the dose metabolized is one minus the fraction excreted unchanged.
Total body clearance of a drug is simply the sum of clearances across the organs of elimination—usually kidney and liver.
(3-10) ![]()
That is, individual organ clearances are additive so that renal clearance can be calculated by multiplying the fraction excreted unchanged by total clearance; therefore nonrenal (usually inferred to be hepatic) clearance is calculated as total clearance minus renal clearance.
PHYSIOLOGICAL CONCEPTS OF CLEARANCE AND BIOAVAILABILITY
As discussed previously, clearance is the most important pharmacokinetic parameter, because it controls the steady-state concentration of a drug. Having determined that a drug is cleared mainly by hepatic mechanisms (metabolism) and having calculated a value for hepatic clearance, it is important to relate this to the functions (blood flow, enzyme activity) of liver. For example, if hepatic clearance of a drug is calculated to be 1000 mL/min and liver blood flow is 1500 mL/min, it does not mean that 1000 mL of blood going through liver is totally cleared of drug and the other 500 mL/min is not cleared of drug. It means that 1000/1500 (i.e., two-thirds) of the drug in blood entering liver is irreversibly removed (usually metabolized) by liver in one pass. The two-thirds refers to the hepatic extraction ratio (E), which is the fraction of the unbound dose of drug entering the liver from blood that is irreversibly eliminated (metabolized) during one pass through the liver.
(3-11) ![]()
Note that E can range from zero (no extraction) to 1.0 (complete extraction). If Q is liver blood flow, then clearance by the liver can be described by the following equation.
(3-12) ![]()
Thus clearance of a drug by any eliminating organ is a function of blood flow rate (rate of delivery) to the organ and the extraction ratio (efficiency of drug removal). It should now be clear that clearance of any drug cannot exceed the blood flow rate to its eliminating organ. In the case of drugs metabolized by liver, the maximum hepatic clearance value is approximately 1.5 L/min. For kidney, the maximum renal clearance value is 1.2 L/min (kidney blood flow).
For drugs cleared by the liver, hepatic clearance and bioavailability can be described in terms of three important physiologically based determinants: liver blood flow (Q), unbound fraction in plasma, and liver drug metabolizing activity.
Most hepatically eliminated drugs are classified as being either of low or high (hepatic) clearance. This makes it possible to predict the influence of altered liver function or drug interactions on plasma concentrations and pharmacological response. For example, metabolism of a drug is often reduced in patients with liver disease, or when a second drug inhibits its metabolic enzyme. For a high-clearance drug, this results in no change in the plasma concentration-time profile after IV dosing, because blood flow is the sole determinant of clearance (whereas plasma and tissue binding are determinants of Vd). However, when the drug is administered orally, a decrease in metabolism will result in a small reduction in E and therefore a large increase in bioavailability, resulting in substantially increased plasma concentrations. For a low hepatic clearance drug, a decrease in metabolism will cause increased concentrations after IV dosing, because metabolism is a determinant of clearance. There will be no change in bioavailability, however, because that is already close to 100%. On the other hand, concentrations after oral dosing will be raised because clearance has decreased. The outcome of this scenario is that for a low-clearance drug, both the oral and IV dose may need to be reduced to avoid toxicity, but for a high-clearance drug, only the oral dose may need adjustment (Fig. 3-9).
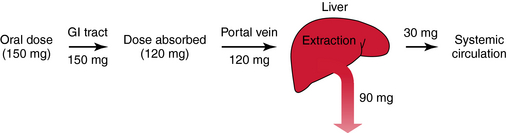
FIGURE 3–9 Determinants of oral bioavailability: 150 mg of drug is swallowed, enters the lumen of the GI tract, and 120 mg is absorbed (30 mg is lost due to one or a combination of mechanisms) and enters the portal vein, which drains into the liver. The hepatic extraction ratio is 0.75, and the fraction escaping this first-pass loss is 0.25. Bioavailability is the fraction of the absorbed dose (0.8) entering the portal vein multiplied by the fraction escaping first-pass metabolism (0.25). In this example, bioavailability is 20% (or 30 mg/150 mg)
Modified from Birkett DJ: Pharmacokinetics made easy, McGraw-Hill Australia, 2002.
In summary, it is important to know which drugs are eliminated via renal or hepatic mechanisms. If the latter is the case, then it is important to characterize the drug as being of low or high clearance. If low, enzyme activity and binding are determinants of clearance, and bioavailability is unchanged. If high, liver blood flow is the sole determinant of clearance, and blood flow, binding, and enzyme activity all affect bioavailability. From these parameters it is then often possible to predict the effect of disease (e.g., liver, cardiac) and administration of other drugs on the resultant pharmacokinetics of the drug, which helps in designing a rational dosage regimen.
AGE CONSIDERATIONS
Pharmacokinetic, pharmacodynamic, and pharmacological responses differ between young adults and infants and between young adults and the elderly. These differences are due to the many physiological changes that occur during the normal life span, but especially at the extremes—infants and the elderly (Fig. 3-10).
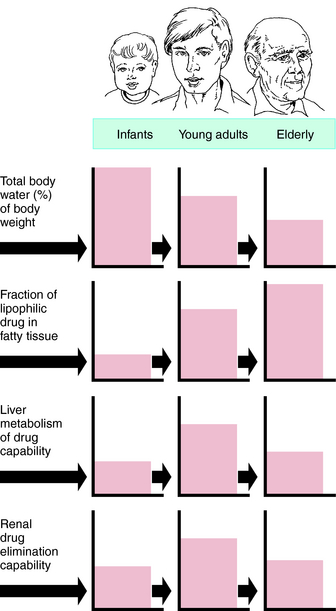
FIGURE 3–10 Areas of boxes indicate relative size or capability of function at each age.
Drug Dosing in Neonates
The limited understanding of the clinical pharmacology of specific drugs in pediatric patients predisposes this population to problems in the course of drug treatment, particularly in younger children, such as newborns. The absence of specific FDA requirements for pediatric studies and the resulting reliance on pharmacological and efficacy data derived primarily from adults to determine doses for use of drugs in children calls for suboptimal drug therapy. The problems of establishing efficacy and dosing guidelines for infants are further complicated by the fact that the pharmacokinetics of many drugs change appreciably as an infant ages from birth (sometimes prematurely) to several months after birth. The dose-response relationships of some drugs may change markedly during the first few weeks after birth.
The physiological changes that occur during the first month include higher than normal gastric pH, prolonged gastric emptying (compounded by gastroesophageal reflux, respiratory distress syndrome, and congenital heart disease), lower adipose tissue and higher total body H2O content, decreased plasma albumin, drug metabolizing activity, glomerular filtration, and tubular secretion. These result in decreased drug clearance and oral absorption and increased volume of distribution for H2O-soluble drugs but decreased volume of distribution for lipid-soluble drugs. Because of these dramatic and continuously changing parameters, dosing in neonates (<1 year) requires the advice of specialists.
Because of the often compromised cardiac output and peripheral perfusion of seriously ill infants, IV drug administration is generally used to ensure adequate systemic delivery of the agent. The potential problems with such treatment can be serious, and to minimize such problems requires the dilution and timed administration of small dosage volumes, the maintenance of fluid balance, and consideration of the effect of the specific drug administration technique on resultant serum concentrations.
Certain drugs pose particular difficulties when used in neonates or during the perinatal period because of the unique characteristics of their distribution or elimination in patients in this age group or because of the unusual side effects they may cause. These drugs include antibiotics, digoxin, methylxanthine, and indomethacin.
Drug Dosing in Aged Patients
The rational use of drugs by the elderly population (>65 years) is a challenge for both patient and prescriber. Compared with young adults, the elderly have an increased incidence of chronic illness and multiple diseases, take more drugs (prescription and over-the-counter) and drug combinations, and have more adverse drug reactions. Inadequate nutrition, decreased financial resources, and poor adherence to medication schedules may also contribute to inadequate drug therapy. These factors are compounded by the decline in physiological functions as part of the normal aging process, leading to altered drug disposition and sensitivity (Box 3-2). The elderly can have a different and more variable response to drugs compared with young adults. Drug selection and decisions about dosage in the elderly are largely based on trial and error, anecdotal data, and clinical impression. After the most appropriate drug is selected, the dosing schedule should be “start low, go slow.”
BOX 3–2 Factors Contributing to Altered Drug Effects in the Elderly
Altered Drug Absorption and Disposition
Decreased gastric acid
Decreased lean body mass
Increased percentage of body fat
Decreased liver mass and blood flow
Reduced renal function
Altered Response to Drug
Altered receptor and/or postreceptor properties
Impaired sensitivity of homeostatic mechanisms
Common diseases: diabetes, arthritis, hypertension, coronary artery disease, cancer, glaucoma
Social and Economic Factors
Inadequate nutrition
Multiple-drug therapy
Noncompliance
PHARMACOKINETIC CHANGES WITH AGING
Physiological Changes
Several physiological functions decline beginning between 30 and 45 years of age and have important influences on pharmacokinetics. Of course, such changes are highly individualized, and some elderly people show few changes compared with population means. Cardiac output decreases by approximately 1% a year beginning at 30 years of age, and in the elderly is associated with a redistribution of blood flow favoring the brain, heart, and kidney, and a reduction in hepatic blood flow. The percent of lean body mass also declines with age, whereas total body H2O decreases by 10% to 15% between 20 and 80 years of age. Plasma albumin concentrations are also lower in the elderly, particularly in the chronically ill or poorly nourished. Concentrations of α1-acid glycoprotein increase, but do so more sharply in response to acute illness than simply aging. Glomerular filtration rate and effective renal plasma flow decline steadily with advancing age, although the serum creatinine concentration does not, because of the smaller lean body mass. The tubular secretory capacity declines in parallel with the glomerular filtration rate.
Drug Absorption
Several physiological alterations in GI function have been reported to occur with aging, although there is little clinically significant alteration in drug absorption in the elderly. One exception is a threefold increase in the bioavailability of levodopa, stemming from the reduced activity of dopa decarboxylase in the stomach wall.
Drug Distribution
The reduced lean body mass, reduced total body H2O content, increased fat, and decreased plasma albumin concentration in the elderly can contribute to significant alterations in drug distribution, depending on the physiochemical properties of individual drugs. Lipid-soluble drugs, such as diazepam and lidocaine, have a larger Vd in the elderly, whereas H2O-soluble drugs, such as acetaminophen and ethanol, have a smaller Vd. Digoxin also has a lower Vd in the elderly, and therefore loading doses must be reduced. There are slightly lower plasma albumin concentrations in healthy elderly patients, whereas the hospitalized or poorly nourished elderly patient may have decreases of 10% to 20%.
Drug Metabolism
The decline in the ability of the elderly to metabolize most drugs is relatively small and difficult to predict. In general, phase I metabolic reactions decrease slightly with aging, whereas conjugation reactions, such as glucuronidation, are not greatly affected. The effects of cigarette smoking, diet, and alcohol consumption may be more important than physiological changes. For example, decreased dietary protein intake or reduction in cigarette smoking may lead to decreased liver microsomal enzyme activity. Whereas hepatic enzyme inhibition by drugs is similar in the elderly compared with young adults, the response to enzyme inducers (cigarette smoke, drugs, etc.) is more variable.
Hepatic Clearance and First-Pass Metabolism
For drugs with a high hepatic clearance, the age-related decline in total liver blood flow of approximately 40% results in a similar reduction in total body clearance. The effect on first-pass hepatic extraction (and hence bioavailability) is complicated by potential alterations in other physiological variables such as protein binding and enzyme activity. In healthy elderly subjects, first-pass metabolism and bioavailability are generally not markedly altered. However, on chronic oral dosing, the higher plasma concentrations often observed in the elderly are the result of reduced phase I metabolism, irrespective of whether the drug has a high or low hepatic clearance.
Renal Clearance
Consistent with the physiological decline in renal function that occurs with aging, the rate of elimination of drugs excreted by the kidney is reduced. Such drugs include aminoglycosides, lithium carbonate, metformin, allopurinol (due to its active metabolite), and digoxin. To prevent drug toxicity, renal function must be estimated and downward adjustments in dosage made accordingly. Although there are no absolute guidelines, two general principles apply. First, most elderly patients do not have “normal” renal function even though serum creatinine appears “normal.” Second, most elderly patients require adjustments in dosage for drugs (or drugs with active metabolites) eliminated primarily by the kidneys.
The decreased rate of elimination of inhalation anesthetics, resulting from declining pulmonary function with aging, is another important consideration for elderly patients receiving general anesthesia.
DRUG RESPONSE CHANGES ASSOCIATED WITH AGING
Changes in drug responses in the elderly have been less studied than have pharmacokinetic changes. In general, an enhanced response can be expected (Table 3-2), and a reduced dosage schedule is recommended to prevent serious side effects for many drugs. Reduced responses to some drugs, such as the β-adrenergic receptor agonist isoproterenol, do occur, however, through nonpharmacokinetic mechanisms such as age-related changes in receptors and postreceptor signaling mechanisms, changes in homeostatic control, and disease-induced changes.
TABLE 3–2 Altered Drug Responses in the Elderly
|
Drugs |
Direction of Change |
|
Barbiturates |
Increased |
|
Benzodiazepines |
Increased |
|
Morphine |
Increased |
|
Pentazocine |
Increased |
|
Anticoagulants |
Increased |
|
Isoproterenol |
Decreased |
|
Tolbutamide |
Decreased |
|
Furosemide |
Decreased |
Changes in Receptors and Postreceptor Mechanisms
Age-related changes may occur at receptor and postreceptor levels. Mechanisms include changes in receptor density or affinity, alteration in signaling pathways, alteration in biochemical responses such as glycogenolysis, or mechanical effects such as vascular relaxation.
The function of the β-adrenergic receptor system is reduced in the elderly (see Table 3-2). The sensitivity of the heart to adrenergic agonists is decreased in elderly subjects, and a higher dose of isoproterenol is required to cause a 25-beat/min increase in heart rate. However, α-adrenergic receptor function is not usually changed in the elderly.
There is an increased central nervous system sensitivity to many drugs in elderly patients. The increased response to benzodiazepines can lead to increased sedation, confusion, gait disturbances, and other adverse effects that cannot be explained on pharmacokinetic grounds alone. Psychotropic drugs are associated with more adverse effects (delirium, sedation, confusion) in the elderly compared with young adults, and tricyclic antidepressants also cause more confusion, seizures, and enhanced anticholinergic effects. Opioids, such as morphine, can cause more constipation, confusion, nausea and vomiting, and respiratory depression in elderly patients.
Impaired Homeostatic Mechanisms
Aging is often associated with decreased activity of aortic and carotid body chemoreceptors, reduced baroreceptor reflexes, impaired thermoregulation, inappropriate response of blood-glucose and insulin to glucose, and altered neurological control of bowel and bladder. All of these may contribute to drug toxicity. The decreased baroreflex sensitivity may lead to an increased risk of orthostatic (postural) hypotension. This is a common problem in elderly patients taking some of the phenothiazines and antidepressants (those with significant α1-adrenergic antagonist properties), nitrates, diuretics, and some antihypertensives, such as prazosin and α-methyldopa. Multiple mechanisms are implicated in the impaired thermoregulation seen in many elderly people and include an absence of shivering, failure of metabolic rate to rise, poor vasoconstriction, and insensitivity to a low body temperature. Chlorpromazine and many other psychoactive drugs may cause hypothermia, and alcohol tends to augment this effect.
Disease-Induced Changes
It is common for elderly patients to have multiple chronic diseases such as diabetes, glaucoma, hypertension, coronary artery disease, and arthritis. The presence of multiple diseases leads to the use of multiple medications, an increased frequency of drug-drug interactions, and adverse drug reactions (Table 3-3). Moreover, a disease may increase the risk of adverse drug reactions or preclude the use of the otherwise most effective or safest drug for treatment of another problem. For example, anticholinergic drugs may cause urinary retention in men with enlarged prostate glands or precipitate glaucoma, and drug-induced hypotension may cause ischemic events in patients with vascular disease.
TABLE 3–3 Drug-Disease Interactions
|
Drug |
Disease |
|
Ibuprofen, other NSAIDs |
GI tract hemorrhage, increased blood pressure, renal impairment |
|
Digoxin |
Dysrhythmias |
|
Levothyroxine |
Coronary artery disease |
|
Prednisone, other glucocorticoids |
Peptic ulcer disease |
|
Verapamil, diltiazem |
Congestive heart failure |
|
Propranolol, other β-adrenergic antagonists |
Congestive heart failure, chronic obstructive pulmonary disease |
NSAIDs, Nonsteroidal anti-inflammatory drugs.
GUIDELINES FOR DRUG PRESCRIBING IN THE ELDERLY
Many drugs exhibit more narrow therapeutic indexes when used in the elderly. The impact of the physiological changes that occur with aging alter the pharmacokinetics and pharmacodynamics of drugs and predispose the elderly to adverse drug effects. This is amplified by their reduced physiological compensatory capacity. Practical considerations when prescribing for the elderly include: (1) use nonpharmacological approaches when possible; (2) use the lowest possible dose and the smallest dose increment (“start low, go slow”); (3) use the smallest number of medications; (4) regularly review drug treatments and potential interactions; and (5) recognize that any new symptoms may be caused by the drugs prescribed and not by the aging process.
DRUG INTERACTIONS
Many patients take several drugs simultaneously, and many elderly patients receive as many as 12 drugs concurrently, resulting in many opportunities for drug interactions, often through the pharmacokinetic mechanisms discussed previously.
A drug interaction refers to a change in magnitude or duration of the pharmacological response of one drug because of the presence of another drug. Drug interactions can cause either more rapid elimination or slower elimination, with plasma concentrations increasing or decreasing above or below minimum effective values. There are many mechanisms by which drugs interact, including acceleration or inhibition of metabolism; displacement of plasma protein binding; impaired absorption; altered renal clearance; modifications in receptors; and changes in electrolyte balance, body fluid pH, or rates of protein synthesis. Many drug interactions are well documented in the literature, and these potential interactions should be taken into account when multiple drugs are prescribed.
SUMMARY
Pharmacokinetics provides a firm basis for the design of dosing regimens and characterization of the kinetics of drug disposition, although many parameters must be taken into account for such rational design, particularly at the extremes of age. The major points include:
• Clearance
• Bioavailability and first-pass metabolism
• Half-life
• Effects of plasma protein binding
• Concept of the Vd
• Exponential disposition of drug (first-order decline) in which a constant fraction of drug is disposed of per unit time
• Concept that the rates of drug input and elimination are equal at the steady-state or plateau concentrations
• How to modify a dosing regimen to achieve a desired change in plateau concentration
• Concept that the time to reach plateau depends only on the elimination t1/2 of the drug, and the plateau concentration is determined by clearance
• The use of a loading dose to accelerate the onset of the desired therapeutic effect
• Requirement for special expertise in determining drug dosage in neonates
• Changes in pharmacodynamic and pharmacokinetic parameters associated with aging
• Simultaneous administration of multiple drugs can alter their disposition and bioavailability
FURTHER READING
Bartelink IH, Rademaker CM, Schobben AF, van den Anker JN. Guidelines on paediatric dosing on the basis of developmental physiology and pharmacokinetic considerations. Clin Pharmacokinet. 2006;45:1077-1097.
Bauer LA. Applied clinical pharmacokinetics. New York: McGraw Hill, 2001.
Birkett DJ. Pharmacokinetics made easy. Sydney: McGraw Hill, 2002.
Johnson JA. Predictability of the effects of race or ethnicity on pharmacokinetics of drugs. Int J Clin Pharmacol Ther. 2000;38:53-60.
SELF-ASSESSMENT QUESTIONS
1. The t1/2 of a drug:
A. Is an independent pharmacokinetic parameter.
B. Depends on clearance.
C. Depends on the volume of distribution.
D. Must be known to calculate the loading dose.
E. B and C only are true.
2. Drug clearance is:
A. The volume of blood cleared of drug per unit time.
B. Dependent on the volume of distribution.
C. Dependent on t1/2.
D. Dependent on bioavailability.
E. Characterized by all of the above.
3. Which of the following statements concerning the binding of drugs to plasma proteins is/are correct?
A. The rates of drug disappearance and the concentration of free drug available to the site of action are altered substantially, if a significant portion of the drug is bound.
B. Many acidic drugs bind strongly to albumin.
C. Many basic drugs bind strongly to α1-acid glycoprotein.
D. Induction of metabolic enzymes by another drug can cause significant changes in the free concentration of a second drug.
E. All of the above are true.
4. Altered pharmacokinetics of a drug in the elderly may be attributable to:
A. Decreased total body fat.
B. Increased total body H2O content.
C. Increased gastric acid secretion.
D. Decreased glomerular filtration rate.
E. Increased plasma albumin concentrations.
5. The hepatic drug metabolism reaction most likely not to be decreased in the elderly is:
A. N-Demethylation.
B. Hydroxylation.
C. Sulfoxidation.
D. Glucuronidation.
E. Deesterification.