The sequence of mechanical and electrical events that repeats with every heartbeat is called the cardiac cycle. The duration of the cardiac cycle is the reciprocal of the heart rate:
(22-1)
For example, for a heart rate of 75 beats/min, the cardiac cycle lasts 0.8 s or 800 ms.
The closing and opening of the cardiac valves define four phases of the cardiac cycle
The cardiac pump is of the two-stroke variety. Like a pump with a reciprocating piston, the heart alternates between a filling phase and an emptying phase. Under normal circumstances, the electrical pacemaker in the sinoatrial node (see pp. 489–490) determines the duration of the cardiac cycle, and the electrical properties of the cardiac conduction system and cardiac myocytes determine the relative duration of contraction and relaxation. As long as the heart rate remains unchanged, this pattern remains steady.
The cardiac atria are small chambers. The right atrium receives deoxygenated systemic venous return from the inferior and superior venae cavae. The left atrium receives oxygenated blood from the lungs through the pulmonary circulation. Both atria operate more as passive reservoirs than as mechanical pumps. However, they do contract, and this contraction does enhance ventricular filling and cardiac output to a small degree (Box 22-1).
Box 22-1
Importance (and Unimportance) of Atrial Contraction
The relative importance of atrial contraction to overall cardiac function is evident in patients who develop atrial fibrillation (see Fig. 21-14H), an arrhythmia associated with loss of this atrial “kick.” In atrial fibrillation, chaotic electrical activity, bombarding the atria with as many as 500 impulses per minute from all directions, prevents the concerted action of atrial cardiac muscle fibers that is necessary for coordinated atrial contraction. As a result, the atria fibrillate—they look like a wriggling bag of worms. In healthy persons with otherwise normal hearts, the loss of atrial contraction usually causes no symptoms at rest, or perhaps only a sensation of an irregular or rapid heartbeat (i.e., the result of atrial fibrillation). However, if the patient already has a compromised myocardium (e.g., from ischemic heart disease, prolonged hypertension, or mitral stenosis), or if the patient is debilitated by dysfunction of other organs (e.g., chronic emphysema), the loss of the atrial contraction may further reduce cardiac output just enough to send the patient into florid congestive heart failure (see Box 22-4) or even shock (i.e., arterial pressure so low that it compromises perfusion of peripheral tissues). The physician may treat a patient with an otherwise normal heart in a leisurely fashion, or perhaps not at all—keeping in mind that patients with atrial fibrillation are at high risk for development of atrial thrombosis and thus possibly cerebral embolism and stroke. In patients with a compromised myocardium, emergency chemical or electrical cardioversion may be necessary.
The inlet valves of the ventricles are called the AV (atrioventricular) valves. They permit blood to flow in one direction only, from the atria to the ventricles. The valve located between the right atrium and the right ventricle is the tricuspid valve because it has three flaps, or cusps. The valve located between the left atrium and the left ventricle is the mitral valve because it has only two cusps, which resemble a bishop's miter.
The outlet valves of the ventricles are called semilunar valves. They also allow blood to flow in just a single direction, from each ventricle into a large outflow-tract vessel. Both the pulmonary valve, located between the right ventricle and pulmonary artery, and the aortic valve, located between the left ventricle and aorta, have three cusps.
Cardiac valves open passively when upstream pressure exceeds downstream pressure. They close passively when downstream pressure exceeds upstream pressure. The movement of the valve leaflets can be detected by echocardiography (see p. 427); their closure makes heart sounds that can be heard with a stethoscope. The stethoscope can also detect leaks in the valves that permit jets of blood to flow backward across the valvular orifice (i.e., regurgitation), as well as stenotic lesions that narrow the valve opening, forcing the blood to pass through a narrower space (i.e., stenosis). During certain parts of the cardiac cycle, blood passing through either regurgitant or stenotic lesions makes characteristic sounds that are called murmurs (see Box 17-1).
The cardiac cycle can be artificially divided into phases in any number of ways. However, from the point of view of the ventricles and the positions of their valves, we must consider a minimum of four distinct phases:
• Inflow phase. The inlet valve is open and the outlet valve is closed.
• Isovolumetric contraction. Both valves are closed, with no blood flow.
• Outflow phase. The outlet valve is open and the inlet valve is closed.
• Isovolumetric relaxation. Both valves are closed, with no blood flow.
Table 22-1 summarizes these four phases and the key events of the cardiac cycle. Note that the same events occur on the right side of the heart as on the left side.
TABLE 22-1
Events in the Cardiac Cycle
|
VALVULAR EVENTS |
CARDIAC CHAMBER EVENTS |
PHASE |
|
|
Opening of AV valves (tricuspid and mitral) |
Rapid ventricular filling |
1 |
Diastole |
|
Decreased ventricular filling; diastasis |
1 |
Diastole |
|
|
Atrial contraction (additional ventricular filling) |
1 |
Diastole |
|
|
Closing of AV valves (tricuspid and mitral) |
Isovolumetric ventricular contraction (with all valves closed) |
2 |
Systole |
|
Opening of semilunar valves (pulmonary and aortic) |
Rapid ventricular ejection (fast muscle shortening) |
3 |
Systole |
|
Decreased ventricular ejection (slower muscle shortening) |
3 |
Systole |
|
|
Closing of semilunar valves (pulmonary and aortic) |
Isovolumetric ventricular relaxation (with all valves closed) |
4 |
Diastole |
|
Opening of AV valves (tricuspid and mitral) |
It is common to separate these phases into two parts. Systole includes phases 2 and 3, when the ventricles are contracting, whereas diastole includes phases 4 and 1, when the ventricles are relaxing. At a heart rate of 75 beats/min (cycle duration = 800 ms), systole occupies ~300 ms, and diastole ~500 ms. With increasing heart rate—and thus decreasing cycle length—diastole shortens relatively more than systole does.
For convenience, the events in Table 22-1 start a short time after the beginning of diastole, with the opening of the AV valves and the start of ventricular filling (phase 1).
Changes in ventricular volume, pressure, and flow accompany the four phases of the cardiac cycle ![]() N22-1
N22-1
N22-1
Carl J. Wiggers
Contributed by Walter Boron
Carl J. Wiggers (1883–1963) was the chair of the Department of Physiology at Western Reserve University in Cleveland (1918–1953)—following John Macleod (1903–1918) in that position. ![]() N51-3 He was the mentor of several dozen renown physiologists, one of whom was Corneille Heymans.
N51-3 He was the mentor of several dozen renown physiologists, one of whom was Corneille Heymans. ![]() N23-2
N23-2
Wiggers made numerous contributions to the field of cardiovascular physiology, one of which was the development of the pressure-volume loop, also known as the Wiggers diagram.
References
Case Western Reserve University. Physiology and biophysics: History. http://physiology.case.edu/about_us/history/ [Accessed May 29, 2015].
Wikipedia. s.v. Carl J. Wiggers. [Last modified April 30, 2015] http://en.wikipedia.org/wiki/Carl_J._Wiggers [Accessed May 29, 2015].
http://www.the-aps.org/fm/presidents/introcjw.html [Accessed August 30, 2015].
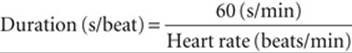
Figure 22-1 illustrates the changes in pressure and volume that occur during the cardiac cycle. The four vertical lines indicate the timing of the four valvular events that terminate each of the four phases defined previously:
• AV valve closure terminates phase 1.
• Semilunar valve opening terminates phase 2.
• Semilunar valve closing terminates phase 3.
• AV valve opening terminates phase 4.
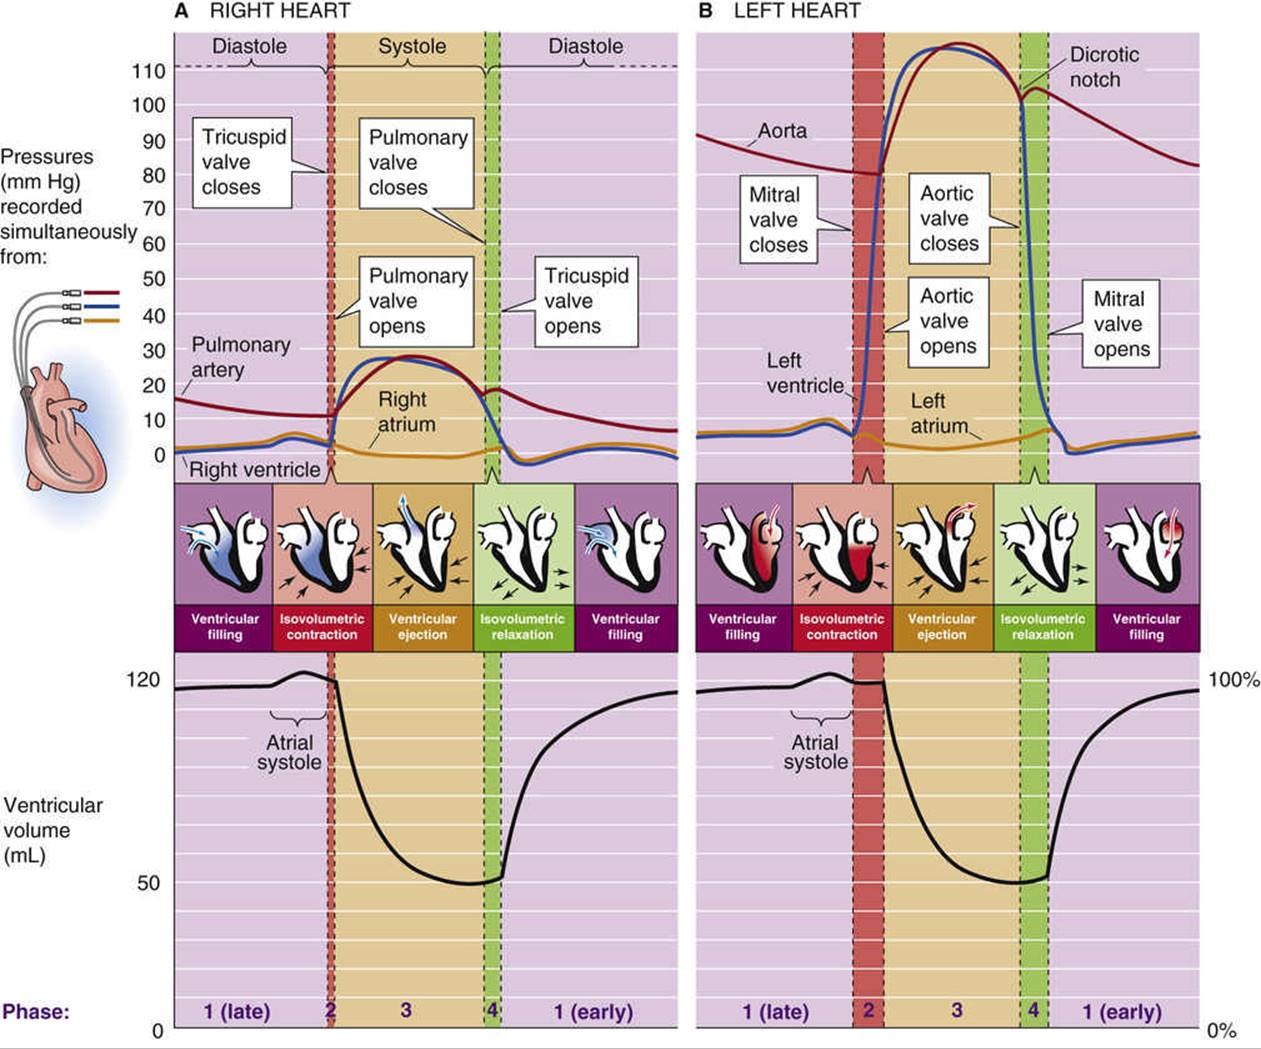
FIGURE 22-1 Pressures and ventricular volumes during the cardiac cycle. A, Right heart. B, Left heart. The inset shows the placement of catheters used for pressure measurements in the right heart.
The shapes of pressure tracings for the right heart (see Fig. 22-1A) and the left heart (see Fig. 22-1B) are quite similar except that the pressures on the right are a scaled-down version of those on the left. In both cases, the tracings begin in the middle of phase 1; that is, the period of decreased filling toward the end of diastole called diastasis (from the Greek dia [apart] + histanai [to stand]). Note that the volume changes in the left ventricle are exactly the same as those in the right ventricle because the cardiac outputs of the right and left sides of the heart are virtually identical (see p. 414). For purposes of illustration, we now focus on the records for the left heart (see Fig. 22-1B).
Diastasis Period (Middle of Phase 1)
During the diastasis, the mitral valve is open, but little blood flows from the left atrium to the left ventricle; ventricular volume slowly rises and approaches a plateau. The pressures in both the left atrium and the left ventricle rise slowly, driven by the pressure in the pulmonary veins, which is only slightly higher. The atrial pressure parallels—and is only slightly above—the ventricular pressure because the mitral valve is wide open, and the flow between the two chambers is minimal. The P wave of the electrocardiogram (ECG; see p. 493), which corresponds to atrial excitation, occurs at the end of this phase.
Atrial Contraction (End of Phase 1)
Immediately following the P wave is the atrial contraction, which causes a variable amount of blood to enter the left ventricle. In a person at rest, the atrial contraction transfers into the left ventricle a volume of blood that represents <20% of the subsequent stroke volume and often only a few percent. During heavy exercise, this figure can rise to 40% (see Box 22-1). Atrial contraction causes a slight rise in intra-atrial pressure, and a comparable rise in ventricular pressure and volume. All during this period, the aortic pressure decreases as blood flows out to the periphery.
Isovolumetric Contraction (Phase 2)
When the ventricles begin to depolarize, as evidenced by the QRS complex on the ECG, systole commences. The ventricles contract, and very soon the pressure in the left ventricle exceeds that in the left atrium (first crossover of blue and orange pressure tracings in Fig. 22-1B, top). As a result, the mitral valve closes. The aortic valve has been closed this entire time. Thus, the left ventricle contracts with both mitral and aortic valves closed. Because the blood has no place to go, the result is an isovolumetric contraction that causes the pressure in the left ventricle to rise rapidly, eventually exceeding the pressure in the aorta (first crossover of blue and red tracings) and causing the aortic valve to open.
Ejection or Outflow (Phase 3)
As the aortic valve opens, the ejection phase begins. During the first part of phase 3—rapid ejection—ventricular pressure (blue tracing in Fig. 22-1B, top) continues to rise, closely followed by a rapid elevation of aortic pressure, which, at first, is slightly less (red tracing). Accompanying these rapid pressure increases is a precipitous reduction in ventricular volume (see Fig. 22-1B, bottom), as blood flows into the aorta. Aortic pressure continues to rise and eventually exceeds ventricular pressure (second crossover of blue and red tracings in Fig. 22-1B, top) just before both the aortic and ventricular pressures begin to fall. Despite the reversal of the pressure gradient across the aortic valve, the cusps of the aortic valve do not immediately snap shut because of the inertia of blood flow, ![]() N22-2 which imparts considerable kinetic energy to the blood. During the latter part of phase 3—decreased ejection—the decrease in ventricular volume becomes less rapid, and both the ventricular and aortic pressures fall off. During the entire ejection phase, about 70 mL of blood flows into the aorta, leaving about 50 mL behind in the ventricle.
N22-2 which imparts considerable kinetic energy to the blood. During the latter part of phase 3—decreased ejection—the decrease in ventricular volume becomes less rapid, and both the ventricular and aortic pressures fall off. During the entire ejection phase, about 70 mL of blood flows into the aorta, leaving about 50 mL behind in the ventricle.
N22-2
Inertial Component of Flow in the Aorta
Contributed by Emile L. Boulpaep
As discussed in ![]() N22-3, when pressure and flow fluctuate, the simple Ohm's law–like relationship ΔP = F · R should be replaced by ΔP = F · Z, where Z is a complex mechanical impedance. Within the impedance term are components that describe compliant impedance, viscous (or resistive) impedance, and inertial impedance.
N22-3, when pressure and flow fluctuate, the simple Ohm's law–like relationship ΔP = F · R should be replaced by ΔP = F · Z, where Z is a complex mechanical impedance. Within the impedance term are components that describe compliant impedance, viscous (or resistive) impedance, and inertial impedance.
In Figure 22-1B (and also in the top panel of Fig. 22-2), the pressure curves for the left ventricle (blue curve) and the aorta (red curve) cross over in the middle of the ejection phase. Yet, the aortic valve does not close at that instant, despite the apparent reversal of the pressure gradient. The flow curve in the aorta (black curve in the second panel of Fig. 22-2) is further proof that the aortic valve remains open: even after the apparent pressure gradient reverses just past the peak ejection, blood flow remains positive during the remainder of the ejection phase.
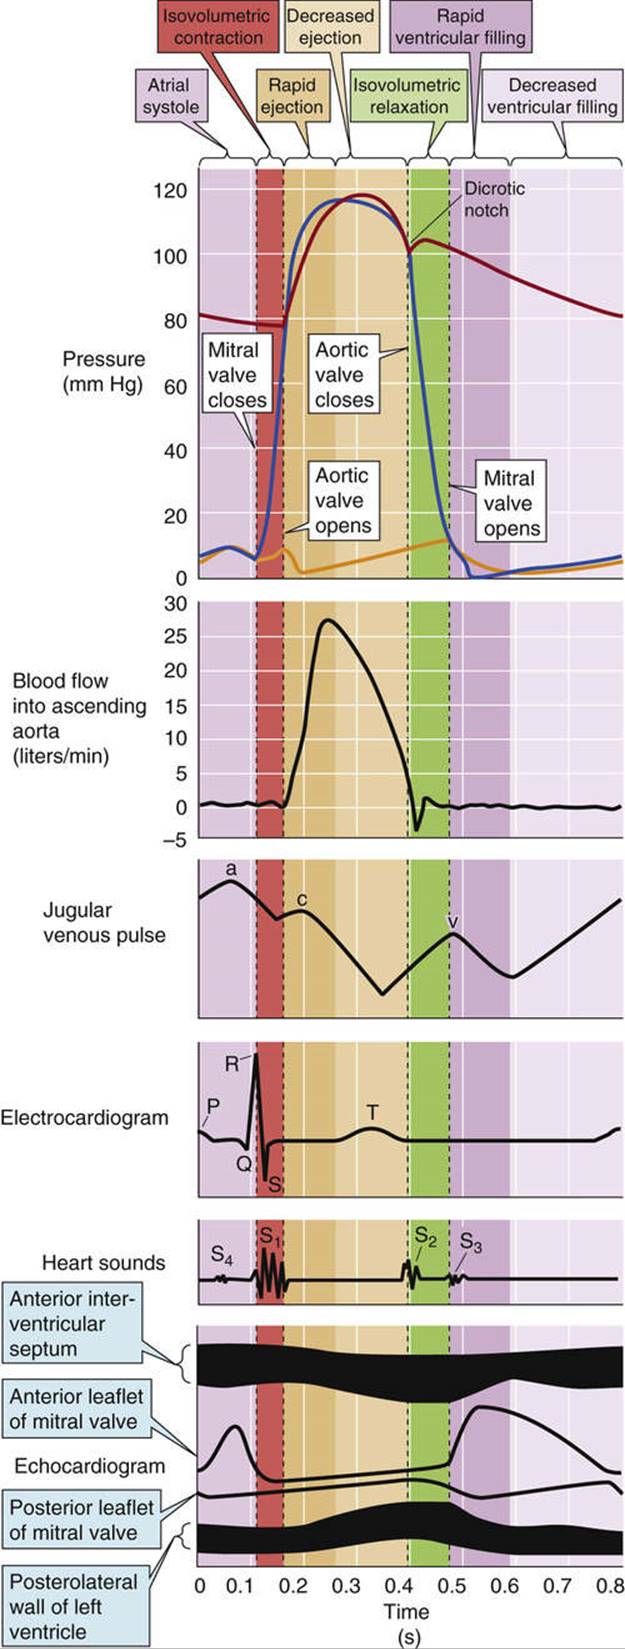
FIGURE 22-2 Mechanical, electrical, acoustic, and echocardiographic events in the cardiac cycle. Top, A repeat of Figure 22-1B, with three modifications: (1) the cardiac cycle begins with atrial contraction; (2) phase 1 of the cardiac cycle has three subparts: rapid ventricular filling, decreased ventricular filling, and atrial systole; (3) phase 3 has two subparts: rapid and decreased ventricular ejection.
Blood flow in the aorta is a good example of a case in which the flow dynamics is primarily inertial in character. During ejection, the aorta receives the entire stroke volume of the left ventricle at a high linear velocity. Thus, the kinetic energy (![]() mv2) is large, because aortic flow carries a large mass of blood (m) at a high velocity (v). The compliance term (mostly radial compliance) within the complex impedance of the aorta is not so important because axial flow is much more important than radial flow. Finally, the viscous-resistance term within the complex impedance of the aorta is minimal because the radius of the aorta is large and resistance is inversely proportional to r4 (see Equation 17-11). Thus, in the aorta, the inertial impedance becomes the major determinant of the overall impedance Z.
mv2) is large, because aortic flow carries a large mass of blood (m) at a high velocity (v). The compliance term (mostly radial compliance) within the complex impedance of the aorta is not so important because axial flow is much more important than radial flow. Finally, the viscous-resistance term within the complex impedance of the aorta is minimal because the radius of the aorta is large and resistance is inversely proportional to r4 (see Equation 17-11). Thus, in the aorta, the inertial impedance becomes the major determinant of the overall impedance Z.
The dominance of the inertial impedance is illustrated by the finding that the aortic valve does not close despite a reversal of the pressure gradient between the left ventricle and the aortic arch as recorded by indwelling catheters with side openings. As shown in Figure 17-11, the “side pressure” measurement does not take into account the kinetic momentum (i.e., Bernouilli forces) along the axis of blood flow. If we had included the inertial component in our measurement of ΔP—by measuring pressure with catheters that face upstream, as shown by the uppermost catheter in Figure 17-11—we would observe no reversal of the pressure. Thus, there is no violation of the principle that ΔP = F · Z, which is to say that blood is still flowing down an energy gradient.
Isovolumetric Relaxation (Phase 4)
Late in the ejection phase, blood flow across the aortic valve falls to extremely low values, until it actually reverses direction (i.e., retrograde or negative flow). At this point, the aortic valve closes, defining the onset of diastole. As blood flow in the aorta again becomes briefly positive (i.e., forward), there is a small upward deflection in the aortic pressure trace. The result is the dicrotic notch (from the Greek dikrotos [double-beat]), or incisura, and the subsequent dicrotic wave, which interrupts the generally downward trend of aortic pressure. Because both the aortic and mitral valves are closed, and no blood can enter the left ventricle, this is the period of isovolumetric relaxation. Pressure falls rapidly in the left ventricle.
Rapid Ventricular Filling Period (Beginning of Phase 1)
When ventricular pressure falls below that in the left atrium (second crossover of blue and orange tracings in Fig. 22-1B), the mitral valve opens. Immediately following mitral valve opening, left ventricular volume begins to increase rapidly (see Fig. 22-1B, bottom). During this period of rapid ventricular filling, the left atrial and ventricular pressures evolve in parallel because the mitral valve is wide open. A period of relatively decreased filling follows, the period of diastasis with which we began our discussion. Thus, diastole includes both the rapid ventricular filling period and diastasis. As already noted, the length of diastole decreases with elevations in heart rate. This decrease comes first at the expense of the period of slower ventricular filling (i.e., diastasis).
During rapid ventricular filling, the aortic valve remains closed. Because blood continues to flow out to the periphery, owing to the recoil of the aorta's elastic wall (see Box 22-2), the aortic pressure falls. This fall continues during diastasis.
The ECG, phonocardiogram, and echocardiogram all follow the cyclic pattern of the cardiac cycle
Accompanying the basic cyclic pattern of cardiac pressure and volume changes are characteristic mechanical, electrical, acoustic, and echocardiographic changes. Figure 22-2 illustrates these events for the left heart and the systemic circulation. Notice that the pressure records in the top panel of Figure 22-2 start with the atrial contraction—that is, slightly later than in Figure 22-1.
Aortic Blood Flow
Blood flow from the left ventricle to the ascending aorta (see Fig. 22-2, second panel from top) rises most rapidly during the rapid ejection phase of the left ventricle. The peaking of aortic flow defines the beginning of the decreased-ejection phase.
Jugular Venous Pulse
The third panel of Figure 22-2 includes the jugular venous pulse, for comparison with the timing of other events. We will discuss the jugular venous pulse below in the chapter.
Electrocardiogram
The ECG (see Fig. 22-2, fourth panel from top, and pp. 493–496) begins with the middle of the P wave (atrial depolarization). The QRS complex (ventricular depolarization) is the prelude to the upswing in ventricular pressure. The T wave (ventricular repolarization) occurs in the decreased-ejection phase.
Phonocardiogram and Heart Sounds
The opening and closing of the valves are accompanied by heart sounds (see Fig. 22-2, fifth panel from top), easily heard through a stethoscope or recorded with a digital stethoscope and stored as a phonocardiogram (Table 22-2). The dominant frequencies of heart sounds are lower (110 to 180 Hz) than those of heart murmurs (see Box 17-1), which result from turbulence (180 to 500 Hz). Each of the vertical dotted lines in Figure 22-2 indicates the movement of two valves, one on the right side of the heart and one on the left. Thus, two valves can contribute to a single heart sound, although the two components can often be separated by the ear. The phonocardiogram in Figure 22-2 shows the timing of the two major, or physiological, heart sounds (S1 and S2), as well as two other sounds (S3 and S4) that are occasionally heard.
TABLE 22-2
The Heart Sounds
|
SOUND |
DESCRIPTION |
ASSOCIATED EVENTS |
|
S1 |
First heart sound (sounds like “lub”) |
Closure of mitral and tricuspid valves |
|
S2 |
Second heart sound (sounds like “dub”) |
Closure of aortic and pulmonary valves |
|
OS |
Opening snap |
Opening of a stenotic mitral valve |
|
S3 |
Third heart sound |
Diastolic filling gallop or ventricular or protodiastolic gallop |
|
S4 |
Fourth heart sound |
Atrial sound that creates an atrial or presystolic gallop |
The physiological heart sounds S1 and S2 are heard following the closure of the cardiac valves: the mitral and tricuspid valves for S1, and the aortic and pulmonary valves for S2. However, the actual apposition of the valve leaflets (i.e., “slamming the door”) does not produce the sound. Instead, vibrations resulting from sudden tension in the AV valves and the adjacent ventricular walls produce the first heart sound, S1. Similarly, vibrations of the large vessel walls and columns of blood produce the second heart sound, S2, following closure of the semilunar valves. These vibrations propagate through adjacent tissues to the chest wall, where one can normally hear the first and second heart sounds through a stethoscope. S1 is usually stronger, longer, and of lower frequency than S2.
Although the four vertical lines that define the four phases of the cardiac cycle are very similar for the right and left sides of the hearts, they do not line up perfectly with one another, as can be seen by comparing Figure 22-1A and B. For example, the aortic valve usually closes just before the pulmonary valve. This timing difference produces the physiological splitting of the A2 (i.e., aortic) and P2 (i.e., pulmonary) components of the second heart sound. As we shall see below (see pp. 517–519), inspiration accentuates the splitting of S2. Pathological changes that accentuate the asynchrony between the left and right sides of the hearts (e.g., right bundle branch block) may also lead to splitting of the first heart sound.
With stiffening of the mitral valve, seen in mitral stenosis, the opening of the mitral valve may produce an additional sound, an opening snap (OS), in early diastole just after S2.
A physiological third heart sound, S3, is present in some normal individuals, particularly children. S3 occurs in early diastole when rapid filling of the ventricles results in recoil of ventricular walls that have a limited distensibility. An S3 also can be heard in adults when the ventricle is so overfilled at the end of systole that the addition of 70 mL more blood during diastole brings the ventricle into a volume range in which ventricular compliance is very low. The result is an accentuated recoil, heard as an S3. An S3 can originate from the left or the right side of the heart. A “gallop rhythm” is a grouping of three heart sounds that, together, sound like hoofs of a galloping horse. Thus, the addition of an S3 to the physiological S1 and S2 creates a three-sound sequence, S1-S2-S3, that is termed a protodiastolic gallop or ventricular gallop.
When present, a fourth heart sound, S4, coincides with atrial contraction. It is usually heard in pathological conditions in which an unusually strong atrial contraction occurs in combination with low compliance of the left ventricle. The addition of an S4 produces another three-sound sequence, S4-S1-S2, which is also a gallop rhythm, a presystolic gallop or atrial gallop.
Echocardiogram
We discussed echocardiography on page 427. The echocardiogram in the bottom panel of Figure 22-2 shows that the separation between the anterior and posterior leaflets of the mitral valve increases during atrial contraction. The leaflets meet at the beginning of phase 2 and remain together until rapid ventricular filling occurs in the beginning of phase 1, when the separation between leaflets becomes maximal. During the decreased phase of ventricular filling, the leaflets once again move closer together, until the next atrial contraction.
The cardiac cycle causes flow waves in the aorta and peripheral vessels
With the closing and opening of the heart's exit valves (i.e., pulmonary and aortic valves), blood flow and blood velocity across these valves oscillate from near zero, when the valves are closed, to high values, when the valves are open. Blood flow in the aortic arch actually oscillates between slightly negative and highly positive values (Fig. 22-3A, panel 1). Pressure in the aortic arch typically oscillates between ~80 and ~120 mm Hg (see Fig. 22-3B, panel 1), but varies greatly among individuals. Phasic changes in pressure and flow also occur in the peripheral arteries. Arterial pressure is usually measured in a large artery, such as the brachial artery (see p. 421). Because very little pressure drop occurs between the aorta and such a large, proximate artery, the measured systolic and diastolic arterial pressures, as well as the pulse pressure and mean arterial pressure (see p. 418), closely approximate the corresponding aortic pressures.
FIGURE 22-3 Flow (A) and pressure (B) profiles in the aorta and smaller vessels.
If blood vessels were rigid tubes, so that the resistance (R) were constant, and if the driving pressure (ΔP) were also constant throughout the cardiac cycle, we could describe blood flow (F) by a simple Ohm's law–like relationship, as we did in Equation 17-1. However, because blood vessels are compliant (so that R varies with pressure; see Fig. 19-7B) and because both aortic pressure and flow vary during the cardiac cycle, we cannot describe real arteries in this way. In the field of hydraulics, oscillating flows and pressures have not only an amplitude, but also a phase. As a result, the ratio ΔP/F is no longer resistance—a simple, time-independent quantity—but a complex quantity called the mechanical impedance ![]() N22-3 that depends on the classical “resistance” as well as the compliance and inertial properties of the vessels and blood.
N22-3 that depends on the classical “resistance” as well as the compliance and inertial properties of the vessels and blood.
N22-3
Mechanical Impedance of Blood Flow
Contributed by Emile Boulpaep
We began this chapter by drawing an analogy between the flow of blood and electrical current, as described by an Ohm's law of hydrodynamics: ΔP = F × R. We now know that there are other factors that influence pressure. In addition to the flow resistance R (electrical analogy = ohmic resistor), we must also consider the compliance C (electrical analogy = capacitance) as well as the inertiance L (electrical analogy = inductance). A similar problem is faced in electricity when dealing with alternating (as opposed to direct) currents. In Ohm's law for alternating currents, E = I × Z, where Z is a complex quantity called the impedance. Z depends on the electrical resistance R, the electrical capacitance C, and the electrical inductance L. Similarly, for blood flow, we can write ΔP = F × Z, where Z is also a complex quantity, called mechanical impedance, that includes the following:
1. Compliant impedance that opposes volume change (compliance of the vessel).
2. Viscous (or resistive) impedance that opposes flow (shearing forces in the liquid). This term is the R of Ohm's law of hydrodynamics: ΔP = F × R (see Equation 17-1).
3. Inertial impedance that opposes a change of flow (kinetic energy of fluid and vessels).
Considering all these sources of pressure, we can state that the total pressure difference at any point in time, instead of being given by Ohm's law, is
![]() (NE 22-1)
(NE 22-1)
The Pgravity term in the above equation is discussed on pages 418–419 in the section titled “Gravity Causes a Hydrostatic Pressure Difference When There Is a Difference in Height.”
Because of these resistive, compliant, and inertial properties, the pressure and flow waves in vessels distal to the aorta are not quite the same as in the aorta. Instead, the farther the vessels are from the aorta, the more different the pressure and flow waves become.
Aortic Arch
During the rapid-ejection phase, peak flow through the aortic arch is remarkably high, ~30 L/min (dark beige band in Fig. 22-3A, panel 1). The peak linear velocity is ~100 cm/s, which makes it more likely that the blood will reach the critical Reynolds number value for turbulence (see p. 416). The rapid ejection of blood also causes a rapid rise of the pressure in the aorta to above that in the ventricle (see Fig. 22-3B, panel 1). Even though the pressure gradient across the valve reverses, the valve does not close, as is evidenced by the continuous flow of blood from the ventricle into the aorta. The reason that flow continues in the forward direction is the inertial component of the blood flow, which represents considerable kinetic energy. Eventually, blood in the aortic arch decelerates sufficiently that the flow becomes zero and eventually negative (producing reflux through the valve). As the aortic valve closes, it produces the dicrotic notch in the aortic pressure trace.
Thoracic-Abdominal Aorta and Large Arteries
Just distal to the aortic arch, a transformation of the flow and pressure curves begins to occur. The records in panels 2 through 4 in Figure 22-3A show the flow curves for the abdominal aorta and some of its large branches. Peak systolic flow becomes smaller as one moves from the aorta toward the periphery (i.e., iliac and femoral arteries), as would be predicted because of the branching of the vessels. However, in the abdominal aorta, a new phenomenon is seen. As the elastic aorta—which stored blood during systole—releases blood during diastole, a second peak of flow appears. Note that this diastolic component of flow is larger in the abdominal aorta than in the more distal iliac artery, and is almost absent in the femoral artery. Of particular importance is the sizable diastolic flow in the carotid and renal arteries (see Fig. 22-3A, panels 5 and 6). The basis for the diastolic component of flow is the subject of Box 22-2.
Box 22-2
Effect of Aortic Compliance on Blood Flow
There is a large diastolic component to total blood flow in the large arteries that lie close to the aorta, such as the carotid and renal arteries (see Fig. 22-3A, panels 5 and 6). This sizeable diastolic component is largely the result of the high compliance of the vessel walls and the radial expansion of the vessels that occurs during ventricular ejection. We can reach at least an intuitive understanding of the radial contribution to flow in the aorta and large arteries by examining the ability of the aorta to store and to give up energy during the acceleration and deceleration of flow.
Figure 22-4 compares two branches of a hydraulic system that are identical in radius and length. One branch (branch 1) is rigid and made of glass; the other (branch 2) is elastic and made of rubber. Both branches terminate in a spout with an outflow resistance that is analogous to the resistance of arterioles. We assume that the resistance of the spout is much greater than that of the glass or rubber tube, so that we can ignore the effect of small changes in the diameter of the rubber tube on overall resistance. If we apply a steady pressure to both branches, the flows through the two branches are continuous and identical (see Fig. 22-4A).
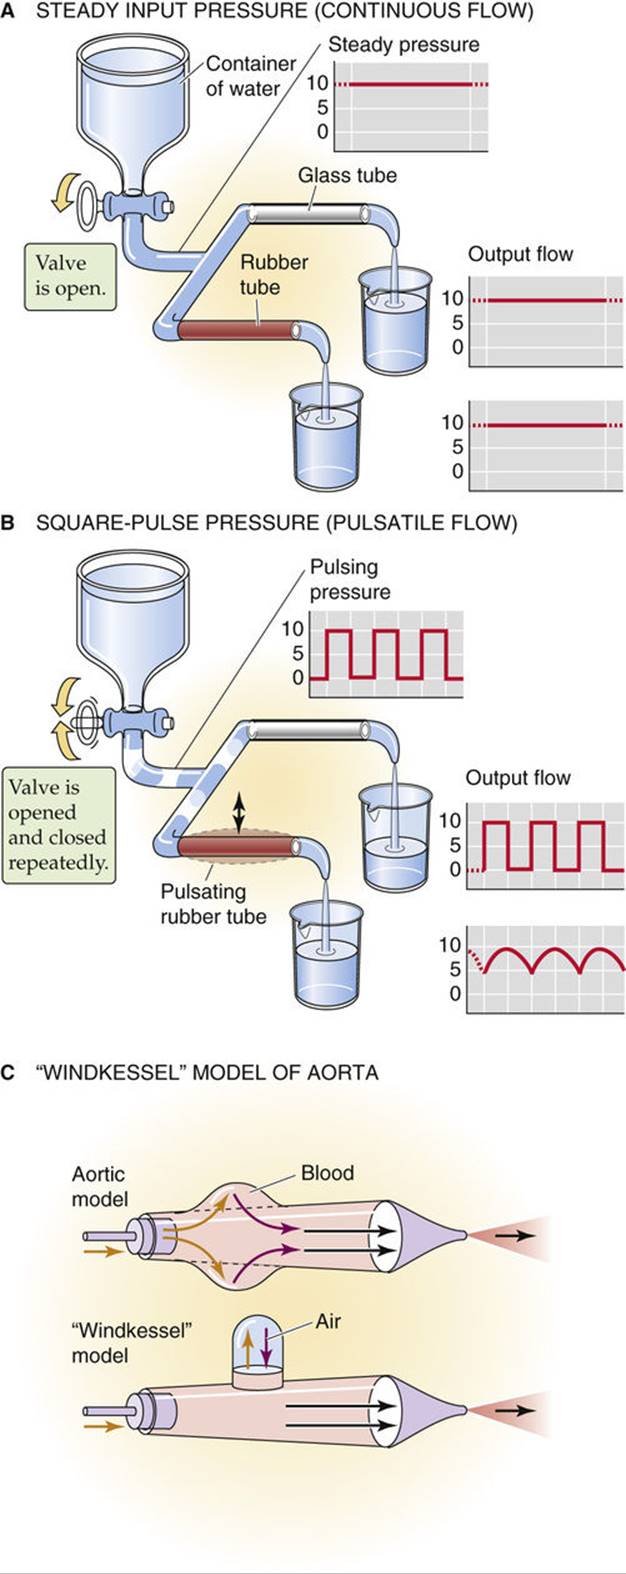
FIGURE 22-4 Effect of pulsatile pressure on flow through a compliant vessel. In C, the gold arrows indicate movements analogous to systole, and the violet arrows, movements analogous to diastole.
However, if we apply the pressure in square pulses, the flows in the two branches are quite different (see Fig. 22-4B). The flow through the glass tubing instantly rises to a maximum value with the onset of the pressure wave, and then instantly falls to zero when the driving pressure falls to zero. Thus, the plot of flow through the glass tube perfectly mirrors the plot of the applied square-wave pressure. The flow through the rubber tube has a very different profile. During the interval of peak pressure, the rubber vessel gradually dilates, storing a volume of fluid. Therefore, the flow rises slowly to its maximum value. During the interval of the cycle when the driving pressure falls to zero, the expanded rubber vessel delivers its stored volume downstream, which results in some forward flow despite the absence of any pressure head. The time-averaged outflow from the rubber tube exceeds that from the glass tube.
The aorta and large vessels behave like the rubber tube in Figure 22-4B. The oscillating pressure head in our model (i.e., between zero and a peak value) represents ventricular pressure. The maintenance of flow during interruption of the pressure head is equivalent to the continuing flow from the aorta during diastole.
Figure 22-4C shows an alternative mechanical model, that of a Windkessel (German for “wind chamber”), in which we replace the compliance of a distensible rubber tube with the compressible air within a chamber above the blood.
The two models illustrated in Figure 22-4B and C show how compliant blood vessels can convert discontinuous flow into a more continuous flow. The so-called Windkessel action of the arterial system considerably improves the efficiency of the pump (i.e., the heart) because the vessels are able to convert the phasic flow peaks of the pump into a more continuous flow.
The cardiac cycle also causes pressure waves in the aorta and peripheral vessels
The pressure curves in Figure 22-3B show that, with increasing distance from the heart (panels 1 to 4), the rising portion of the wave becomes steeper and the peak narrower. Because the peak gradually increases in height and the minimum pressure gradually decreases, the pulse pressure becomes greater. With increasing distance from the heart, an important secondary pressure oscillation appears during diastole (see Fig. 22-3B, fourth panel). Thus, although the pressure waves are distorted, they are not damped. Although it might seem counterintuitive that the peak arterial pressure should increase as we get farther from the heart (Is the blood flowing against a pressure gradient?), it turns out that the mean arterial pressure does fall very slightly with increasing distance from the heart.
Terminal Arteries and Arterioles
In the smallest arteries, the flows must be small. Here, the trend toward an increased peak pressure reverses. Instead, the pulse wave gets damped out for two reasons. First, because we are dealing with many parallel vessels with a large aggregate wall area, the aggregate compliance increases, damping the pressure wave. Second, because these smaller arteries have a smaller radius and thus a far greater resistance, the mean arterial pressure must fall in proportion to the much higher resistance. Thus, in contrast to the situation in the larger arteries, damping predominates over distortion.
Capillaries
By the time the blood reaches the capillaries, the damping is so severe that pulsations (i.e., pressure oscillations) do not normally occur—blood flow is continuous. The pulmonary capillaries are an exception; their upstream vessels are short, and they have low resistance and high compliance. The pulsation of systemic capillaries occurs only in cases of markedly increased pulse pressure, such as in patients with aortic regurgitation or hyperthyroidism, or in cases of generalized peripheral vasodilation.
Distortion of pressure waves is the result of their propagation along the arterial tree
Imagine that you are listening to a patient's heart with a stethoscope while simultaneously feeling the pulse of the radial artery near the wrist. For each heartbeat that you hear, you feel a radial pulse. You know that the peak pressure in the left ventricle occurs about midway between the first and second heart sounds, but the delay between the midpoint of the two heart sounds and the peak of the radial pulse is only ~0.1 s. Red blood cells (RBCs) take several seconds to flow from the heart to the wrist. Why, then, are you able to feel the pulse so soon after the heartbeat?
The answer is that the blood vessels conduct the palpable pulse as a pressure wave. The linear velocity of RBCs—carried in the blood by convection—ranges from ~1 m/s in the aorta to vanishingly small values in the capillaries (see p. 448). However, the pressure wave travels at a velocity of 5 to 6 m/s in the aorta, increasing to 10 to 15 m/s in the small arteries.
The following example illustrates the difference between the velocity of a pressure wave and that of convection. Imagine that two people are submerged in a river, floating downstream (convection). Now the person upstream makes a sound under water. The sound waves (an example of a pressure wave) travel to the person downstream with a velocity that is far greater than the velocity of the river.
We can illustrate how pressure waves propagate along arteries by replotting the arterial pressure profiles from Figure 22-3B and stacking them one on top of the other. The four pressure waves in Figure 22-5 actually represent data obtained simultaneously in a dog with four catheters, the first placed in the aortic arch and the last three, each placed precisely 10 cm downstream from the previous one. The downstream propagation of the wave through the larger arteries is accompanied by a serious distortion of the pressure profile: it gets narrower and taller as we move downstream.
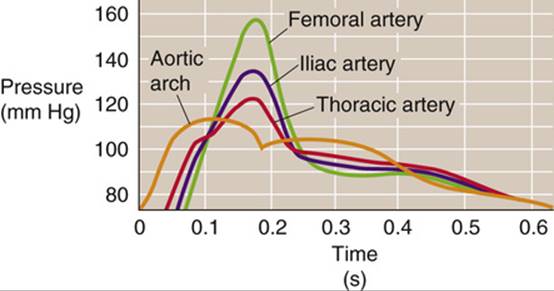
FIGURE 22-5 Arterial pressure waves. These simultaneous pressure records are from a dog, with catheters placed at 0, 10, 20, and 30 cm from the aortic arch. As the wave moves down the vessel, the upstroke is delayed, but the peak is higher.
Effect of Frequency on Wave Velocity and Damping
The pressure wave ![]() N22-4 moving from the aorta to the periphery is actually an ensemble of many individual waves, each with its own frequency. Higher-frequency waves travel faster and undergo more damping than low-frequency waves (Fig. 22-6A). Recombination of these waves at a more peripheral site thus produces a new wave with a shape that is a distorted version of the original aortic wave.
N22-4 moving from the aorta to the periphery is actually an ensemble of many individual waves, each with its own frequency. Higher-frequency waves travel faster and undergo more damping than low-frequency waves (Fig. 22-6A). Recombination of these waves at a more peripheral site thus produces a new wave with a shape that is a distorted version of the original aortic wave.
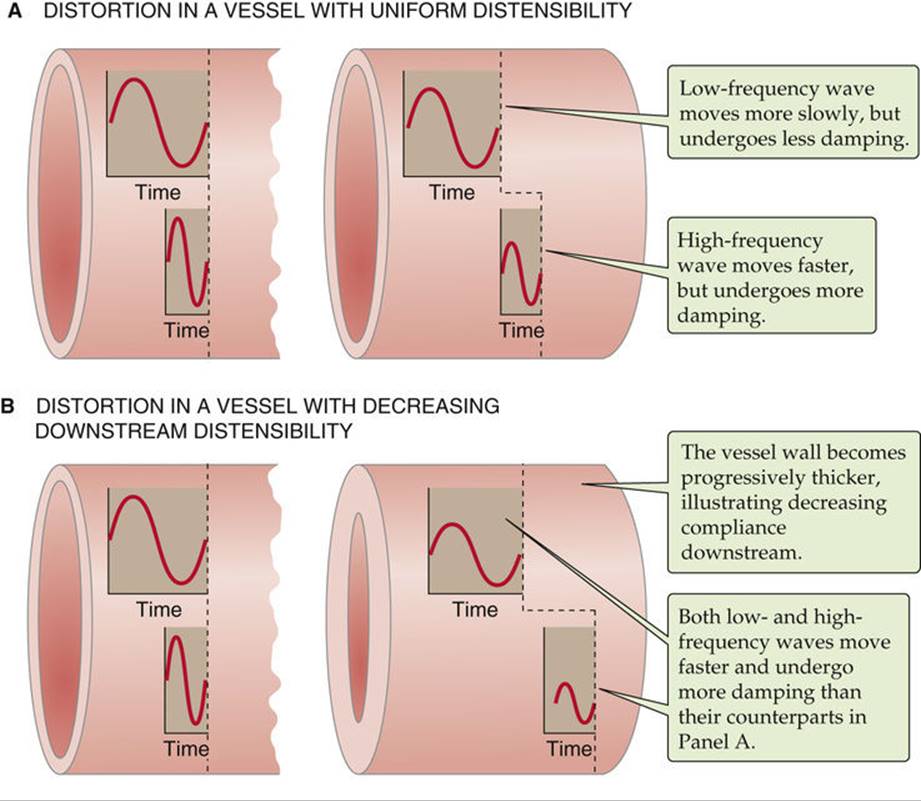
FIGURE 22-6 Propagation of pressure waves. In A and B, the flow is from left to right. The left pair of pressure waves is at the same early time, whereas the right pair of pressure waves is at the same late time. If on the right (i.e., end of the vessel) we sum waves of different frequencies at the same instant in time, then the composite wave is distorted (like the green femoral artery curve in Fig. 22-5).
N22-4
Distortion of Propagated Waves
Contributed by Emile Boulpaep
The peak of the arterial pressure profile gets taller and sharper as we move away from the heart (see Fig. 22-5). There are three major reasons for this:
1. The higher-frequency components of the wave travel faster. The pressure wave in the arch of the aorta is far more complex than a simple sine or cosine wave. Nevertheless, we can think of the complex waveform in the aortic arch as being the algebraic sum of many individual sine and cosine waves, each with its own amplitude, frequency, and phase (i.e., how much the wave's peak is shifted left or right along the time axis). The precise mathematical method by which complex waveforms are broken down into simpler components is called Fourier analysis. It turns out that waves of higher frequency propagate with a greater velocity than waves of lower frequency. Thus, the farther the high- and low-frequency waves travel down the vessel, the more separated they become from one another (a process termed dispersion; see Fig. 22-6A). It also turns out that even if we examine a single sine wave—which, of course, has a single frequency—the position of the peak will shift backward as the wave travels down the vessel (this is called a phase shift). The magnitude of the phase shift increases with increasing frequency. Furthermore, the blood vessels produce more damping on the peaks of higher-frequency waves than on those of low-frequency waves (see Fig. 22-6A). When we sum these various effects on the sine-wave and cosine-wave components downstream, the reconstructed pressure wave has a different (i.e., distorted) shape compared with the original wave.
2. The vessels become stiffer toward the periphery, increasing wave velocity, especially for higher-frequency components. Vessel walls become stiffer progressing down the vascular tree. The smaller peripheral vessels have a thicker wall relative to their luminal diameter. Waves propagate faster in stiff vessels than in compliant ones. Thus, pressure waves travel faster in smaller arteries. Increased stiffness speeds up high-frequency waves more than low-frequency ones (see Fig. 22-6B).
3. The pressure waves bounce off the end of the arterial tree and reflect back up the vessels. The vascular circuit is not infinite, nor does the end of the vasculature have a device that completely absorbs a transmitted pressure wave. Therefore, some of the wave must reflect back up the artery and sum with the waves traveling in the forward direction. By themselves, reflected waves are not large enough to explain the large distortions in the arterial pressure profile. Moreover, if the wave distortions were due only to reflections, then the reflections at any one point in the vascular tree would have to be stable with time (i.e., the reflections would have to create a “standing wave”). However, the vascular tree is far too short to create standing waves of the appropriate frequencies. In addition, to create a standing wave, the heart would have to beat with an absolutely invariant rhythm, which, of course, is not the case. Thus, reflections make only a small contribution to the distortion.
Effect of Wall Stiffness on Wave Velocity
As the pressure wave ![]() N22-4 reaches vessels that have a stiffer wall (e.g., greater ratio of wall thickness to vessel diameter), the velocity of the wave increases (see Fig. 22-6B). Conversely, with a more compliant vessel, some of the energy of the pressure pulse goes into dilation of the vessel, so that the pressure wave spreads out and slows down. Because aging causes a decrease in vessel compliance (i.e., distensibility), the velocity of propagation actually increases.
N22-4 reaches vessels that have a stiffer wall (e.g., greater ratio of wall thickness to vessel diameter), the velocity of the wave increases (see Fig. 22-6B). Conversely, with a more compliant vessel, some of the energy of the pressure pulse goes into dilation of the vessel, so that the pressure wave spreads out and slows down. Because aging causes a decrease in vessel compliance (i.e., distensibility), the velocity of propagation actually increases.
Pressure waves in veins do not originate from arterial waves
We have seen above in this chapter that flow in capillaries is usually not pulsatile. Nevertheless, blood flow in systemic capillaries can exhibit slow oscillations unrelated to the cardiac cycle. The action of upstream vasomotor control elements in arterioles and precapillary sphincters can cause fluctuations. In addition, changes in tissue pressure (e.g., caused by muscle contraction) can compress capillaries and cause further fluctuations in capillary flow. Pulmonary capillaries are especially susceptible to changes in the surrounding alveolar pressure (see pp. 687–689).
Although systemic veins have pressure waves, these waves do not originate from arterial waves propagating through the capillary beds, which are nonpulsatile. Three mechanisms can contribute to the venous pulse: (1) retrograde action of the heartbeat during the cardiac cycle, (2) the respiratory cycle, and (3) the contraction of skeletal muscles.
Effect of the Cardiac Cycle
A large vein close to the heart, such as the jugular vein, has a complex pulse wave (Fig. 22-7A) synchronized to the cardiac cycle. The three maxima, or peaks, in the jugular pulse wave are labeled a, c, and v. The three minima, or dips, are labeled av, x, and y. These pressure transients reflect events in the cardiac cycle:
• The a peak is caused by the contraction of the right atrium.
• The av minimum is due to relaxation of the right atrium and closure of the tricuspid valve.
• The c peak reflects the pressure rise in the right ventricle early during systole and the resultant bulging of the tricuspid valve—which has just closed—into the right atrium.
• The x minimum occurs as the ventricle contracts and shortens during the ejection phase later in systole. The shortening heart—with tricuspid valve still closed—pulls on and therefore elongates the veins, lowering their pressure.
• The v peak is related to filling of the right atrium against a closed tricuspid valve, which causes right atrial pressure to rise. As the tricuspid valve opens, the v peak begins to wane.
• The y minimum reflects a fall in right atrial pressure during rapid ventricular filling, as blood leaves the right atrium through an open tricuspid valve and enters the right ventricle. The increase in venous pressure after the y minimum occurs as venous return continues in the face of reduced ventricular filling.
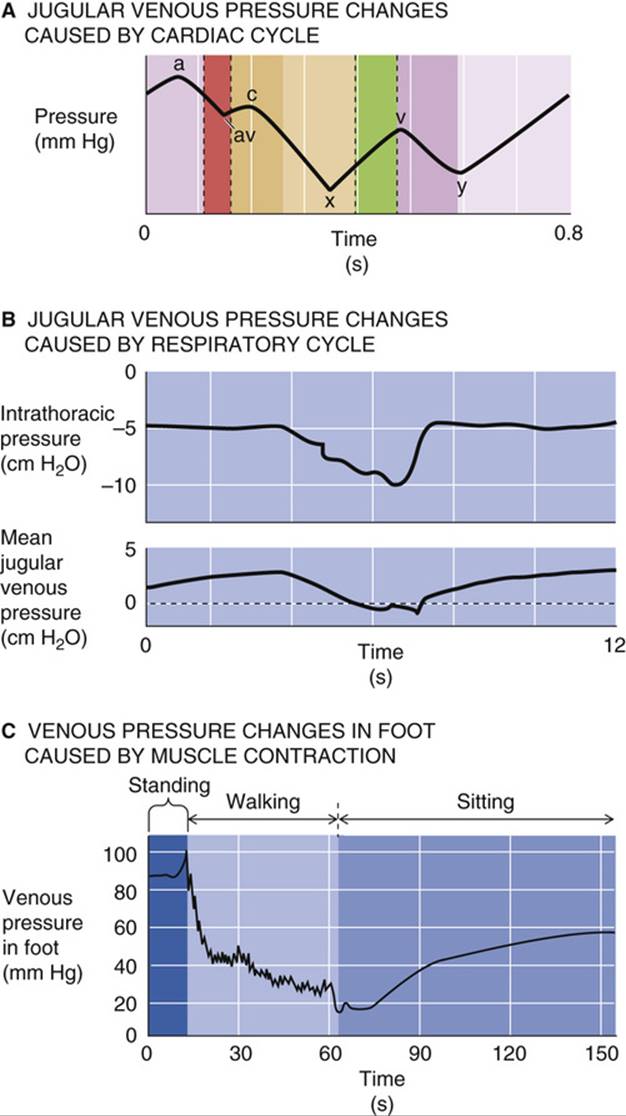
FIGURE 22-7 Venous pressure changes. In A, the time scale is a single cardiac cycle. The relative heights of the peaks and valleys are variable. In B, the time scale surrounds one protracted inspiration (i.e., several heartbeats); the y-axis in the lower panel shows the mean jugular venous pressure. (B, Data from Brecher GA: Venous Return. New York, Grune & Stratton, 1956; C, data from Pollack AA, Wood EH: Venous pressure in the saphenous vein at the ankle in man during exercise and changes in posture. J Appl Physiol 1:649–662, 1949.)
Effect of the Respiratory Cycle
Poiseuille was the first to observe that the pressure in the jugular vein becomes negative during inspiration (see Fig. 22-7B). During inspiration, the diaphragm descends, causing intrathoracic pressure (and therefore the pressure inside the thoracic vessels) to decrease and intra-abdominal pressure to increase (see p. 607). Consequently, the venous return from the head and upper extremities transiently increases, as low-pressure vessels literally suck blood into the thoracic cavity. Simultaneously, the venous flow decreases from the lower extremities because of the relatively high pressure of the abdominal veins during inspiration. Therefore, during inspiration, pressure in the jugular vein falls while pressure in the femoral vein rises.
Effect of Skeletal Muscle Contraction (“Muscle Pump”)
The contraction of skeletal muscle can also affect pressure and flow in veins. Large veins in the lower limbs are equipped with valves that prevent retrograde movement of blood (see p. 419). When a person is at rest and in the recumbent position, all venous valves are open and venous blood flow toward the heart is continuous. Standing causes the venous pressure in the foot to rise gradually to the hydrostatic pressure dictated by the vertical blood column from the foot to the heart (see Fig. 22-7C). If the person begins to walk, the combination of the pumping action of the leg muscles on the leg veins and the action of the venous valves as hydrostatic relay stations causes the venous pressure in the foot to decrease. Each step causes both a small oscillation and a small net decrease in foot vein pressure. Once foot vein pressure has bottomed out, each step simply causes a small pressure oscillation. Walking causes a net decrease in pressure in both the superficial and deep foot veins, as well as in the corresponding capillaries. When the exercise ceases, the venous pressure again rises.