The amount of O2 dissolved in blood is far too small to meet the metabolic demands of the body
Blood carries oxygen in two forms. More than 98% of the O2 normally binds to hemoglobin within the erythrocytes, also known as red blood cells or RBCs (see pp. 434–435). A tiny fraction physically dissolves in the aqueous phases of both blood plasma and the cytoplasm of blood cells (predominantly RBCs). What is the significance of the O2 that is bound to hemoglobin?
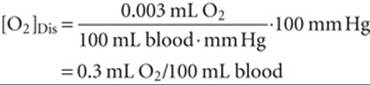
Imagine that we expose a liter of blood plasma, initially free of O2, to an atmosphere having the same ![]() as alveolar air—100 mm Hg. Oxygen will move from the atmosphere to the plasma until an equilibrium is established, at which time the concentration of dissolved O2 ([O2]Dis) in the blood obeys Henry's law (see p. 593):
as alveolar air—100 mm Hg. Oxygen will move from the atmosphere to the plasma until an equilibrium is established, at which time the concentration of dissolved O2 ([O2]Dis) in the blood obeys Henry's law (see p. 593):
![]()
(29-1)
If we express ![]() in units of mm Hg at 37°C and [O2]Dis in units of (mL of O2 gas)/(dL of blood), then the solubility
in units of mm Hg at 37°C and [O2]Dis in units of (mL of O2 gas)/(dL of blood), then the solubility ![]() is ~0.003 mL O2/(dL of blood · mm Hg). For arterial blood,
is ~0.003 mL O2/(dL of blood · mm Hg). For arterial blood,
(29-2)
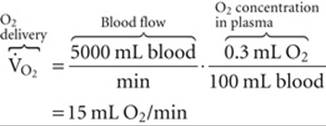
Is such an O2-carrying capacity adequate for supplying O2 to the systemic tissues? If these tissues could extract all the O2 dissolved in arterial blood so that no O2 remained in venous blood, and if cardiac output (see p. 414) were 5000 mL/min, then—according to the Fick principle (see p. 423)—the delivery of dissolved O2 to the tissues would be
(29-3)
However, the average 70-kg human at rest consumes O2 at the rate of ~250 mL/min. Dissolved O2 could supply the body's metabolic demands only if cardiac output increased by a factor of 250/15, or nearly 17-fold! Thus, the body cannot rely on dissolved O2 as a mechanism for O2 carriage.
Hemoglobin consists of two α and two β subunits, each of which has an iron-containing “heme” and a polypeptide “globin”
Normal adult hemoglobin (Hb) is a tetramer having a molecular weight of ~68 kDa, each monomer consisting of a heme and a globin (Fig. 29-1A). The heme is a porphyrin compound coordinated to a single iron atom. The globin is a polypeptide, either an α chain (141 amino acids) or a β chain (146 amino acids). The homology between the α and β chains is sufficient that they have similar conformations, a series of seven helices enveloping a single heme. Thus, the complete Hb molecule has the stoichiometry [α(heme)]2[β(heme)]2 and can bind as many as four O2 molecules, one for each iron atom. The erythroblasts (see pp. 431–433) that synthesize Hb closely coordinate the production of α chains, β chains, and heme.
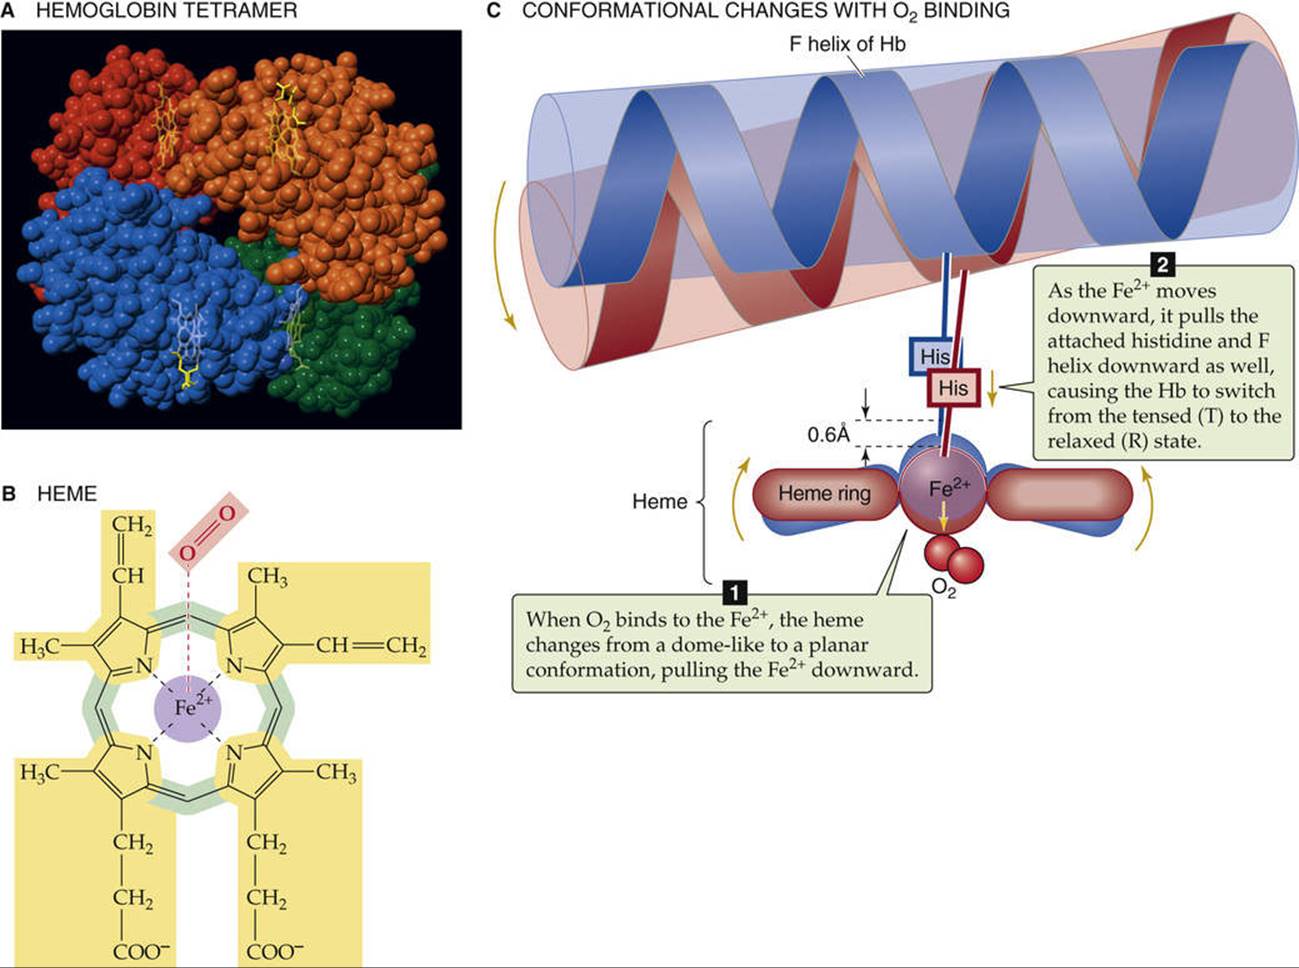
FIGURE 29-1 Structure of hemoglobin.
Heme is a general term for a metal ion chelated to a porphyrin ring. In the case of Hb, the metal is iron in the Fe2+ or ferrous state (see Fig. 29-1B). The porphyrin consists of four linked pyrrole rings that, through their nitrogen atoms, coordinate a single, centrally located Fe2+. Because the iron-porphyrin complex is rich in conjugated double bonds, it absorbs photons of relatively low energy (i.e., light in the visible range). The interaction among O2, Fe2+, and porphyrin causes the complex to have a red color when fully saturated with O2 (e.g., arterial blood) and a purple color when devoid of O2 (e.g., venous blood).
Hb can bind O2 only when the iron is in the Fe2+ state. The Fe2+ in Hb can become oxidized to ferric iron (Fe3+), either spontaneously or under the influence of compounds such as nitrites or sulfonamides. The result of such an oxidation is methemoglobin (metHb), which is incapable of binding O2. Inside the RBC, a heme-containing enzyme methemoglobin reductase uses the reduced form of nicotinamide adenine dinucleotide (NADH) to reduce metHb back to Hb, so that only about 1.5% of total Hb is in the metHb state. In the rare case in which a genetic defect results in a deficiency of this enzyme, ![]() N29-1 metHb may represent 25% or more of the total Hb. Such a deficiency results in a decreased O2-carrying capacity, leading to tissue hypoxia.
N29-1 metHb may represent 25% or more of the total Hb. Such a deficiency results in a decreased O2-carrying capacity, leading to tissue hypoxia.
N29-1
Methemoglobinemia
Contributed by Walter Boron
An increase in the amount of Hb with its iron in the oxidized or Fe3+ (i.e., ferric) state is known as methemoglobinemia. As discussed on pages 647–648, the problem that arises is that, with Fe3+ in the porphyrin ring of Hb, O2 cannot bind, and there is a consequent reduction in the O2 carrying capacity of the blood. The Fe2+ (i.e., ferrous) iron of Hb spontaneously oxidizes to Fe3+, and a family of methemoglobin reductase enzymes normally returns the Hb to the ferrous state.
Methemoglobinemia can arise in three ways:
1. Mutant M forms of Hb. Normally the globin moiety of Hb cradles the porphyrin ring in such a way as to limit the accessibility of O2 to the Fe2+. In M forms of Hb (at least eight of which have been identified), point mutations in the α or β globin chains allow the O2 to approach the Fe2+ more closely and to oxidize—rather than to bind to—the Fe2+. This action shifts the balance between the normally slow rate of oxidation and reductase activity toward the formation of Fe3+.
2. Genetic deficiency (autosomal recessive) of one or both of the splice variants of methemoglobin reductase enzymes. The enzyme is reduced nicotinamide adenine dinucleotide (NADH)–cytochrome b5 reductase (cytb5: E.C.1.6.2.2). Two splice variants, differing in the N-terminal region, are present: (a) a soluble form with 275 amino acids, and (b) a membrane-bound form with 300 amino acids. The membrane-bound form is present mainly in the endoplasmic reticulum and mitochondrial outer membrane, where it is important for a variety of reactions (i.e., synthesis of fatty acids and cholesterol, P-450–mediated drug metabolism). A deficiency in the soluble form of RBCs—usually caused by missense mutations that reduce enzyme stability—causes type I methemoglobinemia, which is usually not severe. A deficiency in the membrane-bound form causes type II methemoglobinemia, which can cause severe mental retardation and neurological problems. The type I disease can be treated with the reducing agents ascorbic acid and methylene blue, either singly or together.
3. Toxin-induced oxidation of the Fe2+ in Hb. Oxidation of the Fe2+ of Hb to Fe3+ can occur by three routes: (a) direct oxidation, promoted under hypoxic conditions; (b) indirect oxidation in the presence of bound O2, a mechanism that is important in the methemoglobinemia produced by nitrite; and (c) drug-induced oxidation, in which drug metabolites of compounds (e.g., aminobenzenes and nitrobenzenes) promote the oxidation.
References
Percy MJ, McFerran NV, Lappin TRJ. Disorders of oxidized haemoglobin. Blood Rev. 2005;19:61–68.
Prchal JT, Borgese N, Moore MR, et al. Congenital methemoglobinemia due to methemoglobin reductase deficiency in two unrelated American Black families. Am J Med. 1990;89:516–522.
The environment provided by the globin portion of Hb is crucial for the O2-heme interaction. To be useful, this interaction must be fully reversible under physiological conditions, allowing repetitive capture and release of O2. The interaction of O2 with free Fe2+ normally produces Fe3+, the simplest example of which is rust. Even with isolated heme, O2 irreversibly oxidizes Fe2+ to Fe3+. However, when heme is part of Hb, interactions with ~20 amino acids cradle the heme in the globin, so that O2 loosely and reversibly binds to Fe2+. The crucial residue is a histidine that bonds to the Fe2+ and donates negative charge that stabilizes the Fe2+-O2 complex. This histidine is also crucial for transmitting, to the rest of the Hb tetramer, the information that an O2 molecule is or is not bound to the Fe2+. When all four hemes are devoid of O2, each of the four histidines pulls its Fe2+ above the plane of its porphyrin ring by ~0.06 nm (the blue conformation in Fig. 29-1C), distorting the porphyrin ring. Thus, the Fe2+-histidine bond is under strain in deoxyhemoglobin, a strain that it transmits to the rest of the α or β subunit, and thence to the rest of the Hb molecule. The various components of the Hb tetramer are so tightly interlinked, as if by a snugly fitting system of levers and joints, that no one subunit can leave this tensed (T) state unless they all leave it together. Because the shape of the heme in the T state sterically inhibits the approach of O2, empty Hb has a very low affinity for O2.
When one O2 binds to one of the Fe2+ atoms, the Fe2+ tends to move down into the plane of the porphyrin ring. If the Fe2+ actually could move, it would flatten the ring and relieve the strain on the Fe2+-histidine bond. When enough O2 molecules bind, enough energy builds up and all four subunits of the Hb simultaneously snap into the relaxed (R) state, whether or not they are bound to O2. In this R state, with its flattened heme, the Hb molecule has an O2 affinity that is ~150-fold greater than that in the T state. Thus, when ![]() is zero, all Hb molecules are in the T state and have a low O2 affinity. When
is zero, all Hb molecules are in the T state and have a low O2 affinity. When ![]() is very high, all Hb molecules are in the R state and have a high O2 affinity. At intermediate
is very high, all Hb molecules are in the R state and have a high O2 affinity. At intermediate ![]() values, an equilibrium exists between Hb molecules in the T and R states.
values, an equilibrium exists between Hb molecules in the T and R states.
Myoglobin (Mb) is another heme-containing, O2-binding protein that is specific for muscle (see p. 249). The globin portion of Mb arose in a gene duplication event from a primordial globin. Additional duplications along the non-Mb branch of the globin family led first to the α and β chains of Hb, and then to other α-like and β-like chains (Box 29-1). Mb functions as a monomer, homologous to either an α or a β chain of Hb. Although capable of binding only a single O2 molecule, Mb has a much higher O2 affinity than Hb. In the capillaries, Hb can thus hand off O2 to an Mb inside a muscle cell; this Mb then transfers its O2 to the next Mb, and so on, which speeds diffusion of O2 through the muscle cell. Because of the low solubility of O2, this action is essential: There is insufficient dissolved O2, by itself, to establish an intracellular O2 gradient large enough to deliver adequate O2 to mitochondria.
Box 29-1
Forms of Hemoglobin
The normal adult form of hemoglobin (α2β2), known as HbA, is only one of several normal forms that are present in prenatal or postnatal life. Some of these other hemoglobins contain naturally occurring α-like chains (e.g., α and ζ) or β-like chains (e.g., β, γ, δ, and ε), whereas others reflect post-translational modifications. Three genes for α-like chains (all encoding 141 amino acids) cluster on chromosome 16: At the 5′ end of the cluster is one gene for a ζ chain, followed by two for the α chain. Pseudogenes for ζ and α are also present. Five genes for β-like chains (all encoding 146 amino acids) are clustered on chromosome 11: Starting at the 5′ end is one for ε, followed by two for γ (γG encoding for glycine at position 136, γA for alanine), and one each for δ and β. A pseudogene for β is also present. A locus control region regulates the expression of these β-like chains during development (see pp. 80–81).
The four prenatal hemoglobins (Table 29-1) consist of various combinations of two α-like chains (e.g., α and ζ) and two β-like chains (e.g., ε and γ). Very early in life, when erythropoiesis occurs in the yolk sac, the hemoglobin products are the three embryonic hemoglobins. When erythropoiesis shifts to the liver and spleen at ~10 weeks' gestation, the hemoglobin product is fetal hemoglobin, or HbF (α2γ2). Erythrocytes containing HbF have a higher O2 affinity than those containing HbA, owing to special properties of γ chains. The newborn's blood contains both HbA and HbF; the latter gradually falls by 1 year of age to the minute levels that are characteristic of the adult (rarely >1% to 2% of total hemoglobin). With severe stress to the erythroid system—such as marked hemolysis (see p. 429), bone marrow failure, or recovery from bone marrow transplantation—immature erythroid precursors may be forced to mature before they have differentiated sufficiently to produce HbA. In these conditions, circulating levels of HbF may increase considerably. In some hereditary cases, normal HbF persists in the adult, with no clinically significant consequences.
TABLE 29-1
Subunit Structures of Prenatal and Minor-Component Hemoglobins
|
Hb |
α-LIKE SUBUNIT |
β-LIKE SUBUNIT |
TIME OF EXPRESSION |
|
Gower 1 |
ζ |
ε |
Embryonic |
|
Gower 2 |
α |
ε |
Embryonic |
|
Portland |
ζ |
γ |
Embryonic |
|
HbF (fetal) |
α |
γ |
Fetal |
|
HbA2 |
α |
δ |
Postnatal |
|
HbA (adult) |
α |
β |
Postnatal |
Even adult blood contains several normal minor-component hemoglobins (Table 29-2), which account for 5% to 10% of the total blood hemoglobin. In HbA2 (~2.5% of total hemoglobin), δ chains replace the β chains of HbA. Although the physiological significance of HbA2 is unknown, the δ chains reduce the sickling of sickle hemoglobin (see below). Three other minor-component hemoglobins are the result of the nonenzymatic glycosylation of HbA. HbA1a, HbA1b, and HbA1c form when intracellular glucose-6-phosphate reacts with the terminal amino groups of the β chains of HbA. In poorly controlled diabetes mellitus, a disease characterized by decreased insulin or insulin sensitivity (see Box 51-5), blood glucose concentrations rise and, with them, intracellular concentrations of glucose-6-phosphate. As a result, glycosylated hemoglobins may represent 10% or more of the total hemoglobin. Because hemoglobin glycosylation is irreversible, and because the RBC has a mean lifetime of 120 days, levels of these glycosylated hemoglobins are clinically useful for assessing the long-term control of blood glucose levels in diabetics.
TABLE 29-2
Makeup of Total Hb in Adult Human Blood
|
Hb TYPE |
FRACTION OF TOTAL Hb |
|
HbA |
~92% |
|
HbA1a |
0.75% |
|
HbA1b |
1.5% |
|
HbA1c |
3%–6% |
|
HbA2 |
2.5% |
|
Total |
100% |
Numerous abnormal hemoglobins exist, most of which are caused by single-amino-acid substitutions on one of the polypeptide chains. One of the most clinically important is HbS, or sickle hemoglobin, in which a valine replaces the glutamate normally present at position 6 of the β chain. Although oxygenated HbS has a normal solubility, deoxygenated HbS is only about half as soluble as deoxygenated HbA. As a result, in low-O2 environments, HbS can crystallize into long fibers, giving the cells a sickle-like appearance. The sickled erythrocytes may disrupt blood flow in small vessels, causing many of the acute symptoms of “sickle cell crisis,” including pain, renal dysfunction, retinal bleeding, and aseptic necrosis of bone. In addition, sickle cells are prone to hemolysis (mean lifetime, <20 days), which leads to a chronic hemolytic anemia.
The Hb-O2 dissociation curve has a sigmoidal shape because of cooperativity among the four subunits of the Hb molecule
Imagine that we expose whole blood (see pp. 429–431) to a gas phase with a ![]() that we can set at any one of several values (Fig. 29-2). For example, we could incubate the blood with a
that we can set at any one of several values (Fig. 29-2). For example, we could incubate the blood with a ![]() of 40 mm Hg, typical of mixed-venous blood, and centrifuge a sample to separate plasma from erythrocytes, as one would for determining hematocrit (see pp. 102 and 429). Next, we could individually determine the O2 content of the plasma (i.e., dissolved O2) and packed RBCs. If we know how much water is inside the RBCs, we can subtract the amount of O2 dissolved in this water from the total O2, arriving at the amount of O2 bound to Hb.
of 40 mm Hg, typical of mixed-venous blood, and centrifuge a sample to separate plasma from erythrocytes, as one would for determining hematocrit (see pp. 102 and 429). Next, we could individually determine the O2 content of the plasma (i.e., dissolved O2) and packed RBCs. If we know how much water is inside the RBCs, we can subtract the amount of O2 dissolved in this water from the total O2, arriving at the amount of O2 bound to Hb.
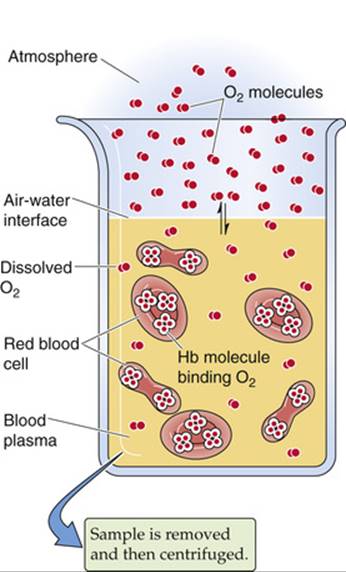
FIGURE 29-2 Determination of O2 content in blood plasma and erythrocytes.
Repeating this exercise over a range of ![]() values, we obtain the red curve in Figure 29-3. The right-hand y-axis gives the O2 bound to Hb in the units (mL O2)/(dL blood). The left-hand y-axis gives the same data in terms of percent O2 saturation of Hb (
values, we obtain the red curve in Figure 29-3. The right-hand y-axis gives the O2 bound to Hb in the units (mL O2)/(dL blood). The left-hand y-axis gives the same data in terms of percent O2 saturation of Hb (![]() or “Sat”). To compute
or “Sat”). To compute ![]() , we need to know the maximal amount of O2 that can bind to Hb at extremely high
, we need to know the maximal amount of O2 that can bind to Hb at extremely high ![]() values. Expressed in terms of grams of Hb protein, this O2 capacity is ~1.39 mL O2/g Hb—assuming that no metHb is present. In real life, the O2 capacity may be closer to 1.35 mL O2/g Hb because O2 cannot bind to Hb that either is in the Fe3+ state (e.g., MetHb) or, as discussed below, is bound to carbon monoxide. We can translate this O2 capacity to a value for the maximal amount of O2 that can bind to Hb in 100 mL of blood. If the Hb content is 15 g Hb/dL blood (i.e., normal for an adult male), then
values. Expressed in terms of grams of Hb protein, this O2 capacity is ~1.39 mL O2/g Hb—assuming that no metHb is present. In real life, the O2 capacity may be closer to 1.35 mL O2/g Hb because O2 cannot bind to Hb that either is in the Fe3+ state (e.g., MetHb) or, as discussed below, is bound to carbon monoxide. We can translate this O2 capacity to a value for the maximal amount of O2 that can bind to Hb in 100 mL of blood. If the Hb content is 15 g Hb/dL blood (i.e., normal for an adult male), then
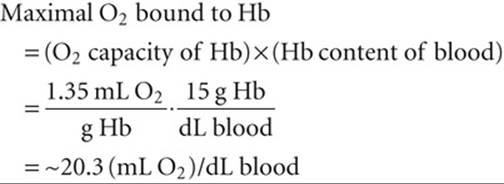
(29-4)
The percent saturation of Hb is
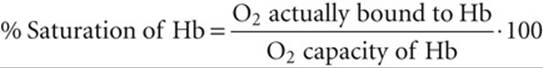
(29-5)
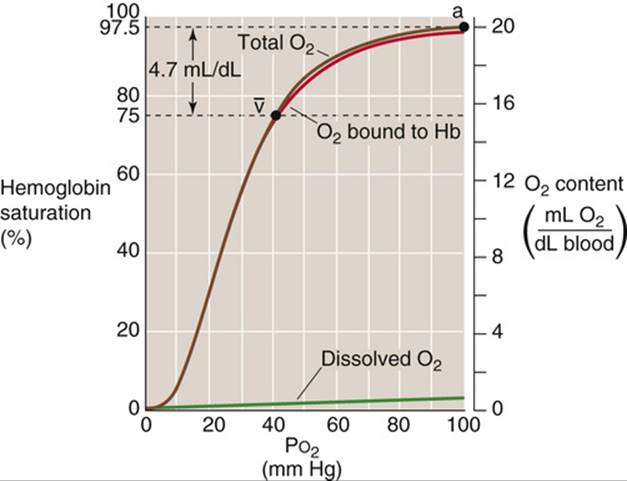
FIGURE 29-3 Normal Hb-O2 dissociation curve. The y-axis on the right shows O2 content. For the red curve (O2 content of Hb), we assume 15 g Hb/dL of blood and an O2 capacity of 1.35 mL O2/g Hb. The brown curve is the sum of the red and purple curves. The y-axis on the left, which pertains only to the red curve, gives the percentage of Hb saturation or ![]() .
.
Notice that the curve in Figure 29-3 is sigmoidal or S-shaped, owing to the cooperativity among the four O2-binding sites on the Hb molecule. At low ![]() values, increases in
values, increases in ![]() produce relatively small increases in O2 binding, which reflects the relatively low O2 affinity of Hb in the T state. At moderate
produce relatively small increases in O2 binding, which reflects the relatively low O2 affinity of Hb in the T state. At moderate ![]() values, the amount of bound O2 increases more steeply with increases in
values, the amount of bound O2 increases more steeply with increases in ![]() , which reflects the increased O2 affinity as more Hb molecules shift to the R state. The
, which reflects the increased O2 affinity as more Hb molecules shift to the R state. The ![]() at which the Hb is half saturated is known as the P50. Finally, the Hb-O2 versus
at which the Hb is half saturated is known as the P50. Finally, the Hb-O2 versus ![]() curve flattens at high
curve flattens at high ![]() values as the Hb saturates. The difference in Hb saturation at low versus high
values as the Hb saturates. The difference in Hb saturation at low versus high ![]() values is the basis for an important clinical tool, the pulse oximeter (Box 29-2).
values is the basis for an important clinical tool, the pulse oximeter (Box 29-2).
Box 29-2
Measuring the Oxygen Saturation of Hb Clinically
The Pulse Oximeter
The different colors of venous and arterial blood reflect difference in light absorbance between oxygenated and deoxygenated Hb. Clinicians now routinely exploit these differences to obtain simple, noninvasive measurements of the arterial O2 saturation (![]() ) of Hb in patients. The pulse oximeter has a probe that one attaches to the ear, finger, or any part of the body at which pulsating blood vessels are accessible externally. On one side of the pulsating vascular bed, the pulse oximeter shines red and infrared light; on the other side, it detects the light transmitted through the bed, and calculates absorbances. These total absorbances have two components: (1) a nonpulsatile component that arises from stationary tissues, including blood inside capillaries and veins; and (2) a pulsatile component that arises from blood inside arterioles and arteries. The difference between the total and nonpulsatile absorbance is thus the pulsatile component, which represents only arterial or oxygenated blood. Because oxygenated and deoxygenated Hb absorb red and infrared light differently, the pulse oximeter can calculate
) of Hb in patients. The pulse oximeter has a probe that one attaches to the ear, finger, or any part of the body at which pulsating blood vessels are accessible externally. On one side of the pulsating vascular bed, the pulse oximeter shines red and infrared light; on the other side, it detects the light transmitted through the bed, and calculates absorbances. These total absorbances have two components: (1) a nonpulsatile component that arises from stationary tissues, including blood inside capillaries and veins; and (2) a pulsatile component that arises from blood inside arterioles and arteries. The difference between the total and nonpulsatile absorbance is thus the pulsatile component, which represents only arterial or oxygenated blood. Because oxygenated and deoxygenated Hb absorb red and infrared light differently, the pulse oximeter can calculate ![]() from the ratio of pulsatile light absorbed at the two wavelengths. The pulse oximeter accomplishes this magic by using a sophisticated microprocessor and software to produce results that strongly agree with those provided by blood-gas analysis of a sample of arterial blood.
from the ratio of pulsatile light absorbed at the two wavelengths. The pulse oximeter accomplishes this magic by using a sophisticated microprocessor and software to produce results that strongly agree with those provided by blood-gas analysis of a sample of arterial blood.
The pulse oximeter measures O2 saturation in arterial blood. Because systemic capillaries and veins do not pulsate, they do not contribute to the measurement. Thus, a patient with peripheral cyanosis (e.g., purple fingertips caused by cold-induced vasoconstriction) may have a perfectly normal “central” (i.e., arterial) O2 saturation. It is worth noting that pulse oximetry cannot detect CO poisoning because the absorbance spectra of Hb-CO and Hb-O2 are similar.
Health professionals widely employ pulse oximetry in hospitalized patients, particularly those in intensive care units, where continuous monitoring of ![]() is critical. These patients include those on mechanical ventilators and others, less severely ill, who have some degree of respiratory compromise. Pulse oximetry has also become popular as an outpatient tool for assessing the presence of hypoxemia during sleep and thus screening for sleep apnea (Box 32-5). Because of the insidious nature of hypoxia, pilots of light aircraft have begun to use pulse oximeters to detect developing hypoxia at high altitudes.
is critical. These patients include those on mechanical ventilators and others, less severely ill, who have some degree of respiratory compromise. Pulse oximetry has also become popular as an outpatient tool for assessing the presence of hypoxemia during sleep and thus screening for sleep apnea (Box 32-5). Because of the insidious nature of hypoxia, pilots of light aircraft have begun to use pulse oximeters to detect developing hypoxia at high altitudes.
At the ![]() prevailing in normal arterial blood (
prevailing in normal arterial blood (![]() )—approximately 100 mm Hg—the Hb saturation (
)—approximately 100 mm Hg—the Hb saturation (![]() ) is ~97.5% or 19.7 mL O2/dL bound to Hb (Table 29-3). The dissolved O2 (purple curve in Fig. 29-3) would add an additional 0.3 mL O2/dL for a total O2 content of 20.0 mL O2/dL (point a on the brown curve in Fig. 29-3). In mixed-venous blood, in which
) is ~97.5% or 19.7 mL O2/dL bound to Hb (Table 29-3). The dissolved O2 (purple curve in Fig. 29-3) would add an additional 0.3 mL O2/dL for a total O2 content of 20.0 mL O2/dL (point a on the brown curve in Fig. 29-3). In mixed-venous blood, in which ![]() (
(![]() ) is ~40 mm Hg, the Hb saturation (
) is ~40 mm Hg, the Hb saturation (![]() ) is ~75% or 15.2 mL O2/dL bound to Hb (see Table 29-3). The dissolved O2 would add 0.1 mL O2/dL for a total of 15.3 mL O2/dL (point
) is ~75% or 15.2 mL O2/dL bound to Hb (see Table 29-3). The dissolved O2 would add 0.1 mL O2/dL for a total of 15.3 mL O2/dL (point ![]() in Fig. 29-3). The difference in total O2 content between points a and
in Fig. 29-3). The difference in total O2 content between points a and ![]() , the a-
, the a-![]() difference, is the amount of O2 that the lungs add to the blood in the pulmonary capillaries, which is the same amount that all the tissues extract from the blood in the systemic capillaries:
difference, is the amount of O2 that the lungs add to the blood in the pulmonary capillaries, which is the same amount that all the tissues extract from the blood in the systemic capillaries:
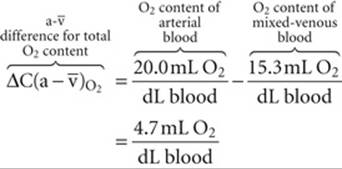
(29-6)
TABLE 29-3
Summary of a-![]() Difference in O2 Composition of Blood
Difference in O2 Composition of Blood
|
|
Hb SATURATION ( |
O2 BOUND TO Hb (mL/dL)* |
O2 DISSOLVED (mL/dL) |
TOTAL O2 CONTENT (mL/dL) |
|
|
a |
100 |
97.5% |
19.7 |
0.3 |
20.0 |
|
|
40 |
75% |
15.2 |
~0.1 |
15.3 |
|
a- |
60 |
22.5% |
4.5 |
~0.2 |
4.7 |
*Assuming an Hb content of 15 g Hb/dL blood and an O2 capacity of 1.35 mL O2/g Hb. Here, fully saturated Hb would carry 20.3 mL O2/dL blood.
Of the total a-![]() difference of 4.7 mL O2/dL, Hb provides 4.5 mL O2/dL or nearly 96% of the O2 that the lungs add and the systemic tissues extract from blood (see Table 29-3). Is this a-
difference of 4.7 mL O2/dL, Hb provides 4.5 mL O2/dL or nearly 96% of the O2 that the lungs add and the systemic tissues extract from blood (see Table 29-3). Is this a-![]() difference in O2 content enough to satisfy the metabolic demands of the body (i.e., ~250 mL O2/min)? Using the Fick principle, as we did in Equation 29-3, we see that the combination of a cardiac output of 5 L/min and an a-
difference in O2 content enough to satisfy the metabolic demands of the body (i.e., ~250 mL O2/min)? Using the Fick principle, as we did in Equation 29-3, we see that the combination of a cardiac output of 5 L/min and an a-![]() difference of 4.7 mL/dL would be nearly adequate:
difference of 4.7 mL/dL would be nearly adequate:
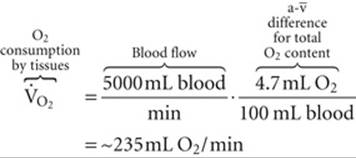
(29-7)
By either increasing cardiac output by ~6% or decreasing the ![]() of mixed-venous blood, the body could meet a demand of 250 mL O2/min. We spend our lives moving endlessly from point a in Figure 29-3 to point
of mixed-venous blood, the body could meet a demand of 250 mL O2/min. We spend our lives moving endlessly from point a in Figure 29-3 to point ![]() (as we deliver O2 to the tissues) and then back to point a (as we take up more O2 from alveolar air).
(as we deliver O2 to the tissues) and then back to point a (as we take up more O2 from alveolar air).
Because the plot of [O2]Dis versus ![]() is linear (see Fig. 29-3, purple curve), the amount of O2 that can dissolve in blood plasma has no theoretical maximum. Thus, breathing 100% O2 would raise arterial
is linear (see Fig. 29-3, purple curve), the amount of O2 that can dissolve in blood plasma has no theoretical maximum. Thus, breathing 100% O2 would raise arterial ![]() by ~6-fold, so that ~1.8 mL of O2 would be dissolved in each deciliter of arterial blood. Although dissolved O2 would make a correspondingly greater contribution to overall O2 carriage under such unphysiological conditions, Hb would still carry the vast majority of O2. Hence, a decrease in the Hb content of the blood—known as anemia—can markedly reduce O2 carriage. The body can compensate for decreased Hb content in the same two ways that, in the above example, we increased the
by ~6-fold, so that ~1.8 mL of O2 would be dissolved in each deciliter of arterial blood. Although dissolved O2 would make a correspondingly greater contribution to overall O2 carriage under such unphysiological conditions, Hb would still carry the vast majority of O2. Hence, a decrease in the Hb content of the blood—known as anemia—can markedly reduce O2 carriage. The body can compensate for decreased Hb content in the same two ways that, in the above example, we increased the ![]() from 235 to 250 mL O2/min. First, it can increase cardiac output. Second, it can increase O2 extraction, thereby reducing mixed-venous O2 content. Anemia leads to pallor of the mucous membranes and skin, reflecting the decrease in the red Hb pigment. Impaired O2 delivery may cause lethargy and fatigue. The accompanying increase in cardiac output may manifest itself as palpitations and a systolic murmur. Shortness of breath may also be a part of the syndrome.
from 235 to 250 mL O2/min. First, it can increase cardiac output. Second, it can increase O2 extraction, thereby reducing mixed-venous O2 content. Anemia leads to pallor of the mucous membranes and skin, reflecting the decrease in the red Hb pigment. Impaired O2 delivery may cause lethargy and fatigue. The accompanying increase in cardiac output may manifest itself as palpitations and a systolic murmur. Shortness of breath may also be a part of the syndrome.
If decreased Hb levels are detrimental, then increasing Hb content should increase the maximal O2 content and thus provide a competitive advantage for athletes. Even in normal individuals, [Hb] in RBC cytoplasm is already extremely high (see p. 434). Hypoxia (e.g., adaptation to high altitude) leads to the increased production of erythropoietin (see pp. 431–433), ![]() N18-2 a hormone that somewhat increases the amount of Hb per erythrocyte, but especially increases their number. Indeed, a few instances have been highly publicized in the international press in which elite athletes have infused themselves with erythrocytes or injected themselves with recombinant erythropoietin. However, an excessive increase in hematocrit—polycythemia—has the adverse effect of increasing blood viscosity and thus vascular resistance (see pp. 437–439). The consequences include increased blood pressure in both the systemic and pulmonary circulations and a mismatch of ventilation to perfusion within the lung. Such a ventilation-perfusion mismatch leads to hypoxia (see p. 693), and thus desaturation of arterial Hb. Thus, the optimal hematocrit—presumably ~45%—is one that achieves a high maximal O2 content, but at a reasonable blood viscosity.
N18-2 a hormone that somewhat increases the amount of Hb per erythrocyte, but especially increases their number. Indeed, a few instances have been highly publicized in the international press in which elite athletes have infused themselves with erythrocytes or injected themselves with recombinant erythropoietin. However, an excessive increase in hematocrit—polycythemia—has the adverse effect of increasing blood viscosity and thus vascular resistance (see pp. 437–439). The consequences include increased blood pressure in both the systemic and pulmonary circulations and a mismatch of ventilation to perfusion within the lung. Such a ventilation-perfusion mismatch leads to hypoxia (see p. 693), and thus desaturation of arterial Hb. Thus, the optimal hematocrit—presumably ~45%—is one that achieves a high maximal O2 content, but at a reasonable blood viscosity.
The purplish color of desaturated Hb produces the physical sign known as cyanosis, a purplish coloration of the skin and mucous membranes. Cyanosis results not from the absence of saturated or oxygenated Hb, but from the presence of desaturated Hb. Thus, an anemic patient with poorly saturated Hb might have too little unsaturated Hb for it to manifest as cyanosis. The physician's ability to detect cyanosis also depends on other factors, such as the subject's skin pigmentation and the lighting conditions for the physical examination.
Increases in temperature, [CO2], and [H+], all of which are characteristic of metabolically active tissues, cause Hb to dump O2
Metabolically active tissues not only have a high demand for O2, they also are warm, produce large amounts of CO2, and are acidic. Indeed, high temperature, high ![]() , and low pH of metabolically active tissues all decrease the O2 affinity of Hb by acting at nonheme sites to shift the equilibrium between the T and R states of Hb more toward the low-affinity T state. The net effect is that metabolically active tissues can signal Hb in the systemic capillaries to release more O2 than usual, whereas less active tissues can signal Hb to release less. In the pulmonary capillaries—where temperature is lower than in active tissues,
, and low pH of metabolically active tissues all decrease the O2 affinity of Hb by acting at nonheme sites to shift the equilibrium between the T and R states of Hb more toward the low-affinity T state. The net effect is that metabolically active tissues can signal Hb in the systemic capillaries to release more O2 than usual, whereas less active tissues can signal Hb to release less. In the pulmonary capillaries—where temperature is lower than in active tissues, ![]() is relatively low and pH is high—these same properties promote O2 uptake by Hb.
is relatively low and pH is high—these same properties promote O2 uptake by Hb.
Temperature
Increasing the temperature causes the Hb-O2 dissociation curve to shift to the right, whereas decreasing the temperature has the opposite effect (Fig. 29-4). Comparing the three Hb-O2 dissociation curves in Figure 29-4 at the ![]() of mixed-venous blood (40 mm Hg), we see that the amount of O2 bound to Hb becomes progressively less at higher temperatures. In other words, high temperature decreases the O2 affinity of Hb and leads to release of O2. One mechanism of this temperature effect may be small shifts in the pK values of various amino-acid side chains, which cause shifts in net charge and thus a conformational change.
of mixed-venous blood (40 mm Hg), we see that the amount of O2 bound to Hb becomes progressively less at higher temperatures. In other words, high temperature decreases the O2 affinity of Hb and leads to release of O2. One mechanism of this temperature effect may be small shifts in the pK values of various amino-acid side chains, which cause shifts in net charge and thus a conformational change.
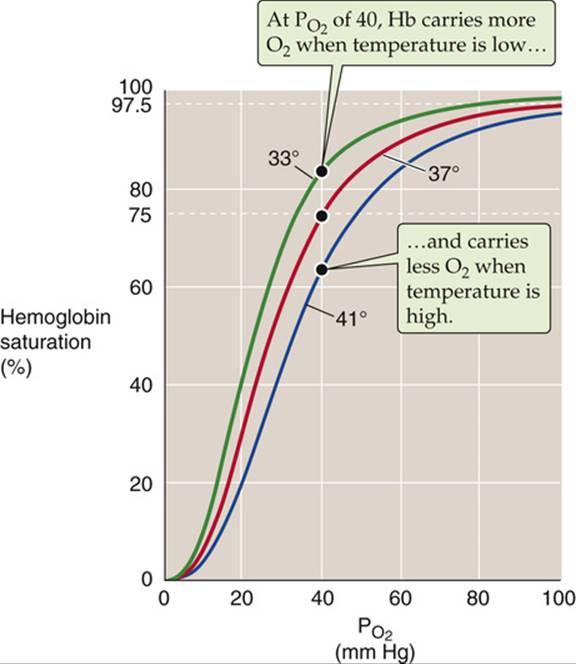
FIGURE 29-4 Effect of temperature changes on the Hb-O2 dissociation curve.
The maximal temperature achieved in active muscle is ~40°C. Of course, very low temperatures can prevail in the skin of extremities exposed to extreme cold.
Acid
In 1904, Christian Bohr, a physiologist and father of atomic physicist Niels Bohr, observed that respiratory acidosis (see p. 633) shifts the Hb-O2 dissociation curve to the right (Fig. 29-5A). This decrease in O2affinity has come to be known as the Bohr effect. A mild respiratory acidosis occurs physiologically as erythrocytes enter the systemic capillaries. There, the increase in extracellular ![]() causes CO2 to enter erythrocytes, which leads to a fall in intracellular pH (see p. 646). Other acidic metabolites may also lower extracellular and, therefore, intracellular pH. Thus, this intracellular respiratory acidosis has two components—a decrease in pH and an increase in
causes CO2 to enter erythrocytes, which leads to a fall in intracellular pH (see p. 646). Other acidic metabolites may also lower extracellular and, therefore, intracellular pH. Thus, this intracellular respiratory acidosis has two components—a decrease in pH and an increase in ![]() . We now appreciate that both contribute to the rightward shift of the Hb-O2 dissociation curve observed by Bohr.
. We now appreciate that both contribute to the rightward shift of the Hb-O2 dissociation curve observed by Bohr.
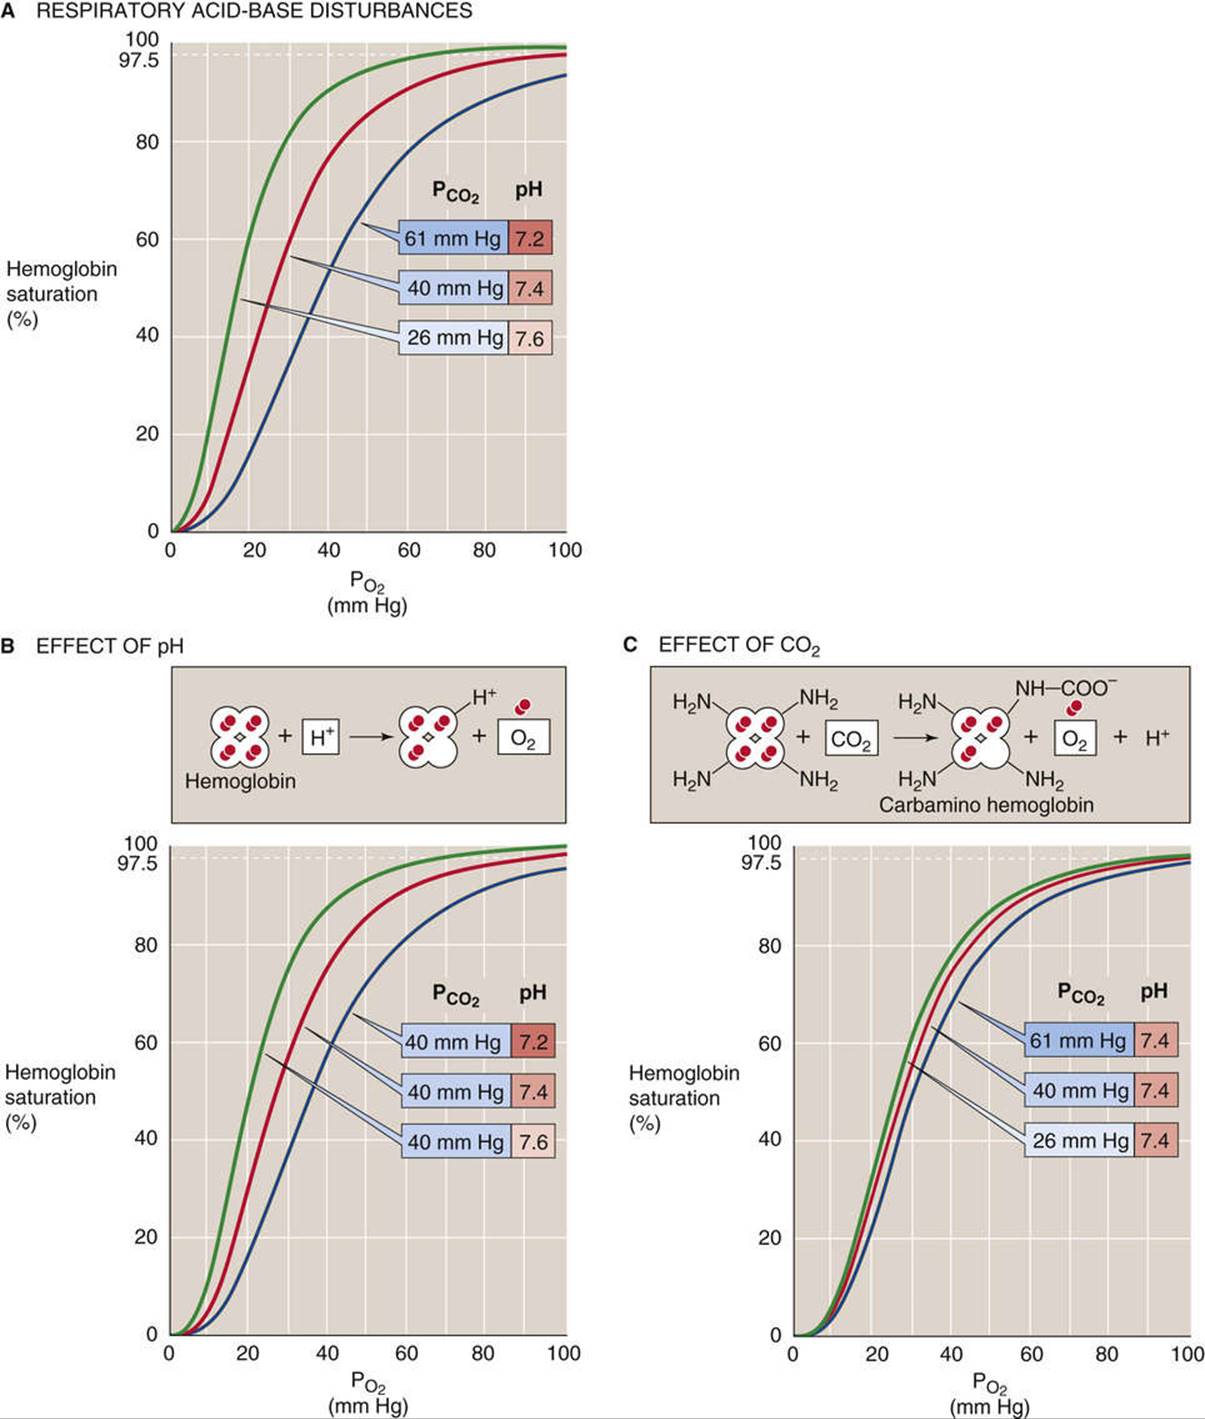
FIGURE 29-5 Effect of acidosis and hypercapnia on the Hb-O2 dissociation curve (Bohr effect).
The effect of acidosis per se on the Hb-O2 dissociation curve (see Fig. 29-5B)—the pH-Bohr effect—accounts for most of the overall Bohr effect. One can readily demonstrate the pH-Bohr effect in a solution of Hb by imposing a metabolic acidosis (e.g., decreasing pH at a fixed ![]() ). It should not be surprising that Hb is sensitive to changes in pH because Hb is an outstanding H+ buffer (see p. 630):
). It should not be surprising that Hb is sensitive to changes in pH because Hb is an outstanding H+ buffer (see p. 630):
![]()
(29-8)
Although Hb has many titratable groups, the ones important here are those with pK values in the physiological pH range. ![]() N29-2 As we acidify the solution, raising the ratio [Hb-H+]/[Hb] for susceptible groups, we change the conformation of the Hb molecule, thus lowering its O2 affinity:
N29-2 As we acidify the solution, raising the ratio [Hb-H+]/[Hb] for susceptible groups, we change the conformation of the Hb molecule, thus lowering its O2 affinity:
![]()
(29-9)
N29-2
Interactions of H+ with Hemoglobin
Contributed by Emile Boulpaep, Walter Boron
Like most proteins, Hb has many titratable groups. However, the ones that are most important physiologically are the ones whose pK values are near the physiological pH. For a general discussion of buffers, consult the passage beginning on pages 628–633. Of particular interest is the passage dealing with buffers in a closed system (see pp. 630–633) and Figure 28-2B.
Several titratable groups in the Hb molecule contribute to the pH-Bohr effect. The most important single group is the histidine at residue 146 of the β chains. When the Hb molecule is fully deoxygenated (tensed state), the protonated His-146 forms a salt bridge with the negatively charged aspartate group at position 94 of the same β chain. This salt bridge stabilizes the protonated form of His-146, so that it has a high affinity for H+ (i.e., a relatively high pK value of ~8.0).
When the Hb becomes fully oxygenated (relaxed state), the twisting of the Hb molecule disrupts the salt bridge and thus destabilizes the protonated form of His-146, so that it has a low affinity for H+ and thus a relatively low pK value of ~7.1. This pK is roughly the same as the pH inside the RBC. According to Equation 28-5, the ratio [![]() ]/[R-NH2] must be 1 : 1 (so that in 50 out of every 100 Hb molecules, this group is protonated).
]/[R-NH2] must be 1 : 1 (so that in 50 out of every 100 Hb molecules, this group is protonated).
Now let us fully deoxygenate this Hb and return the pK of His-146 to where it was at the beginning of this example, ~8.0. The pH inside the erythrocyte remains at 7.1. Equation 28-5 tells us that the ratio [![]() ]/[R-NH2] will be 8 : 1. That is, in 89 of every 100 Hb molecules, this His-146 group is protonated. Thus, for every 100 Hb molecules, 39 H+ ions have been taken up from the solution to titrate 39 R-NH2groups to form 39 additional
]/[R-NH2] will be 8 : 1. That is, in 89 of every 100 Hb molecules, this His-146 group is protonated. Thus, for every 100 Hb molecules, 39 H+ ions have been taken up from the solution to titrate 39 R-NH2groups to form 39 additional ![]() groups at His-146.
groups at His-146.
The above is an extreme example, because the Hb does not become fully deoxygenated in the systemic capillaries. It is also a simplified example, inasmuch as multiple residues in Hb contribute to the pH-Bohr effect. Nevertheless, the example illustrates how deoxygenated Hb is better able to buffer excess protons.
In the above paragraphs, we have been emphasizing one side of the physiological coin: deoxygenation makes Hb a weaker acid (and thus causes Hb to take up H+). However, as summarized by the reaction in Equation 29-9,
![]()
(NE 29-1)
the converse is also true: the protonation of Hb lowers Hb's affinity for O2.
This is an extreme example in which we added enough H+ to cause Hb to dump all of its O2. Under more physiological conditions, the binding of ~0.7 mole of H+ causes Hb to release 1 mole of O2. This property is important in the systemic tissues, where [H+] is high. The converse is also true: O2 binding causes a conformational change in the Hb molecule, which lowers the affinity of Hb for H+.
Carbon Dioxide
The isolated effect of hypercapnia per se on the Hb-O2 dissociation curve (see Fig. 29-5C) represents a small portion of the overall Bohr effect. Demonstrating such a CO2-Bohr effect requires that we study the O2affinity of Hb at a fixed pH, increasing ![]() and
and ![]() proportionally—an example of isohydric hypercapnia (see p. 641). As
proportionally—an example of isohydric hypercapnia (see p. 641). As ![]() increases, CO2 combines with unprotonated amino groups on Hb (Hb-NH2) to form carbamino groups (Hb-NH-COO−).
increases, CO2 combines with unprotonated amino groups on Hb (Hb-NH2) to form carbamino groups (Hb-NH-COO−). ![]() N29-3 Although Hb has other amino groups, only the four amino termini of the globin chains are susceptible to appreciable carbamino formation, the β chains more so than the α chains. Because amino groups exist in a protonated form (
N29-3 Although Hb has other amino groups, only the four amino termini of the globin chains are susceptible to appreciable carbamino formation, the β chains more so than the α chains. Because amino groups exist in a protonated form (![]() ) in equilibrium with an unprotonated form, the reaction of CO2 with Hb-NH2 tends to shift Hb away from the
) in equilibrium with an unprotonated form, the reaction of CO2 with Hb-NH2 tends to shift Hb away from the ![]() form and toward the Hb-NH-COO− form:
form and toward the Hb-NH-COO− form:

(29-10)
N29-3
Interactions of CO2 with Hemoglobin
Contributed by Emile Boulpaep, Walter Boron
As discussed on page 653, CO2 can reversibly react with the four amino groups that constitute the four N termini of the globin chains—the two α chains and, especially, the two β chains. As shown by Equation 29-10 in the text, the interaction of CO2 with these amino termini causes the net charge on the residue to change from positive (![]() ) to negative (Hb-NH-COO–). A consequence is the formation of salt bridges—among several positively and negatively charged amino-acid residues—that tend to stabilize the deoxygenated (or tensed) form of Hb. Thus, in the systemic capillaries, the increased levels of CO2 favor the deoxygenated form of Hb, which is tantamount to dumping O2. In other words, increased levels of CO2 cause the Hb-O2 dissociation curve to shift to the right (see Fig. 29-5C).
) to negative (Hb-NH-COO–). A consequence is the formation of salt bridges—among several positively and negatively charged amino-acid residues—that tend to stabilize the deoxygenated (or tensed) form of Hb. Thus, in the systemic capillaries, the increased levels of CO2 favor the deoxygenated form of Hb, which is tantamount to dumping O2. In other words, increased levels of CO2 cause the Hb-O2 dissociation curve to shift to the right (see Fig. 29-5C).
In the lungs, the converse takes place as the binding of O2 to Hb causes a twisting of the Hb molecule as it shifts from the tensed to the relaxed state. This twisting disrupts the aforementioned salt bridges and destabilizes carbamino. As a result, the Hb molecule dumps CO2, which exits the erythrocyte and diffuses into the alveolar air space.
The overall effect of carbamino formation is therefore a negative shift in the charge on one amino-acid side chain, causing a shift in the conformation of Hb and reducing its O2 affinity:
![]()
(29-11)
Thus, an increased ![]() causes Hb to unload O2, which is important in the systemic tissues. Conversely, an increased
causes Hb to unload O2, which is important in the systemic tissues. Conversely, an increased ![]() causes Hb to unload CO2, which is important in the lungs.
causes Hb to unload CO2, which is important in the lungs.
In conclusion, the Hb-O2 dissociation curve shifts to the right under conditions prevailing in the capillaries of metabolically active systemic tissues—increased temperature (see Fig. 29-4), decreased pH (see Fig. 29-5B), and increased ![]() (see Fig. 29-5C). These right shifts are synonymous with decreased O2 affinity. Thus, high metabolic rates promote the unloading of O2 from Hb. Clearly, blood cannot unload O2 unless the blood gets to the tissues. Indeed, in most systemic arterioles, local hypercapnia and acidosis also are powerful stimuli for vasodilation (see p. 556), enhancing O2 delivery to metabolically active tissues.
(see Fig. 29-5C). These right shifts are synonymous with decreased O2 affinity. Thus, high metabolic rates promote the unloading of O2 from Hb. Clearly, blood cannot unload O2 unless the blood gets to the tissues. Indeed, in most systemic arterioles, local hypercapnia and acidosis also are powerful stimuli for vasodilation (see p. 556), enhancing O2 delivery to metabolically active tissues.
2,3-Diphosphoglycerate reduces the affinity of adult, but not of fetal, Hb
The affinity of Hb for O2 is very sensitive to the presence of the glycolytic metabolite 2,3-diphosphoglycerate (2,3-DPG) ![]() N29-4 and, to a lesser extent, organic phosphates such as ATP. The concentration of 2,3-DPG is about the same as that of Hb. Indeed, 2,3-DPG binds to Hb in a 1 : 1 stoichiometry, interacting with a central cavity formed by the two β chains. At physiological pH, 2,3-DPG has an average of ~3.5 negative charges, which interact with eight positively charged amino-acid residues in this central cavity. O2 binding, however, changes the shape of the central cavity, destabilizing DPG-bound Hb. As a result, deoxygenated Hb has a 100-fold higher affinity for 2,3-DPG than does oxygenated Hb. Conversely, binding of 2,3-DPG to Hb destabilizes the interaction of Hb with O2, promoting the release of O2:
N29-4 and, to a lesser extent, organic phosphates such as ATP. The concentration of 2,3-DPG is about the same as that of Hb. Indeed, 2,3-DPG binds to Hb in a 1 : 1 stoichiometry, interacting with a central cavity formed by the two β chains. At physiological pH, 2,3-DPG has an average of ~3.5 negative charges, which interact with eight positively charged amino-acid residues in this central cavity. O2 binding, however, changes the shape of the central cavity, destabilizing DPG-bound Hb. As a result, deoxygenated Hb has a 100-fold higher affinity for 2,3-DPG than does oxygenated Hb. Conversely, binding of 2,3-DPG to Hb destabilizes the interaction of Hb with O2, promoting the release of O2:
![]()
(29-12)
N29-4
2,3-DPG
Contributed by Emile Boulpaep, Walter Boron
2,3-Diphosphoglycerate (2,3-DPG), also known as 2,3-bisphosphoglycerate (2,3-BPG), is an intermediate in one of the later reactions in glycolysis (Fig. 58-6A). The overall reaction in question is 3-phosphoglycerate (3-PG) → 2-phosphoglycerate (2-PG), catalyzed by phosphoglycerate mutase (PGM):
![]()
The actual mechanism is interesting. A specific kinase initially activates the PGM by transferring a phosphate group from the 2 position of 2,3-DPG to a histidine residue of the enzyme, creating PGM-P and 3-PG:
![]()
In the actual mutase reaction, this activated enzyme transfers the phosphate group to 2-PG, creating 2,3-DPG:
![]()
Finally, the enzyme can accept a phosphate group from 2,3-DPG, creating 3-PG:
![]()
Thus, 2,3-DPG is a cofactor in the mutase reaction. It also is continuously formed and consumed.
The result is a right shift in the Hb-O2 dissociation curve (Fig. 29-6). This effect of 2,3-DPG on the O2 affinity of Hb is important both in hypoxia and in understanding the physiology of fetal Hb.
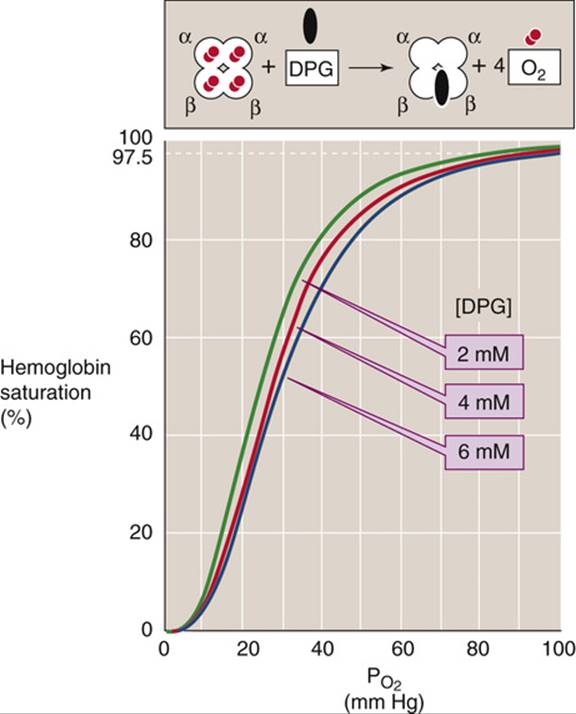
FIGURE 29-6 Effect of 2,3-DPG on O2 affinity of Hb. After lowlanders spent about 2 days at an altitude of ~4500 m, their cytosolic [2,3-DPG] increased by ~50%, shifting the Hb-O2 dissociation curve to the right.
Decreasing the ![]() of RBCs stimulates glycolysis, which leads to increased levels of 2,3-DPG. Indeed, chronic hypoxia, anemia, and acclimation to high altitude are all associated with an increase in 2,3-DPG levels and thus lower the O2 affinity of Hb. Reducing the affinity is a two-edged sword. At the relatively high
of RBCs stimulates glycolysis, which leads to increased levels of 2,3-DPG. Indeed, chronic hypoxia, anemia, and acclimation to high altitude are all associated with an increase in 2,3-DPG levels and thus lower the O2 affinity of Hb. Reducing the affinity is a two-edged sword. At the relatively high ![]() in alveoli, where the Hb-O2 dissociation curve is fairly flat, this decrease in O2 affinity reduces O2uptake—but only slightly. At the low
in alveoli, where the Hb-O2 dissociation curve is fairly flat, this decrease in O2 affinity reduces O2uptake—but only slightly. At the low ![]() in systemic tissues, where the Hb-O2 dissociation curve is steep, this decrease in O2 affinity markedly increases the O2 release. The net effect is enhanced O2 unloading to metabolizing tissues, which is more important than
in systemic tissues, where the Hb-O2 dissociation curve is steep, this decrease in O2 affinity markedly increases the O2 release. The net effect is enhanced O2 unloading to metabolizing tissues, which is more important than ![]() per se.
per se.
In Figure 29-7, the teal Hb-O2 dissociation curve represents pure or “stripped” Hb (i.e., in the absence of CO2, 2,3-DPG, and other organic phosphates). The O2 affinity of pure Hb is quite high, as evidenced by the left shift of the curve. Adding only CO2 (orange curve) or only 2,3-DPG (green curve) to the solution shifts the curve somewhat to the right, and adding both yields the brown curve, which is indistinguishable from the red curve for intact RBCs under physiological conditions.
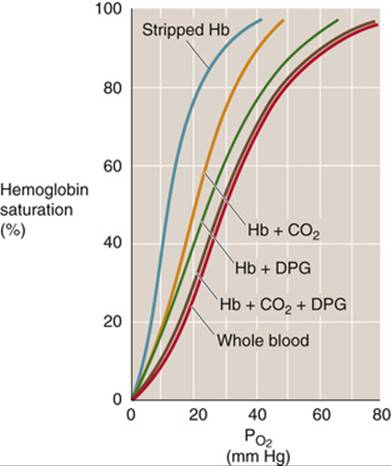
FIGURE 29-7 Effect of adding CO2 or 2,3-DPG to stripped Hb. The teal, orange, green, and brown curves are Hb-O2 dissociation curves for pure Hb (2 mM) in artificial solutions. “Stripped Hb” is devoid of both CO2 and 2,3-DPG. When CO2 or 2,3-DPG was present, ![]() was 40 mm Hg and [2,3-DPG] was 2.4 mM. The cytosol of erythrocytes in blood (red curve) had the same composition as the artificial solutions.
was 40 mm Hg and [2,3-DPG] was 2.4 mM. The cytosol of erythrocytes in blood (red curve) had the same composition as the artificial solutions.
The fetal hemoglobin (HbF) in fetal erythrocytes (see p. 649) has a higher O2 affinity than the Hb inside adult RBCs (HbA). This difference is crucial for the fetus, whose blood must extract O2 from maternal blood in the placenta (see p. 1137). The difference in O2 affinities does not, however, reflect differences in O2 affinities of stripped HbA and HbF, which are nearly identical. The crucial difference is that the γ chains of HbF bind 2,3-DPG less avidly than do the β chains of HbA. With less 2,3-DPG bound, the dissociation curve of HbF is left-shifted, similar to the HbA curve labeled “Hb + CO2” in Figure 29-7.
O2 is not the only gas that can bind to the Fe2+ of Hb; carbon monoxide (CO), nitric oxide (NO), and H2S can also bind to Hb and snap it into the R state. ![]() N29-5 In CO poisoning (see pp. 1224–1225), CO binds to Hb with an affinity that is ~200-fold greater than that of O2. Thus, the maximal O2 capacity falls to the extent that CO binds to Hb. However, the major reason that CO is toxic is that, as it snaps Hb into the R state, CO increases the O2 affinity of Hb and shifts the Hb-O2 dissociation curve far to the left. Thus, when Hb reaches the systemic capillaries in CO poisoning, its tenacity for O2 is so high that the bright red blood cannot release enough O2 to the tissues.
N29-5 In CO poisoning (see pp. 1224–1225), CO binds to Hb with an affinity that is ~200-fold greater than that of O2. Thus, the maximal O2 capacity falls to the extent that CO binds to Hb. However, the major reason that CO is toxic is that, as it snaps Hb into the R state, CO increases the O2 affinity of Hb and shifts the Hb-O2 dissociation curve far to the left. Thus, when Hb reaches the systemic capillaries in CO poisoning, its tenacity for O2 is so high that the bright red blood cannot release enough O2 to the tissues.
N29-5
Other Gases That Bind to Hemoglobin
Contributed by Arthur DuBois, Emile Boulpaep, Walter Boron
The text discusses in some detail the interaction of O2 and CO2 with Hb, briefly discusses the interaction of CO with Hb, and mentions the interactions of NO and H2S with Hb.
Carbon Monoxide
As noted in the text, the affinity of Hb for CO is ~200-fold greater than for O2. Thus, when a fully oxygenated Hb molecule—Hb(O2)4—is exposed to even a low level of CO, a CO molecule displaces one of the O2 molecules from some of the Hb molecules, resulting in Hb(O2)3(CO). If the only effect of CO poisoning were to render ineffective one of the four O2-binding sites, then the symptoms would be no worse than reducing the hematocrit by 25% (e.g., from 40% to 30%) or perfusing the arteries with mixed-venous blood (which also has an Hb-O2 saturation of 75%). If fact, if a single CO molecule binds to 40% of the Hb molecules in the blood, the patient will experience symptoms, as outlined below. Why?
Basis of CO Toxicity
CO is toxic for two reasons. First, it reduces the number of binding sites available for O2 carriage. Second, the binding of CO stabilizes the Hb molecule in its relaxed state, which shifts the Hb-O2 dissociation curve far to the left and makes it more difficult for the Hb to release O2 in the systemic capillaries.
Calculating the CO Saturation of Hb
To calculate the HbCO concentration, remember that when the Hb is exposed to CO, the [HbCO] will equal the [HbO2] when the Hb is exposed to O2 at 210 times the [CO] in question. For example, Hb is 50% saturated with O2 (at equilibrium) when the ![]() is 28 mm Hg. The 50% HbCO concentration will be reached at equilibrium with 28/210 mm Hg of CO, which would be only 0.133 mm Hg of CO. Because an atmosphere of pressure is 760 mm Hg, 0.133 mm Hg of CO is equivalent to 0.133/760 or 0.000175 atmosphere of CO, or 175 ppm of CO. This level of CO would severely incapacitate or kill a person exposed to it for a long time. However, because it takes 4 hours to reach half the final equilibrated level of HbCO, a 4-hour exposure to 175 ppm alveolar CO would lead to a HbCO level of 50%/2, or 25% HbCO. This level would give the person a headache and interfere with mental function. In 2 hours of exposure, the HbCO would be
is 28 mm Hg. The 50% HbCO concentration will be reached at equilibrium with 28/210 mm Hg of CO, which would be only 0.133 mm Hg of CO. Because an atmosphere of pressure is 760 mm Hg, 0.133 mm Hg of CO is equivalent to 0.133/760 or 0.000175 atmosphere of CO, or 175 ppm of CO. This level of CO would severely incapacitate or kill a person exposed to it for a long time. However, because it takes 4 hours to reach half the final equilibrated level of HbCO, a 4-hour exposure to 175 ppm alveolar CO would lead to a HbCO level of 50%/2, or 25% HbCO. This level would give the person a headache and interfere with mental function. In 2 hours of exposure, the HbCO would be ![]() of 50% saturation, or 12.5% HbCO. This lower level would interfere with night vision and—because of some interference with O2 transport—raise the risk of angina in a person with limited coronary blood flow.
of 50% saturation, or 12.5% HbCO. This lower level would interfere with night vision and—because of some interference with O2 transport—raise the risk of angina in a person with limited coronary blood flow.
Symptoms and Treatments
Symptoms of mild CO poisoning may begin when the CO saturation of Hb reaches 10%; that is, when 40% of the Hb molecules bind one CO (25% of sites on one Hb molecule × 40% of Hb molecules = 10% saturation). These symptoms—which are not very specific—may include headache, nausea, and vomiting.
For mild CO poisoning, the treatment is simply to remove the causative agent, which leaves the body with a half-time of ~4 hours (i.e., CO dissociates very, very slowly from Hb—it has a low off-rate).
For more severe CO poisoning, the recommended treatment is to have the patient breathe 100% O2, which increases the probability that O2 will displace CO from Hb (i.e., it increases the off-rate) and thereby speeds the washout of CO by about a factor of 4 (half-time ≅ 60 minutes).
When the CO saturation of Hb reaches 20% to 25% (i.e., when, on average, 80% to 100% of Hb molecules each bind one CO molecule), the symptoms are severe and include confusion, chest pain, and unconsciousness. The treatment is hyperbaric 100% O2—oxygen delivered at high pressure (OHP)—which has two positive effects. First, the hyperbaric O2 (i.e., increased ![]() ) accelerates even further the displacement of CO from Hb. Breathing hyperbaric 100% O2 at 2.5 atmospheres of pressure reduces the half-time of washout to 20 minutes. Second, the hyperbaric-O2 treatment can increase the concentration of dissolved O2 to such an extent that this dissolved O2 in the blood can deliver sufficient O2 to satisfy the body's metabolic demands (see Equations 29-1 through 29-3).
) accelerates even further the displacement of CO from Hb. Breathing hyperbaric 100% O2 at 2.5 atmospheres of pressure reduces the half-time of washout to 20 minutes. Second, the hyperbaric-O2 treatment can increase the concentration of dissolved O2 to such an extent that this dissolved O2 in the blood can deliver sufficient O2 to satisfy the body's metabolic demands (see Equations 29-1 through 29-3).
CO reaches a lethal level at an Hb saturation of ~50%.
Interestingly, hyperventilation is not an effective treatment for CO poisoning. One reason for this lack of effect may be that hyperventilation blows off CO2 and reduces the arterial ![]() (see pp. 679–680). According to the Bohr effect, low levels of CO2 (e.g., caused by hyperventilation) would shift the Hb-O2 dissociation curve to the left, exacerbating the effect of the CO poisoning. In fact, Yandell Henderson showed that use of 5% CO2 in 95% O2 decreased plasma pH, which accelerated the displacement of CO from HbCO as well as increasing the tissue
(see pp. 679–680). According to the Bohr effect, low levels of CO2 (e.g., caused by hyperventilation) would shift the Hb-O2 dissociation curve to the left, exacerbating the effect of the CO poisoning. In fact, Yandell Henderson showed that use of 5% CO2 in 95% O2 decreased plasma pH, which accelerated the displacement of CO from HbCO as well as increasing the tissue ![]() through the Bohr effect (communicated by Arthur DuBois).
through the Bohr effect (communicated by Arthur DuBois).
Nitric Oxide
Hb also binds NO. This interaction may help ensure that the effects of NO are paracrine rather than endocrine—that is, that the effects of NO are restricted to the sites of release. The physiological target of NO is soluble guanylyl cyclase (see pp. 66–67), which binds NO through a heme group, just as does Hb!