The pulmonary circulation has low pressure and resistance but high compliance
The pulmonary circulatory system handles the same cardiac output as the systemic circulation, but in a very different way. The systemic circulation is a high-pressure system. This high pressure is necessary to pump blood to the top of the brain while the individual is standing, or even to a maximally elevated fingertip. The systemic circulation also needs to be a high-pressure system because it is a high-resistance system. It uses this high resistance to control the distribution of blood flow. Thus, at rest, a substantial fraction of the systemic capillaries are closed, which gives the system the flexibility to redistribute large amounts of blood (e.g., to muscle during exercise). The mean pressure of the aorta is ~95 mm Hg (Table 31-1). At the opposite end of the circuit is the right atrium, which has a mean pressure of ~2 mm Hg. Thus, the driving pressure for blood flow through the systemic circulation is ~93 mm Hg. Given a cardiac output (![]() ) of 5 L/min or 83 mL/s, we can compute the resistance of the systemic system using an equation like Ohm's law (see Equation 17-10):
) of 5 L/min or 83 mL/s, we can compute the resistance of the systemic system using an equation like Ohm's law (see Equation 17-10):
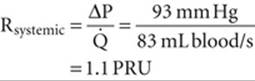
(31-20)
PRU is a peripheral resistance unit (see p. 415), which has the dimension mm Hg/(mL/s).
TABLE 31-1
Comparison of Pressures in the Pulmonary and Systemic Circulatory Systems*
|
PULMONARY CIRCULATION |
SYSTEMIC CIRCULATION |
||
|
LOCATION |
MEAN PRESSURE (mm Hg) |
LOCATION |
MEAN PRESSURE (mm Hg) |
|
Pulmonary artery |
15 |
Aorta |
95 |
|
Beginning of capillary |
12 |
Beginning of capillary |
35 |
|
End of capillary |
9 |
End of capillary |
15 |
|
Left atrium |
8 |
Right atrium |
2 |
|
Net driving pressure |
15 − 8 = 7 |
Net driving pressure |
95 − 2 = 93 |
*The reference point for all pressures is the pressure outside the heart at the level of the left atrium.
In contrast, the pulmonary circulation is a low-pressure system. It can afford to be a low-pressure system because it needs to pump blood only to the top of the lung. Moreover, it must be a low-pressure system to avoid the consequences of Starling forces (see pp. 467–468), which would otherwise flood the lung with edema fluid. The mean pressure in the pulmonary artery is only ~15 mm Hg. Because the mean pressure of the left atrium, at the other end of the circuit, is ~8 mm Hg, and because the cardiac output of the right side of the heart is the same as for the left side, we have
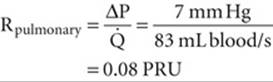
(31-21)
Thus, the total resistance of the pulmonary circulation is less than one tenth that of the systemic system, which explains how the pulmonary circulation accomplishes its mission at such low pressures. Unlike in the systemic circulation, where most of the pressure drop occurs in the arterioles (i.e., between the terminal arteries and beginning of the capillaries), in the pulmonary circulation almost the entire pressure drop occurs rather uniformly between the pulmonary artery and the end of the capillaries. In particular, the arterioles make a much smaller contribution to resistance in the pulmonary circulation than in the systemic circulation.
What are the properties of the pulmonary vasculature that give it such a low resistance? First, let us examine the complete circuit. The pulmonary artery arises from the right ventricle, bifurcates, and carries relatively deoxygenated blood to each lung. The two main branches of the pulmonary artery follow the two mainstem bronchi into the lungs and bifurcate along with the bronchi and bronchioles. A single pulmonary arteriole supplies all of the capillaries of a terminal respiratory unit (see p. 597). Together, the two lungs have ~300 million alveoli. However, they may have as many as 280 billion highly anastomosing capillary segments (each looking like the edge of a hexagon in a piece of chicken wire), or nearly 1000 such capillary segments per alveolus—creating a surface for gas exchange of ~100 m2. It is easy to imagine why some have described the pulmonary capillary bed as a nearly continuous flowing sheet of blood surrounding the alveoli. At rest, the erythrocytes spend ~0.75 second navigating this capillary bed, which contains ~75 mL of blood. During exercise, capillary blood volume may increase to ~200 mL. Pulmonary venules collect the oxygenated blood from the capillary network, converge, course between the lobules, converge some more, and eventually enter the left atrium via the pulmonary veins. The total circulation time through the pulmonary system is 4 to 5 seconds.
Pulmonary blood vessels are generally shorter and wider than their counterparts on the systemic side. Arterioles are also present in much higher numbers in the pulmonary circulation. Although the pulmonary arterioles contain smooth muscle and can constrict, these vessels are far less muscular than their systemic counterparts, and their resting tone is low. These properties combine to produce a system with an unusually low resistance.
The walls of pulmonary vessels have another key property: thinness, like the walls of veins elsewhere in the body. The thin walls and paucity of smooth muscle give the pulmonary vessels a high compliance, which has three consequences. First, pulmonary vessels can accept the relatively large amounts of blood that shift from the legs to the lungs when a person changes from a standing to a recumbent position. Second, as we discuss below, the high compliance also allows the vessels to dilate in response to modest increases in pulmonary arterial pressure. Third, the pulse pressure in the pulmonary system is rather low (on an absolute scale). The systolic/diastolic pressures in the pulmonary artery are typically 25/8 mm Hg, yielding a pulse pressure of ~17 mm Hg. In contrast, the systolic/diastolic pressures in the aorta are ~120/80 mm Hg, for a pulse pressure of ~40 mm Hg. Nonetheless, relative to the mean pulmonary artery pressure of 15 mm Hg, the pulmonary pulse pressure of 17 mm Hg is quite high.
Overall pulmonary vascular resistance is minimal at FRC
Because pulmonary blood vessels are so compliant, they are especially susceptible to deformation by external forces. These forces are very different for vessels that are surrounded by alveoli (i.e., “alveolar” vessels) compared with those that are not (i.e., “extra-alveolar” vessels). In both types, the key consideration is whether these external forces pull vessels open or crush them.
Alveolar Vessels
Alveolar vessels include the capillaries, as well as slightly larger vessels that are also surrounded on all sides by alveoli (Fig. 31-7A). The resistance of these alveolar vessels depends on both the transmural pressure gradient and lung volume.
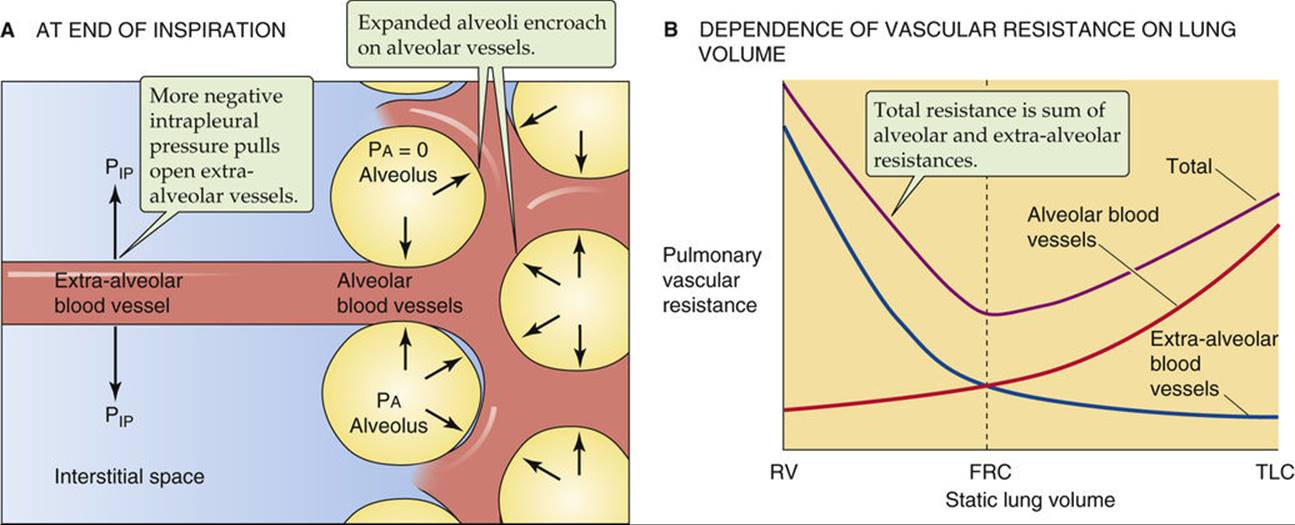
FIGURE 31-7 Pulmonary vascular resistance. (B, Data from Murray JF: The Normal Lung, 2nd ed. Philadelphia, WB Saunders, 1986.)
We have already introduced the transmural pressure gradient (PTM) in our discussions of systemic blood vessels (see p. 414) and conducting airways (see pp. 624–625). For alveolar vessels, PTM is the difference between the pressure in the vessel lumen and that in the surrounding alveoli (PA). For simplicity, we consider the factors affecting PTM at a fixed lung volume.
The pressure inside these vessels varies with the cardiac cycle; indeed, the pulmonary capillary bed is one of the few in which flow is pulsatile (see p. 513). The pressure inside the alveolar vessels also depends greatly on their vertical position relative to the left atrium: the higher the vessel, the lower the pressure.
The pressure in the alveoli varies with the respiratory cycle. With no airflow and the glottis open, PA is the same as PB (i.e., 0 cm H2O). On the other hand, PA is negative during inspiration and positive during expiration. A combination of a high intravascular pressure and a negative PA tends to dilate the compliant alveolar vessels, lowering their resistance. But a combination of a low intravascular pressure and a positive PA crushes these vessels, raising their resistance.
Changes in lung volume (VL) have characteristic effects on alveolar vessels. For simplicity, here we assume that each time we examine a new VL, airflow has stopped, so that PA is zero. As VL increases, the alveolar walls become more stretched out. Consequently, the alveolar vessels become stretched along their longitudinal axis but crushed when viewed in cross section. Both of these effects tend to raise vessel resistance. Thus, as VL increases, the resistance of the alveolar vessels also increases (see Fig. 31-7B, red curve).
Extra-Alveolar Vessels
Because they are not surrounded by alveoli, the extra-alveolar vessels are sensitive to intrapleural pressure (see Fig. 31-7A). Again for simplicity, we examine the effect of changing VL after airflow has already stopped. The increasingly negative values of PIP needed to achieve increasingly higher lung volumes also increase the PTM of the extra-alveolar vessels and tend to dilate them. Thus as VL increases, the resistance of the extra-alveolar vessels decreases (see Fig. 31-7B, blue curve).
In summary, increases in VL tend to crush alveolar vessels and thus increase their resistance, but to expand extra-alveolar vessels and thus decrease their resistance. The net effect on overall pulmonary vascular resistance of increasing VL from residual volume (RV) to TLC is biphasic (see Fig. 31-7B, violet curve). Starting at RV, an increase in VL first causes pulmonary vascular resistance to fall as the dilation of extra-alveolar vessels dominates. Pulmonary vascular resistance reaches its minimum value at about FRC. Further increases in VL (as during a normal inspiration) increase overall resistance as the crushing of alveolar vessels dominates. ![]() N31-11
N31-11
N31-11
Additional Factors Affecting the Resistance of Pulmonary Vessels
Contributed by Emile Boulpaep, Walter Boron
Alveolar Vessels
On pages 684–685 we pointed out that two major factors affect the caliber of alveolar vessels (i.e., vessels surrounded by alveoli): (1) transmural pressure and (2) lung volume (VL) per se. The cardiac cycle and the respiratory cycle are two factors that can affect the transmural pressure of alveolar vessels. A third factor is an indirect effect of increasing lung volume. (This indirect effect is in addition to the direct effect of increasing VL, which stretches the vessels longitudinally and crushes them as they are viewed in cross section.) Let us compare two static conditions: resting at FRC, and holding lung volume at TLC. In order to achieve the higher lung volume, we needed to shift PIP in the negative direction. As discussed on page 685, this decrease in PIP dilates extra-alveolar vessels. Because the volume of these vessels increases, the pressure falls inside all the vessels in the thorax. This decrease in intravascular pressure at negative PIP values accentuates the collapse of the alveolar vessels at high lung volumes.
Extra-Alveolar Vessels
On page 685, we considered only static conditions. What happens when—starting at TLC (where the PIP at rest is very negative)—one makes a maximal expiratory effort? Instantly, PIP becomes very positive, tending to collapse the extra-alveolar vessels, just as this maneuver tends to collapse conducting airways (see pp. 624–626). However, the mechanical tethering (or radial traction) of other structures on the extra-alveolar vessels tends to oppose their collapse, just as—at a high VL—mechanical tethering tends to keep conducing airways open during expiration. However, the effects of mechanical tethering decrease as VL falls during expiration.
Increases in pulmonary arterial pressure reduce pulmonary vascular resistance by recruiting and distending pulmonary capillaries
Although the pulmonary circulation is normally a low-resistance system under resting conditions, it has a remarkable ability to lower its resistance even further. During exercise, 2-fold to 3-fold increases in cardiac output may elicit only a minor increase in mean pulmonary arterial pressure. In other words, a slight increase in pulmonary arterial pressure is somehow able to markedly decrease resistance (Fig. 31-8A) and thus markedly increase flow (see Fig. 31-8B). This behavior is a general property of a passive/elastic vascular bed (see Fig. 19-7A, red curve). Two “passive” mechanisms—that is, mechanisms not related to “active” changes in the tone of vascular smooth muscle—are at work here: the recruitment and distention of pulmonary capillaries. However, before we can understand either change, we must more completely describe the pulmonary capillaries at “rest.”
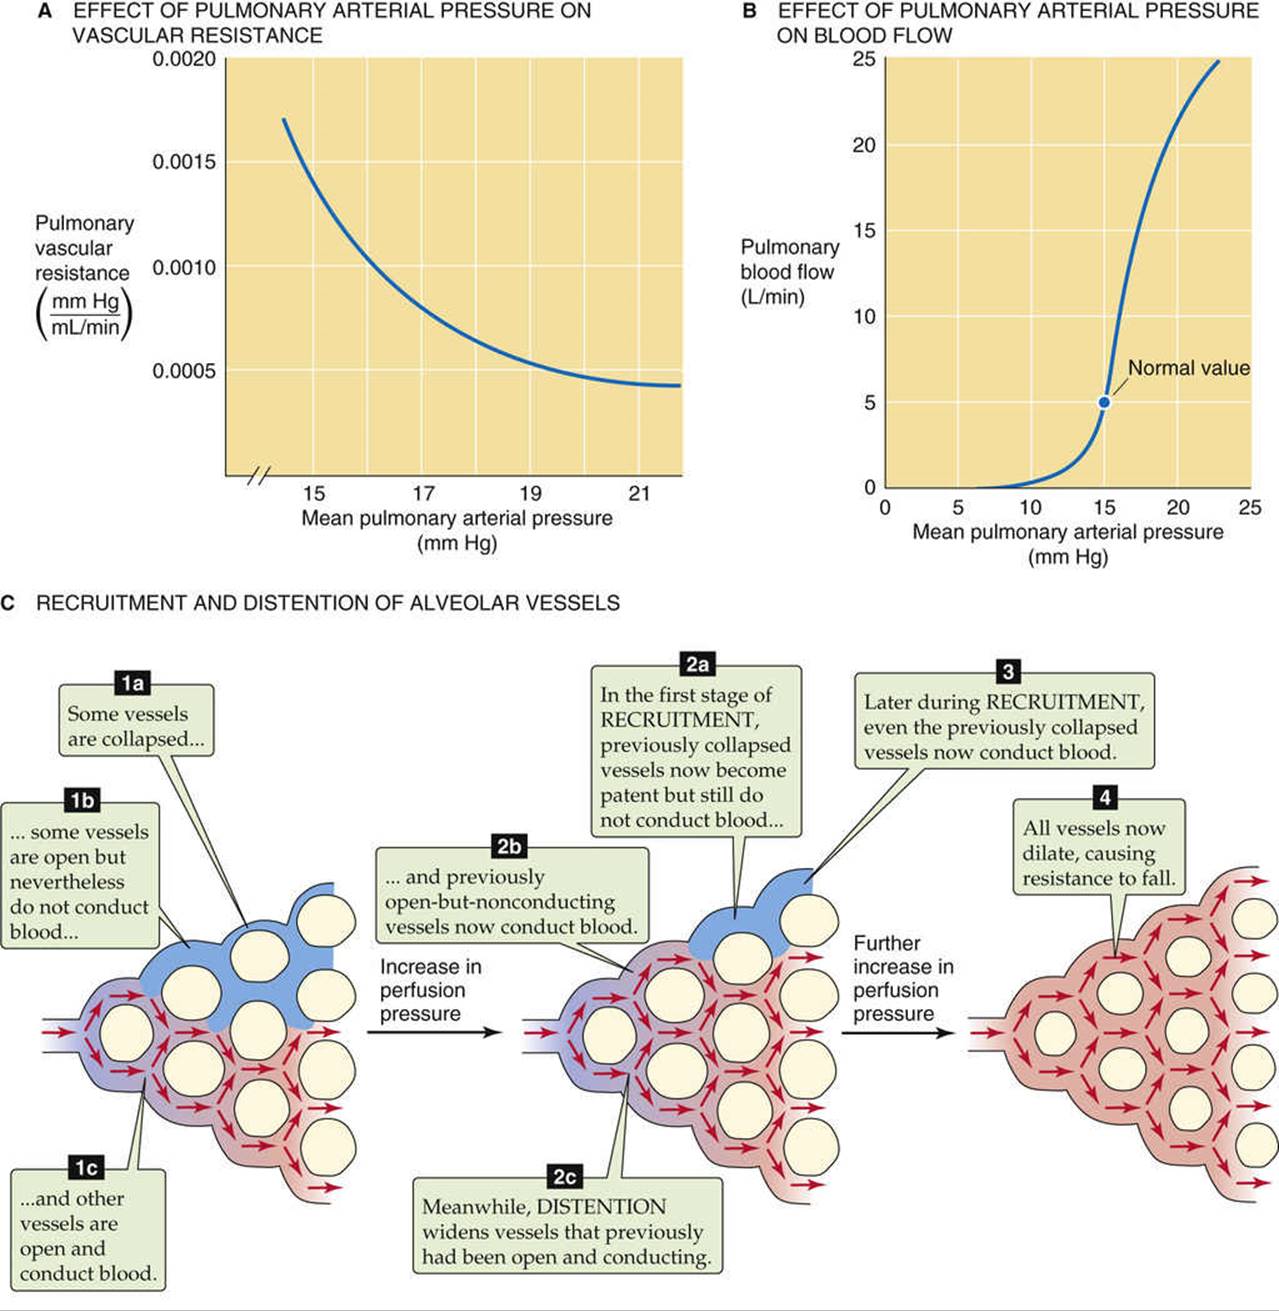
FIGURE 31-8 Effects of perfusion pressure on pulmonary hemodynamics.
Under “resting” conditions (i.e., at relatively low values of pulmonary arterial pressure), some pulmonary capillaries are open and conducting blood, others are open but not conducting substantial amounts of blood, and still others are closed (see Fig. 31-8C). Why should some capillaries be open but have no flow? In a highly anastomosing capillary network, tiny differences in driving pressure might exist. In addition, seemingly random differences in the dimensions of parallel capillaries may lead to differences in resistance. In low-pressure systems, such slight differences in absolute resistance allow pathways with relatively low resistances to steal flow from neighbors with slightly higher resistances, leaving some “open” pathways heavily underutilized. A familiar example is a type of garden hose used to drizzle water on a flower bed; this hose is closed at its distal end, but perforated with hundreds of tiny holes. If water pressure is low, only some of the holes conduct water.
Why should some parallel vessels be closed? Popping open a previously closed vessel requires that the perfusion pressure overcome the tone of the vascular smooth muscle and reach that vessel's critical closing pressure (see p. 454), which varies from vessel to vessel. As we discuss below, alveolar vessels also may be closed because the alveolar pressure exceeds intravascular pressure, thereby crushing the vessel.
Recruitment
Imagine that the pressure inside a pulmonary arteriole starts out at a fairly low level. As pressure increases, some vessels that were completely closed may now open (see Fig. 31-8C). Similarly, capillaries that previously had been open but not conducting now begin to conduct blood. The greater the increase in perfusion pressure, the greater the number of open and conducting vessels. This recruitment of additional parallel capillary pathways reduces overall vascular resistance.
Distention
Once a vessel is open and conducting, further pressure increases will increase PTM and thus cause the vessel to dilate (see Fig. 31-8C). The net effect is a reduction in overall pulmonary resistance. Although a pressure increase can simultaneously recruit and distend various vessels, distention probably tends to occur later; that is, distention is the primary mechanism for lowering resistance under conditions in which the initial pressure was already relatively high.
Hypoxia is a strong vasoconstrictor, opposite to its effect in the systemic circulation
In addition to lung volume and perfusion pressure, several other factors can modulate pulmonary vascular resistance.
Oxygen
The effects of changes in ![]() ,
, ![]() , and pH on pulmonary vascular resistance are opposite to those observed in the systemic circulation. Thus, hypoxia causes pulmonary vasoconstriction. What appears to be critical is not so much the
, and pH on pulmonary vascular resistance are opposite to those observed in the systemic circulation. Thus, hypoxia causes pulmonary vasoconstriction. What appears to be critical is not so much the ![]() in the lumen of the arterioles and venules, but rather the
in the lumen of the arterioles and venules, but rather the ![]() in the alveolar air adjacent to the vessel. Indeed, perfusing the pulmonary vasculature with a hypoxic solution is far less effective than ventilating the airways with a low-
in the alveolar air adjacent to the vessel. Indeed, perfusing the pulmonary vasculature with a hypoxic solution is far less effective than ventilating the airways with a low-![]() air mixture.
air mixture.
Hypoxic vasoconstriction occurs in isolated lung tissue and thus does not rely on either the nervous system or systemic hormones. Rather, the low ![]() is generally believed to act directly on the pulmonary vascular smooth-muscle cells. How this occurs is unknown, but hypothesized mechanisms include all those proposed for the sensing of hypoxia by the peripheral chemoreceptor, which we discuss on page 712. Somehow, the hypoxia inhibits one or more K+ channels, causing the membrane potential of vascular smooth-muscle cells to move away from the equilibrium potential for K+ (EK). This depolarization opens voltage-gated Ca2+ channels, leading to an influx of Ca2+ and smooth-muscle contraction (see p. 247).
is generally believed to act directly on the pulmonary vascular smooth-muscle cells. How this occurs is unknown, but hypothesized mechanisms include all those proposed for the sensing of hypoxia by the peripheral chemoreceptor, which we discuss on page 712. Somehow, the hypoxia inhibits one or more K+ channels, causing the membrane potential of vascular smooth-muscle cells to move away from the equilibrium potential for K+ (EK). This depolarization opens voltage-gated Ca2+ channels, leading to an influx of Ca2+ and smooth-muscle contraction (see p. 247).
Carbon Dioxide and Low pH
High ![]() or low interstitial pH promotes vasoconstriction, although with far less potency than hypoxia. Elevated
or low interstitial pH promotes vasoconstriction, although with far less potency than hypoxia. Elevated ![]() may produce its effect by decreasing the pH of either the extracellular or intracellular fluid. Following a general pattern that is repeated in the control of ventilation (see p. 716), hypoxia makes the vascular smooth-muscle cells more sensitive to respiratory acidosis.
may produce its effect by decreasing the pH of either the extracellular or intracellular fluid. Following a general pattern that is repeated in the control of ventilation (see p. 716), hypoxia makes the vascular smooth-muscle cells more sensitive to respiratory acidosis.
Autonomic Nervous System
The sympathetic and parasympathetic innervation of the pulmonary vasculature is far less impressive than that of the systemic circulation. Increased sympathetic tone seems to reduce the compliance of (i.e., stiffen) the pulmonary artery walls without increasing resistance per se. Increased parasympathetic tone causes a mild vasodilation, the relevance of which is unknown.
Hormones and Other Humoral Agents
The pulmonary blood vessels are relatively unresponsive to hormones and other signaling molecules. Table 31-2 summarizes the actions of some factors that modify pulmonary vascular resistance.
TABLE 31-2
Changes or Agents That Affect Pulmonary Vascular Resistance
|
DILATORS |
CONSTRICTORS |
|
↑ |
↓ |
|
↓ |
↑ |
|
↑ pH |
↓ pH |
|
Histamine, H2 agonists |
Histamine, H1 agonists |
|
PGI2 (prostacyclin), PGE1 |
Thromboxane A2, PGF2α, PGE2 |
|
β-adrenergic agonists (e.g., isoproterenol) |
α-adrenergic agonists |
|
Bradykinin |
Serotonin |
|
Theophylline |
Angiotensin II |
|
Acetylcholine |
|
|
NO |
PG, prostaglandin.
Because of gravity, regional perfusion in an upright subject is far greater near the base than the apex of the lung
When it comes to perfusion—as with ventilation—not all alveoli are created equal. First of all, microscopic or local differences in pulmonary vascular resistance lead to corresponding local differences in perfusion. Of course, pathological processes can exacerbate these differences. In addition, gravity causes large regional differences in perfusion that we can assess by using a 133Xe imaging technique. In Figure 31-5A, we used the inhalation of 133Xe gas to measure the uniformity of ventilation. In Figure 31-9A, we equilibrate a saline solution with a gas mixture containing 133Xe and then inject the solution intravenously as the patient holds his or her breath. When the 133Xe reaches the lungs, it rapidly enters the alveolar air, inasmuch as Xe is poorly soluble in water. A lung scan reveals the distribution of radioactivity, which now reflects the regional uniformity of perfusion. If we normalize the 133Xe to account for differences in regional lung volume—as we did for the ventilation scan—then we can obtain a graph showing how blood flow varies from the bottom to the top of the lung of an upright subject.
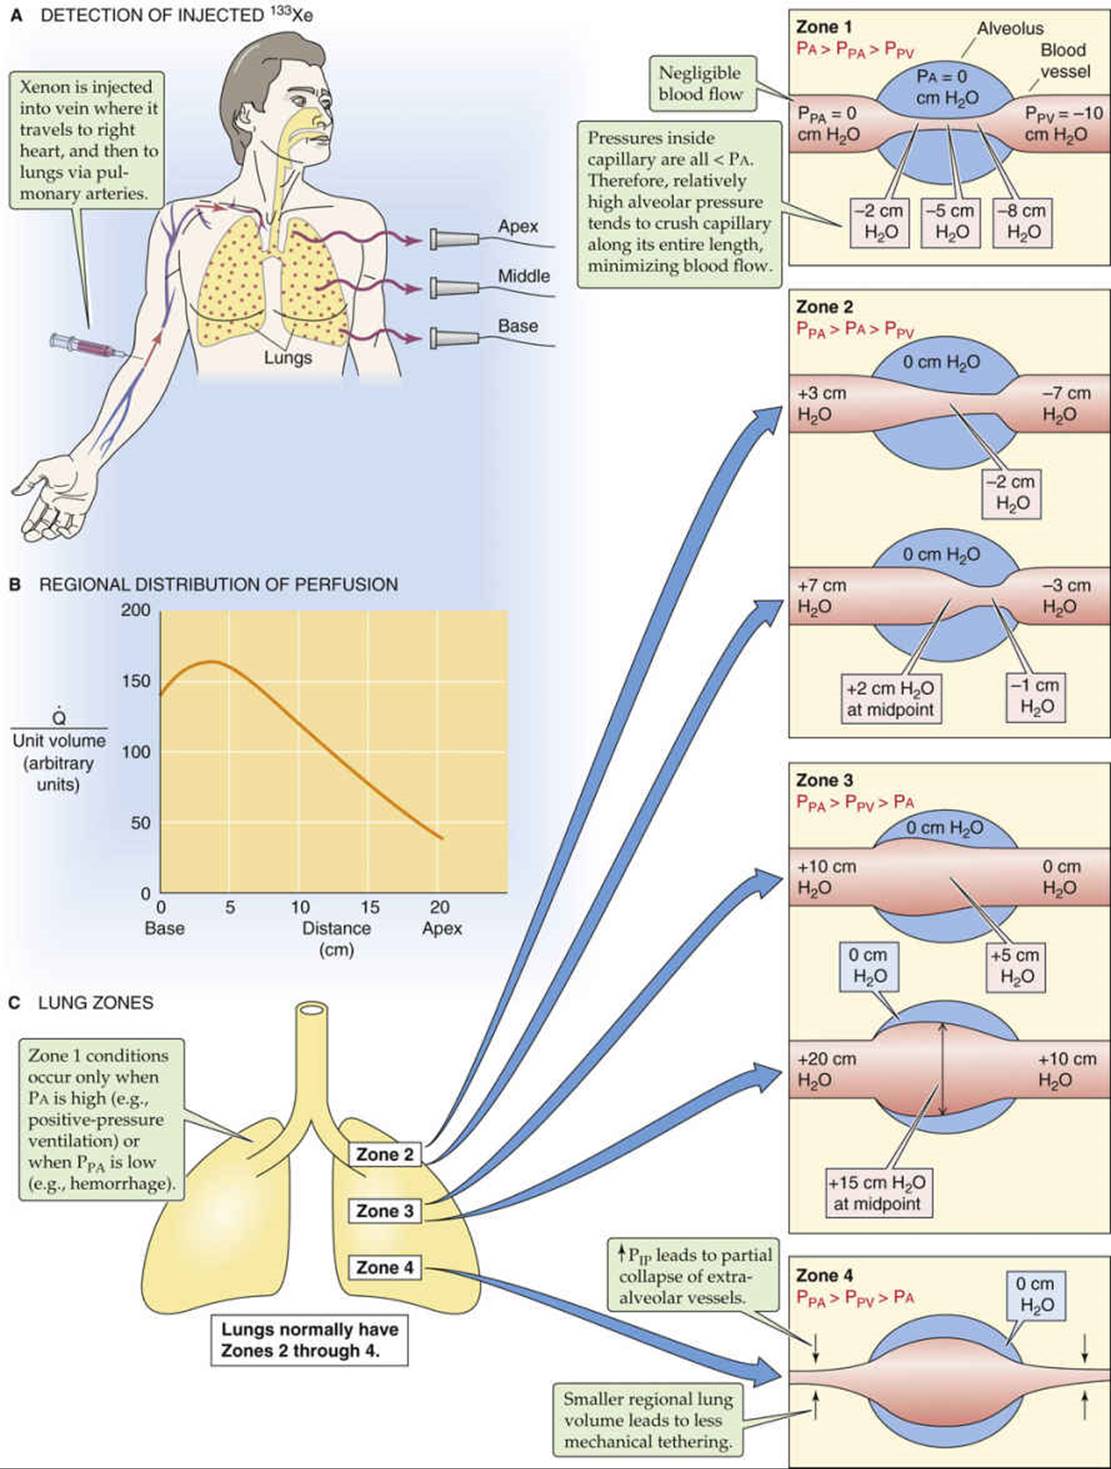
FIGURE 31-9 Physiological nonuniformity of pulmonary perfusion.
The results of such a 133Xe perfusion study show that when the patient is upright, perfusion (![]() ) is greatest near the base of the lungs and falls toward low levels near the apex (see Fig. 31-9B). Note that although regional
) is greatest near the base of the lungs and falls toward low levels near the apex (see Fig. 31-9B). Note that although regional ![]() is highest near the base of the lung,
is highest near the base of the lung, ![]() falls off somewhat from this peak as we approach the extreme base. With exercise, perfusion increases in all regions of the lung, but more so near the apex, so that the nonuniformity of perfusion is less.
falls off somewhat from this peak as we approach the extreme base. With exercise, perfusion increases in all regions of the lung, but more so near the apex, so that the nonuniformity of perfusion is less.
Why should ![]() have this peculiar height dependence? The basic answers are the same as those for the similar question we raised about the regional nonuniformity of ventilation: posture and gravity. Thus, standing on your head will reverse the flow-height relationship, and we would expect height-related differences in flow to be minimal in microgravity conditions.
have this peculiar height dependence? The basic answers are the same as those for the similar question we raised about the regional nonuniformity of ventilation: posture and gravity. Thus, standing on your head will reverse the flow-height relationship, and we would expect height-related differences in flow to be minimal in microgravity conditions.
Figure 31-9C shows how we can divide the upright lung into four zones based on the relationships among various pressures. We define the first three zones based on how alveolar blood vessels are affected by the relative values of three different pressures: alveolar pressure (PA), the pressure inside pulmonary arterioles (PPA), and the pressure inside pulmonary venules (PPV). In the fourth zone, we instead focus on how extra-alveolar vessels are affected by intrapleural pressure (PIP).
Zone 1: PA > PPA > PPV
These conditions prevail at the apex of the lung under certain circumstances. The defining characteristic of a zone 1 alveolar vessel is that PPA and PPV are so low that they have fallen below PA.
At the level of the left atrium (the reference point for the pressure measurements), the mean PPA is ~15 mm Hg (see Table 31-1), which—because mercury is 13.6-fold more dense than water—corresponds to ~20 cm H2O (see Fig. 31-9C, lower illustration for zone 3). Similarly, mean PPV is ~8 mm Hg, or ~10 cm H2O. As we move upward closer to the apex of an upright lung, the actual pressures in the lumens of pulmonary arterioles and venules fall by 1 cm H2O for each 1 cm of vertical ascent. In the hypothetical case in which alveoli at the lung apex are 20 cm above the level of the left atrium, the mean PPA of these alveoli would be 0 cm H2O (see Fig. 31-9C, zone 1). The corresponding PPV would be about −10 cm H2O. The pressure inside the pulmonary capillary (Pc) would be intermediate, perhaps −5 cm H2O. In principle, blood would still flow through this capillary—the driving pressure would be ~10 cm H2O—were it not for the pressure inside the surrounding alveoli, which is 0 cm H2O between breaths. Therefore, because PA is much higher than Pc, the negative PTM (see p. 414) would tend to crush the capillary and reduce blood flow.
Fortunately, zone 1 conditions do not exist for normal people at rest. However, they can arise if there is either a sufficient decrease in PPA (e.g., in hemorrhage) or a sufficient increase in PA (e.g., in positive-pressure ventilation).
Zone 2: PPA > PA > PPV
These conditions normally prevail from the apex to the mid-lung. The defining characteristic of zone 2 is that mean PPA and PPV are high enough so that they sandwich PA (see Fig. 31-9C, zone 2). Thus, at the arteriolar end, the positive PTM causes the alveolar vessel to dilate. Further down the capillary, though, luminal pressure gradually falls below PA, so that the negative PTM squeezes the vessel, raising resistance and thus reducing flow. As we move downward in zone 2, the crushing force decreases because the hydrostatic pressures in the arteriole, capillary, and venule all rise in parallel by 1 cm H2O for each 1 cm of descent (see Fig. 31-9C, upper → lower illustrations for zone 2). Simultaneously, resistance decreases. The conversion of a closed vessel (or one that is open but not conducting) to a conducting one by increased PPA and PPV is an example of recruitment.
Zone 3: PPA > PPV > PA
These conditions prevail in the middle to lower lung. The defining characteristic of zone 3 is that mean PPA and PPV are so high that they both exceed PA (see Fig. 31-9C, zone 3). Thus, PTM is positive along the entire length of the alveolar vessel, tending to dilate it. As we move downward in zone 3, the hydrostatic pressures in the arteriole, capillary, and venule all continue to rise by 1 cm H2O for each 1 cm of descent. Because PA between breaths does not vary with height in the lung, the gradually increasing pressure of the alveolar vessel produces a greater and greater PTM, causing the vessel to dilate more and more—an example of distention (see Fig. 31-9C, upper → lower illustrations for zone 3). This distention causes a gradual decrease in resistance of the capillaries as we move downward in zone 3. Hence, although the driving force (PPA − PPV) remains constant, perfusion increases toward the base of the lung.
The arrangement in which a variable PTM controls flow is known as a Starling resistor. Keep in mind that the driving force (PPA − PPV) is constant in all of the zones.
Zone 4: PPA > PPV > PA
These conditions prevail at the extreme base of the lungs. In zone 4, the alveolar vessels behave as in zone 3; they dilate more as we descend toward the base of the lung. However, the extra-alveolar vessels behave differently. At the base of the lung, PIP is least negative (see Fig. 31-5C). Thus, as we approach the extreme base of the lung, the distending forces acting on the extra-alveolar blood vessels fade, and the resistance of these extra-alveolar vessels increases (see Fig. 31-9C, zone 4). Recall that we saw a similar effect—at the level of the whole lung (see Fig. 31-7B, blue curve)—where resistance of the extra-alveolar vessels increased as lung volume fell (i.e., as PIP became less negative). Because these extra-alveolar vessels feed or drain the alveolar vessels, ![]() begins to fall from its peak as we approach the extreme base of the lungs (see Fig. 31-9B).
begins to fall from its peak as we approach the extreme base of the lungs (see Fig. 31-9B).
These lung zones are physiological, not anatomical. The boundaries between the zones are neither fixed nor sharp. For example, the boundaries can move downward with positive-pressure ventilation (which increases PA) and can move upward with exercise (which increases PPA). In our discussion of lung zones, we have tacitly assumed that PA is always zero and that the values of PPA and PPV are stable and depend only on height in the lung. In real life, of course, things are more complicated. During the respiratory cycle, PA becomes negative during inspiration (promoting dilation of alveolar vessels) but positive during expiration. During the cardiac cycle, the pressure inside the arterioles and pulmonary capillaries is greatest during systole (promoting dilation of the vessel) and lowest during diastole. Thus, we would expect blood flow through an alveolar vessel to be greatest when inspiration coincides with systole.