19. Integrated Control of the Cardiovascular System |
|
REGULATION OF CARDIAC OUTPUT AND BLOOD PRESSURE |
|
Four factors control cardiac output: heart rate, myocardial contractility, preload, and afterload (Fig. 19-1). Heart rate and myocardial contractility are strictly cardiac factors, although they are controlled by various neural and humoral mechanisms. Preload and afterload are factors that are mutually dependent on function of the heart and the vasculature and are important determinants of cardiac output. Preload and afterload are themselves determined by cardiac output and by certain vascular characteristics. Preload and afterload will be called coupling factors because they constitute a functional coupling between the heart and blood vessels. To understand regulation of cardiac output, the nature of the coupling between the heart and the vascular system must be appreciated. |
|
In this chapter, two kinds of graphs are used to analyze interactions between the cardiac and vascular components of the circulatory system. The first curve is called the cardiac function curve. It is an expression of the well-known Frank-Starling relationship and it illustrates the dependence of cardiac output on preload (i.e., central venous, or right atrial, pressure). The cardiac function curve is a characteristic of the heart itself and is usually studied in hearts completely isolated from the rest of the circulation. This curve has already been discussed in detail in Chapters 16 and 17. We use this curve later in this chapter in association with the other characteristic curve to analyze interactions between the heart and the vasculature. |
|
The second curve, called the vascular function curve, defines the dependence of central venous pressure on cardiac output. This relationship depends only on certain vascular system characteristics, namely, peripheral vascular resistance, arterial and venous compliance, and blood volume. The vascular function curve is entirely independent of the characteristics of the heart. Because of this independence, it can be derived experimentally even if a mechanical pump replaces the heart. |
|
VASCULAR FUNCTION CURVE |
|
The vascular function curve defines the changes in central venous pressure that are caused by changes in cardiac output. In this curve, central venous pressure is the dependent variable (or response), and cardiac output is the independent variable (or stimulus). These variables are opposite those of the cardiac function curve, in which central venous pressure (or preload) is the independent variable and cardiac output is the dependent variable. |
|
The simplified model of the circulation shown in Figure 19-2 helps explain how cardiac output determines the level of central venous pressure. In this model, all essential components of the cardiovascular system have been lumped into four basic elements. The right and left sides of the heart, as well as the pulmonary vascular bed, constitute a pump-oxygenator, much like an artificial heart-lung machine used to perfuse the body during open-heart surgery. The high-resistance microcirculation is designated the peripheral resistance. Finally, the compliance of the system is subdivided into arterial compliance (Ca) and venous compliance (Cv). As defined in Chapter 17, the compliance (C) of a blood vessel is the change in volume (ΔV) that is accommodated in that vessel per unit change in transmural pressure (ΔP); that is, |
|
Venous compliance is about 20 times greater than arterial compliance. In our example, the ratio of Cv to Ca is set at 19 : 1 to simplify calculations.* |
|
To show how a change in cardiac output causes an inverse change in central venous pressure, our hypothetical model will have certain characteristics that mimic those of an average adult person (Fig. 19-2, A). The flow (Qh) generated by the heart (i.e., cardiac output) will be 5 L/min; mean arterial pressure, Pa, will be 102 mm Hg; and central venous pressure, Pv, will be 2 mm Hg. Peripheral resistance, R, is the ratio of the arteriovenous pressure difference (Pa - Pv) to flow (Qr) through the resistance vessels; this ratio will equal 20 mm Hg/L/min. |
|
page 393 |
|
|
|
page 394 |
|
|
|
Figure 19-1 The four factors that determine cardiac output. |
|
An arteriovenous pressure difference of 100 mm Hg is sufficient to force a flow (Qr) of 5 L/min through a peripheral resistance of 20 mm Hg/L/min (Fig. 19-2, A). Under equilibrium conditions, this flow (Qr) is precisely equal to the flow (Qh) pumped by the heart. From heartbeat to heartbeat, the volume (Va) of blood in the arteries and the volume (Vv) of blood in the veins remain constant because the volume of blood transferred from the veins to the arteries by the heart equals the volume of blood that flows from the arteries through the resistance vessels and into the veins. |
|
Effects of Cardiac Arrest on Arterial and Venous Pressure |
|
Figure 19-2, B, shows the circulation at the very beginning of an episode of cardiac arrest; that is, Qh = 0. In the instant immediately after arrest of the heart, the volume of blood in the arteries (Va) and veins (Vv) has not had time to change appreciably. Because arterial pressure and venous pressure depend on Va and Vv, respectively, these pressures are identical to the respective pressures in Figure 19-2, A (i.e., Pa = 102 and Pv = 2). This arteriovenous pressure gradient of 100 mm Hg forces a flow (Qr) of 5 L/min through the peripheral resistance of 20 mm Hg/L/min. Thus, although cardiac output (Qh) now equals 0 L/min, flow through the microcirculation equals 5 L/min because the potential energy stored in the arteries by the preceding pumping action of the heart causes blood to be transferred from arteries to veins. This transfer occurs initially at the control rate, even though the heart can no longer transfer blood from the veins to the arteries. |
|
As the heart continues in arrest, blood flow through the resistance vessels causes the blood volume in the arteries to decrease progressively and the blood volume in the veins to increase progressively at the same absolute rate. Because the arteries and veins are elastic structures, arterial pressure falls gradually and the venous pressure rises gradually. This process continues until arterial and venous pressures become equal (Fig. 19-2, C). Once this condition is reached, flow (Qr) from the arteries to the veins through the resistance vessels is zero, as is Qh. |
|
When the effects of cardiac arrest reach this equilibrium state (Fig. 19-2, C), the pressure attained in the arteries and veins depends on the relative compliance of these vessels. If arterial compliance (Ca) and venous compliance (Cv) are equal, the decline in Pa would equal the rise in Pv because the decrease in arterial volume would equal the increase in venous volume (principle of conservation of mass). Both Paand Pv would attain the average of their combined values in Figure 19-2, A; that is, Pa = Pv = (102 + 2)/2 = 52 mm Hg. However, Ca and Cv in a living subject are not equal. Veins are much more compliant than arteries; the compliance ratio (Cv/Ca) is approximately 19, the ratio that we have assumed for the model. When the effects of cardiac arrest reach equilibrium in an intact subject, the pressure in the arteries and veins is much less than the average value of 52 mm Hg that occurs when Ca and Cv are equal. Hence, transfer of blood from arteries to veins at equilibrium induces a fall in arterial pressure 19 times greater than the concomitant rise in venous pressure. As Figure 19-2, C, shows, Pv would increase by 5 mm Hg (to 7 mm Hg), whereas Pa would fall by 19 × 5 = 95 mm Hg (to 7 mm Hg). This equilibrium pressure, which prevails in the absence of flow, is referred to as either mean circulatory pressure or static pressure. The pressure in the static system reflects the total blood volume in the system and the overall compliance of the system. |
|
The example of cardiac arrest aids our understanding of the vascular function curve. One can now begin to assemble a vascular function curve (Fig. 19-3). The independent variable (plotted along the x axis) is cardiac output, and the dependent variable (plotted along the y axis) is central venous pressure. Two important points on this curve can be derived from the example in Figure 19-2. One point (A in Fig. 19-3) represents the control state; that is, when cardiac output is 5 L/min, Pv is 2 mm Hg (as depicted in Fig. 19-2, A). Then, when the heart is arrested (cardiac output = 0), Pv becomes 7 mm Hg at equilibrium (Fig. 19-2, C); this pressure is the mean circulatory pressure (Pmc in Fig. 19-3). |
|
The inverse relationship between Pv and cardiac output simply denotes that when cardiac output is suddenly decreased, the rate at which blood flows from arteries to veins through the capillaries is temporarily greater than the rate at which the heart pumps blood from the veins back into the arteries. During that transient period, a net volume of blood is transferred from arteries to veins; hence, Pa falls and Pv rises. |
|
page 394 |
|
|
|
page 395 |
|
|
|
Figure 19-2 A to D, Simplified model of the cardiovascular system consisting of a pump, arterial compliance (Ca), peripheral resistance, and venous compliance (Cv). |
|
Now let us suddenly increase cardiac output. This example will illustrate how a third point (B in Fig. 19-3) on the vascular function curve is derived. Consider that the arrested heart is suddenly restarted and immediately begins pumping blood from the veins into the arteries at a rate of 1 L/min (Fig. 19-2, D). When the heart first begins to beat, the arteriovenous pressure gradient is zero, and no blood is transferred from the arteries through the capillaries and into the veins. Thus, when beating resumes, blood is depleted from the veins at the rate of 1 L/min, and arterial blood volume is repleted from venous blood volume at that same absolute rate. Hence, Pv begins to fall and Pa begins to rise. Because of the difference in arterial and venous compliance, Pa will rise at a rate 19 times faster than the rate at which Pv will fall. |
|
The resultant arteriovenous pressure gradient causes blood to flow through the peripheral resistance. If the heart maintains a constant output of 1 L/min, Pa will continue to rise and Pv will continue to fall until the pressure gradient becomes 20 mm Hg. This gradient will force a flow of 1 L/min through a resistance of 20 mm Hg/L/min. This gradient will be achieved by a 19-mm Hg rise (to 26 mm Hg) in Pa and a 1-mm Hg fall (to 6 mm Hg) in Pv. This equilibrium value of Pv = 6 mm Hg for a cardiac output of 1 L/min also appears on the vascular function curve of Figure 19-3 (point B). The 1-mm Hg reduction in Pv reflects a net transfer of blood from the venous to the arterial side of the circuit. |
|
page 395 |
|
|
|
page 396 |
|
The reduction in Pv that can be evoked by a sudden increase in cardiac output is limited. At some critical maximal value of cardiac output, sufficient fluid will be transferred from the venous to the arterial side of the circuit for Pv to fall below ambient pressure. In a system of very distensible vessels, such as the venous system, the vessels will be collapsed by the greater external pressure (see Chapter 17). This venous collapse impedes venous return to the heart. Hence, it limits the maximal value of cardiac output to 7 L/min in this example (Fig. 19-3), regardless of the capabilities of the pump. |
|
Factors That Influence the Vascular Function Curve |
|
Dependence of Venous Pressure on Cardiac Output |
|
Experimental and clinical observations have shown that changes in cardiac output do indeed evoke the alterations in Pa and Pv that have been predicted by our simplified model. |
|
Blood Volume |
|
IN THE CLINIC |
|
Cardiac output may decrease abruptly when a major coronary artery suddenly becomes occluded in a human patient. The acute heart failure that occurs as a result of myocardial infarction (death of myocardial tissue) is usually accompanied by a fall in arterial blood pressure and a rise in central venous pressure. |
|
|
|
|
|
Figure 19-3 Changes in central venous pressure produced by changes in cardiac output. The mean circulatory pressure (or static pressure), Pmc, is the equilibrium pressure throughout the cardiovascular system when cardiac output is 0. Points B and A represent the values of venous pressure at a cardiac output of 1 and 5 L/min, respectively. |
|
The vascular function curve is affected by variations in total blood volume. During circulatory standstill (zero cardiac output), mean circulatory pressure depends only on total vascular compliance and blood volume. For a given vascular compliance, mean circulatory pressure is increased when blood volume is expanded (hypervolemia) and is decreased when blood volume is diminished (hypovolemia). This relationship is illustrated by the y axis intercepts in Figure 19-4, where mean circulatory pressure is 5 mm Hg after hemorrhage and 9 mm Hg after transfusion, as compared with a value of 7 mm Hg at normal blood volume (normovolemia or euvolemia). |
|
From Figure 19-4 it is also apparent that the cardiac output at which Pv = 0 varies directly with blood volume. Therefore, the maximal value of cardiac output becomes progressively more limited as the total blood volume is reduced. However, the central venous pressure at which the veins collapse (illustrated by the sharp change in slope of the vascular function curve) is not significantly altered by changes in blood volume. This pressure depends only on the ambient pressure surrounding the central veins. Ambient pressure is the pleural pressure in the thorax (see Chapter 21). |
|
Venomotor Tone |
|
|
|
Figure 19-4 Effects of increased blood volume (transfusion curve) and decreased blood volume (hemorrhage curve) on the vascular function curve. Similar shifts in the vascular function curve can be produced by increases and decreases, respectively, in venomotor tone. |
|
page 396 |
|
|
|
page 397 |
|
The effects of changes in venomotor tone on the vascular function curve closely resemble those for changes in blood volume. In Figure 19-4, for example, the transfusion curve could also represent increased venomotor tone, whereas the hemorrhage curve could represent decreased tone. During circulatory standstill, for a given blood volume the pressure within the vascular system will rise as smooth muscle tension exerted within the vascular walls increases (these contractile changes in arteriolar and venous smooth muscle are under nervous and humoral control). The fraction of the blood volume located within the arterioles is very small, whereas the blood volume in the veins is large (see Table 15-1). Thus, changes in peripheral resistance (arteriolar tone) have no significant effect on mean circulatory pressure, but changes in venous tone can alter mean circulatory pressure appreciably. Hence, mean circulatory pressure rises with increased venomotor tone and falls with diminished venomotor tone. |
|
Experimentally, the mean circulatory pressure attained about 1 minute after abrupt circulatory standstill is usually substantially above 7 mm Hg, even when blood volume is normal. This high pressure level is attributable to the generalized venoconstriction that is caused by cerebral ischemia, activation of chemoreceptors, and reduced excitation of baroreceptors. If resuscitation fails, this reflex response subsides as central nervous activity ceases, and mean circulatory pressure usually falls to a value close to 7 mm Hg. |
|
Blood Reservoirs |
|
Venoconstriction is considerably greater in certain regions of the body than in others. In effect, vascular beds that undergo significant venoconstriction constitute blood reservoirs. The skin's vascular bed is one of the major blood reservoirs in humans. Blood loss evokes profound subcutaneous venoconstriction, which gives rise to the characteristically pale appearance of the skin in response to hemorrhage. Diversion of blood away from the skin frees several hundred milliliters of blood that can be perfused through more vital regions of the body. The vascular beds of the liver, lungs, and spleen are also important blood reservoirs. In humans, however, the volume changes in the spleen are considerably less extensive (see also Exercise and Hemorrhage). |
|
Peripheral Resistance |
|
The changes in the vascular function curve induced by alterations in arteriolar tone are shown in Figure 19-5. The amount of blood in the arterioles is small-they contain only about 3% of total blood volume (see Chapter 15). Changes in the contractile state of arterioles do not significantly alter mean circulatory pressure. Thus, vascular function curves that represent different peripheral resistances converge at a common point on the abscissa. |
|
|
|
Figure 19-5 Effects of arteriolar dilation and constriction on the vascular function curve. |
|
Pv varies inversely with total peripheral resistance (TPR) when all other factors remain constant. Physiologically, the relationship between Pv and TPR can be explained as follows: if cardiac output is held constant, a sudden increase in TPR causes a progressively greater volume of blood to be retained in the arterial system. Blood volume in the arterial system continues to increase until Pa rises sufficiently to force a flow of blood equal to cardiac output through the resistance vessels. If total blood volume does not change, this increase in arterial blood volume is accompanied by an equivalent decrease in venous blood volume. Hence, an increase in TPR diminishes Pv proportionately. This relationship between TPR and Pv, together with the inability of peripheral resistance to affect mean circulatory pressure, accounts for the clockwise rotation of the vascular function curves in response to increased arteriolar constriction (see Fig. 19-5). Similarly, arteriolar dilation produces a counterclockwise rotation from the same vertical axis intercept. A higher maximal level of cardiac output is attainable when the arterioles are dilated than when they are constricted (Fig. 19-5). |
|
Interrelationships between Cardiac Output and Venous Return |
|
Cardiac output and venous return are tightly linked. Except for small, transient disparities, the heart cannot pump any more blood than is delivered to it through the venous system. Similarly, because the circulatory system is a closed circuit, venous return to the heart must equal cardiac output over any appreciable time interval. The flow around the entire closed circuit depends on the capability of the pump, the characteristics of the circuit, and the total fluid volume of the system. |
|
Thus, cardiac output and venous return are simply two terms for the flow around this closed circuit. Cardiac output is the volume of blood being pumped by the heart per unit time. Venous return is the volume of blood returning to the heart per unit time. At equilibrium, these two flows are equal. In the following section we apply certain techniques of circuit analysis to gain some insight into the control of flow around the circuit. |
|
RELATING THE CARDIAC FUNCTION CURVE TO THE VASCULAR FUNCTION CURVE |
|
Coupling between the Heart and the Vasculature |
|
In accordance with Starling's law of the heart, cardiac output depends closely on right atrial (or central venous) pressure. Furthermore, right atrial pressure is approximately equal to right ventricular end-diastolic pressure because the normal tricuspid valve acts as a low-resistance junction between the right atrium and ventricle. Graphs of cardiac output as a function of central venous pressure (Pv) are called cardiac function curves; extrinsic regulatory influences may be expressed as shifts in such curves. |
|
page 397 |
|
|
|
page 398 |
|
|
|
Figure 19-6 Typical vascular and cardiac function curves plotted on the same coordinate axes. Note that to plot both curves on the same graph, the x and y axes for the vascular function curves had to be reversed; compare the assignment of axes with that in Figures 19-3, 19-4, and 19-5. The coordinates of the equilibrium point, at the intersection of the cardiac and vascular function curves, represent the stable values of cardiac output and central venous pressure at which the system tends to operate. Any perturbation (e.g., a sudden increase in venous pressure to point A) institutes a sequence of changes in cardiac output and venous pressure that restore these variables to their equilibrium values. |
|
A typical cardiac function curve is plotted on the same coordinates as a normal vascular function curve in Figure 19-6. The cardiac function curve is plotted according to the usual convention; that is, the independent variable (Pv) is plotted along the abscissa, and the dependent variable (cardiac output) is plotted along the ordinate. From the Frank-Starling mechanism, the cardiac function curve reveals that a rise in Pv increases cardiac output. |
|
Conversely, the vascular function curve describes an inverse relationship between cardiac output and Pv; that is, a rise in cardiac output diminishes Pv. Pv is the dependent variable (or response) and cardiac output is the independent variable (or stimulus) for the vascular function curve. Therefore, to plot a vascular function curve in the conventional manner, Pv should be scaled along the y axis and cardiac output along the x axis. |
|
To plot the cardiac and vascular function curves on the same set of axes requires a modification of the plotting convention for one of these curves. We arbitrarily violate the convention for the vascular function curve. Note that the vascular function curve in Figure 19-6 is intended to reflect how Pv (scaled along the x axis) varies in response to a change in cardiac output (scaled along the y axis). |
|
When the cardiovascular system is represented by a given pair of cardiac and vascular function curves, the intersection of these two curves defines the equilibrium point of that system. The coordinates of this equilibrium point represent the values of cardiac output and Pv at which the system tends to operate. Only transient deviations from such values of cardiac output and Pv are possible, as long as the given cardiac and vascular function curves accurately describe the system. |
|
|
|
Figure 19-7 Enhancement of myocardial contractility, as by cardiac sympathetic nerve stimulation, causes the equilibrium values of cardiac output and central venous pressure (Pv) to shift from the intersection (point A) of the control vascular and cardiac function curves (continuous curve) to the intersection (point D) of the same vascular function curve with the cardiac function curve (dashed curve) that represents the response to sympathetic stimulation. |
|
The tendency to operate about this equilibrium point may best be illustrated by examining the response to a sudden change. Consider the changes caused by a sudden rise in Pv from the equilibrium point to point A in Figure 19-6. This change in Pv might be caused by the rapid injection, during ventricular diastole, of a given volume of blood on the venous side of the circuit and simultaneous withdrawal of an equal volume from the arterial side of the circuit. Thus, although Pv rises, total blood volume remains constant. |
|
As defined by the cardiac function curve, this elevated Pv would increase cardiac output (from A to B) during the next ventricular systole. The increased cardiac output would then transfer a net quantity of blood from the venous to the arterial side of the circuit, with a consequent reduction in Pv. In one heartbeat the reduction in Pv would be small (from B to C) because the heart would transfer only a fraction of the total venous blood volume to the arterial side. As a result of this reduction in Pv, cardiac output during the very next beat diminishes (from C to D) by an amount dictated by the cardiac function curve. Because D is still above the intersection point, the heart will pump blood from the veins to the arteries at a rate greater than that at which blood will flow across the peripheral resistance from arteries to veins. Hence, Pv will continue to fall. This process will continue in diminishing steps until the point of intersection is reached. Only one specific combination of cardiac output and venous pressure-the equilibrium point, denoted by the coordinates of the point at which the curves intersect-will simultaneously satisfy the requirements of the cardiac and vascular function curves. Stable operation of the system at the equilibrium point (A, in Fig. 19-6) indicates that cardiac output equals venous return. |
|
page 398 |
|
|
|
page 399 |
|
Myocardial Contractility |
|
Combinations of cardiac and vascular function curves also help explain the effects of alterations in ventricular contractility on cardiac output and Pv. In Figure 19-7, the lower cardiac function curve represents the control state, whereas the upper curve reflects the influence of increased myocardial contractility. This pair of curves is analogous to the "family" of ventricular function curves shown in Figure 18-12. The enhanced ventricular contractility represented by the upper curve in Figure 19-7 can be produced by electrical stimulation of the cardiac sympathetic nerves. When the effects of such neural stimulation are restricted to the heart, the vascular function curve is unaffected. Therefore, only one vascular function curve is needed for this hypothetical intervention (Fig. 19-7). |
|
During the control state of the model, the equilibrium values for cardiac output and Pv are designated by point A in Figure 19-7. Cardiac sympathetic nerve stimulation abruptly raises cardiac output to point B because of the enhanced myocardial contractility. However, this high cardiac output increases the net transfer of blood from the venous to the arterial side of the circuit, and consequently, Pv subsequently begins to fall (to point C). The reduction in Pv then leads to a small decrease in cardiac output. However, cardiac output is still sufficiently high to effect the net transfer of blood from the venous to the arterial side of the circuit. Thus, Pv and cardiac output both continue to fall gradually until a new equilibrium point (D) is reached. This equilibrium point is located at the intersection of the vascular function curve and the new cardiac function curve. Point D lies above and to the left of the control equilibrium point (A) and indicates that sympathetic stimulation can evoke greater cardiac output despite the lower level of Pv. |
|
The biological response to enhancement of myocardial contractility is mimicked by the hypothetical change predicted by our model. As depicted in Figure 19-8, sympathetic nerves innervating the heart are stimulated during the time denoted by the two arrows. During neural stimulation, cardiac output (aortic flow) rose quickly to a peak value and then fell gradually to a steady-state value significantly greater than the control level. The increased aortic flow was accompanied by reductions in right and left atrial pressure (PRA and PLA). |
|
Blood Volume |
|
Changes in blood volume do not directly affect myocardial contractility, but they do influence the vascular function curve in the manner shown in Figure 19-4. Thus, to understand how changes in blood volume affect cardiac output and Pv, the appropriate cardiac function curve is plotted along with the vascular function curves that represent the control and experimental states (Fig. 19-9). |
|
|
|
Figure 19-8 During electrical stimulation of the cardiac sympathetic nerve fibers, aortic blood flow (cardiac output) increased while pressure in the left atrium (PLA) and right atrium (PRA) diminished. These data conform to the conclusions derived from Figure 19-7, in which the equilibrium values of cardiac output and venous pressure are observed to shift from point A to point D (i.e., cardiac output increased, but central venous pressure decreased) during cardiac sympathetic nerve stimulation. (Redrawn from Sarnoff SJ et al: Circ Res 8:1108, 1960.) |
|
|
|
Figure 19-9 After a blood transfusion, the vascular function curve is shifted to the right. Therefore, cardiac output and venous pressure are both increased, as denoted by translocation of the equilibrium point from A to B. |
|
page 399 |
|
|
|
page 400 |
|
IN THE CLINIC |
|
Heart failure is a general term that applies to conditions in which the pumping capability of the heart is impaired to the extent that the tissues of the body are not adequately perfused. In heart failure, myocardial contractility is impaired. Heart failure may be acute or chronic. Consequently, in a graph of cardiac and vascular function curves, the cardiac function curve is shifted downward and to the right, as depicted in Figure 19-10. |
|
Acute heart failure may be caused by toxic concentrations of drugs or by certain pathological conditions such as coronary artery occlusion. In acute heart failure, blood volume does not change immediately. In Figure 19-10, therefore, the equilibrium point shifts from the intersection (A) of the normal curves to the intersection (B or C) of the normal vascular function curve with one of the curves that depict depressed cardiac function. |
|
Chronic heart failure may occur in conditions such as essential hypertension or ischemic heart disease. In chronic heart failure, both the cardiac function and vascular function curves shift. The vascular function curve shifts because of an increase in blood volume caused in part by fluid retention by the kidneys. The fluid retention is related to the concomitant reduction in glomerular filtration rate and the decreased renal excretion of NaCl and water (see also Chapter 34). The resultant hypervolemia is reflected by a rightward shift of the vascular function curve, as shown in Figure 19-10. Hence, with moderate degrees of heart failure, Pv is elevated, but cardiac output may be normal (D). With more severe degrees of heart failure, Pv is still greater, but cardiac output is subnormal (E). |
|
|
|
|
|
Figure 19-10 Moderate or severe heart failure shifts the cardiac function curves downward and to the right. Before changes in blood volume, cardiac output decreases and central venous pressure rises (from control equilibrium point A to point B or point C). After the increase in blood volume that usually occurs in heart failure, the vascular function curve is shifted to the right. Hence, central venous pressure may be elevated with no reduction in cardiac output (point D) or (in severe heart failure) with some reduction in cardiac output (point E). |
|
When blood volume is increased by a blood transfusion, the equilibrium point (B), which denotes the values of cardiac output and Pv after transfusion, lies above and to the right of the control equilibrium point (A). Thus, transfusion increases both cardiac output and Pv. Hemorrhage causes the opposite effect. Mechanistically, the change in ventricular filling pressure (central venous pressure) evoked by a given change in blood volume alters cardiac output by changing the sensitivity of the contractile proteins to the prevailing concentration of intracellular Ca++ (see Chapters 17 and 18). For reasons explained earlier, pure increases or decreases in venomotor tone elicit responses that are like those evoked by increases or decreases, respectively, in total blood volume. |
|
Peripheral Resistance |
|
Analysis of the effects of changes in peripheral resistance on cardiac output and Pv is complex because both the cardiac and vascular function curves shift. When peripheral resistance increases (Fig. 19-11), the vascular function curve is rotated counterclockwise, but it converges on the same Pv axis intercept as the control curve does. Note that vasoconstriction causes a counterclockwise rotation of the vascular function curve in Figure 19-11 but a clockwise rotation in Figure 19-5. The direction of rotation differs because the axes for the vascular function curves were reversed in these two figures, as explained earlier. The cardiac function curve in Figure 19-11 is also shifted downward because at any given Pv, the heart is able to pump less blood against the greater cardiac afterload imposed by the increased peripheral resistance. Because both curves in Figure 19-11 are displaced downward, the new equilibrium point, B, falls below the control point, A; that is, an increase in peripheral resistance diminishes cardiac output. |
|
Whether point B falls directly below point A or lies slightly to the right or left of it depends on the magnitude of the shift in each curve. For example, if a given increase in peripheral resistance shifts the vascular function curve more than it does the cardiac function curve, equilibrium point B will fall below and to the left of A; that is, both cardiac output and Pv will diminish. Conversely, if the cardiac function curve is displaced more than the vascular function curve, point B falls below and to the right of point A; that is, cardiac output decreases, but Pv rises. |
|
|
|
Figure 19-11 An increase in peripheral resistance shifts the cardiac and vascular function curves downward. At equilibrium, cardiac output is less (B) when peripheral resistance is high than when it is normal (A). |
|
page 400 |
|
|
|
page 401 |
|
A MORE COMPLETE THEORETICAL MODEL: THE TWO-PUMP SYSTEM |
|
The preceding discussion shows that the interrelationships between cardiac output and central venous pressure are complex, even in an oversimplified circulation model that includes only one pump and just the systemic circulation. In reality, the cardiovascular system includes the systemic and pulmonary circulations and two pumps: the left and right ventricles. Thus, the interrelationships among ventricular output, arterial pressure, and atrial pressure are much more complex. |
|
Figure 19-12 shows a more complete, but still oversimplified cardiovascular system model that has two pumps in series (the left and right ventricles) and two vascular beds in series (the systemic and pulmonary vasculature). The series arrangement requires that the flow pumped by the two ventricles be virtually equal to each other over any substantial period; otherwise, all the blood would ultimately accumulate in one or the other of the vascular systems. Because the cardiac function curves for the two ventricles differ substantially, the filling (atrial) pressures for the two ventricles must differ appropriately to ensure equal stroke volumes (see Fig. 18-13). |
|
IN THE CLINIC |
|
Any change in contractility that affects the two ventricles differently alters the distribution of blood volume in the two vascular systems. If a coronary artery to the left ventricle becomes occluded, left ventricular contractility will be impaired and acute left ventricular failure will ensue. In the instant after occlusion, left atrial pressure will not change and the left ventricle will begin to pump a diminished flow. If the right ventricle is not affected by the acute coronary artery occlusion, the right ventricle will initially continue to pump the normal flow. The disparate right and left ventricular output will result in a progressive increase in left atrial pressure and a progressive decrease in right atrial pressure. Therefore, left ventricular output will increase toward the normal value and right ventricular output will fall below the normal value. This process will continue until the output of the two ventricles again becomes equal. At this new equilibrium, the output of the two ventricles will be subnormal. The elevated left atrial pressure will be accompanied by an equally elevated pulmonary venous pressure, which can have serious clinical consequences. The high pulmonary venous pressure can increase lung stiffness and lead to respiratory distress by increasing the mechanical work of pulmonary ventilation (see Chapter 22). Furthermore, the high pulmonary venous pressure will elevate the hydrostatic pressure in the pulmonary capillaries and may lead to the transudation of fluid from the pulmonary capillaries to the pulmonary interstitium or into the alveoli (pulmonary edema), which may be lethal. |
|
|
|
Two basic principles to remember about ventricular function are that (1) the left ventricle pumps blood through the systemic vasculature, and (2) the right ventricle pumps blood through the pulmonary vasculature. However, these principles do not necessarily imply that both ventricles are essential to perfuse the systemic and pulmonary vascular beds adequately. To better understand the relationships between the two ventricles and the two vascular beds, let us examine right ventricular function in more detail. |
|
In the circulatory system model shown in Figure 19-12, consider the hemodynamic consequences that would occur if the right ventricle suddenly ceased its pump function but instead served merely as a passive, low-resistance conduit between the systemic veins and the pulmonary arteries. Under these conditions, the only functional pump would be the left ventricle, which would then be required to pump blood through both the systemic and pulmonary resistances (for our purposes, consider the resistance to the flow of blood through the inactive right ventricle to be negligible). |
|
|
|
Figure 19-12 Simplified cardiovascular system model that consists of the left (LV) and right (RV) ventricles, systemic (Rs) and pulmonary (Rp) vascular resistance, systemic arterial and venous compliance, and pulmonary arterial and venous compliance. Psa and Psv are the pressures in the systemic arteries and veins, respectively; Ppa and Ppv are the pressures in the pulmonary arteries and veins, respectively. |
|
page 401 |
|
|
|
page 402 |
|
Normally, pulmonary vascular resistance is about 10% as great as systemic vascular resistance. Because the two resistances are in series with one another, total resistance would be 10% greater than systemic resistance alone (see Chapter 17). In a normal cardiovascular system, a 10% increase in systemic vascular resistance would increase mean arterial pressure (and hence left ventricular afterload) by approximately 10%. This increase would not drastically affect left ventricular function. Under certain conditions, however, this increase in mean arterial pressure could significantly alter the function of the cardiovascular system. If the 10% increase in total resistance is achieved by adding a small resistance (i.e., pulmonary vascular resistance) to that of the much larger systemic resistance and if the pulmonary vascular resistance is separated from the systemic resistance by a large compliance (the combined systemic venous and pulmonary arterial compliance), the 10% increase in total resistance could drastically impair operation of the cardiovascular system. |
|
The simulated effects of inactivating the pumping action of the right ventricle in a hydraulic analogue of the circulatory system are shown in Figure 19-13. In the model, the right and left ventricles generate cardiac outputs that vary directly with their respective filling pressures. Under control conditions (when the right ventricle is functioning normally), the output of the left and right ventricles is equal (5 L/min). The right ventricular pumping action causes the pressure in the pulmonary artery (not shown) to exceed the pressure in the pulmonary veins (Ppv) by an amount that will force fluid through the pulmonary vascular resistance at a rate of 5 L/min. |
|
|
|
Figure 19-13 Changes in cardiac output, systemic arterial pressure (Psa), systemic venous pressure (Psv), and pulmonary venous pressure (Ppv) evoked by simulated right ventricular (RV) failure and by simulated infusion of fluid in the circulatory model shown in Figure 19-12. At arrow 1, the pumping action of the right ventricle was discontinued (simulated RV failure), and the right ventricle served only as a low-resistance conduit. At arrow 2, the fluid volume in the system was expanded, and the right ventricle continued to serve only as a conduit. (Modified from Furey SA et al: Am Heart J 107:404, 1984). |
|
When the right ventricle ceases pumping (arrow 1), the systemic venous and pulmonary arterial systems, along with the right ventricle itself, become a common passive conduit with a large compliance. When the right ventricle ceases to transfer blood actively from the pulmonary veins to the pulmonary arteries, pulmonary arterial pressure (Ppa) decreases rapidly (not shown) and systemic venous pressure (Psv) rises rapidly to a common value (about 5 mm Hg). At this low pressure, however, fluid flows from the pulmonary arteries to the pulmonary veins at a greatly reduced rate. At the start of right ventricular arrest, the left ventricle is pumping fluid from the pulmonary veins to the systemic arteries at the control rate of 5 L/min, which greatly exceeds the rate at which blood returns to the pulmonary veins once the right ventricle ceases to operate. Hence, pulmonary venous pressure (Ppv) drops sharply. Because pulmonary venous pressure is the preload for the left ventricle, left ventricular (cardiac) output drops abruptly as well and attains a steady-state value of about 2.5 L/min. This effect in turn leads to a rapid reduction in systemic arterial pressure (Psa). In short, stoppage of right ventricular pumping markedly curtails cardiac output, systemic arterial pressure, and pulmonary venous pressure and raises systemic venous pressure moderately (Fig. 19-13). |
|
Most of the hemodynamic problems induced by inactivation of the right ventricle can be reversed by increasing the fluid (blood) volume of the system (arrow 2, Fig. 19-13). If fluid is added until pulmonary venous pressure (left ventricular preload) is raised to its control value, cardiac output and systemic arterial pressure are restored almost to normal, but systemic venous pressure is abnormally elevated. If left ventricular function is normal, adding a normal left ventricular preload will evoke a normal left ventricular output. The 10% increase in peripheral resistance caused by adding the pulmonary vascular resistance to that of the systemic vascular resistance does not impose a serious burden on left ventricular pumping capacity. |
|
When the right ventricle is inoperative, however, pulmonary blood flow will not be normal unless the usual pulmonary arteriovenous pressure gradient (about 10 to 15 mm Hg) prevails. Hence, systemic venous pressure (Psv) must exceed pulmonary venous pressure (Ppv) by this amount. Maintenance of high systemic venous pressure may lead to the accumulation of tissue fluid (edema) in dependent regions of the body, a characteristic finding in patients with right ventricular heart failure. |
|
With these findings in mind, one may characterize the principal function of the right ventricle as follows. From the viewpoint of providing sufficient flow of blood to all tissues in the body, the left ventricle alone can carry out this function. Operation of the two ventricles in series is not essential to provide adequate blood flow to the tissues. The crucial function of the right ventricle is to prevent the rise in systemic venous (and pulmonary arterial) pressure that would be required to force the normal cardiac output through the pulmonary vascular resistance. A normal right ventricle, by preventing an abnormal rise in systemic venous pressure, prevents the development of extensive edema in dependent regions of the body. |
|
page 402 |
|
|
|
page 403 |
|
IN THE CLINIC |
|
Clinically, right ventricular heart failure may be caused by occlusive disease predominantly of the coronary vessels to the right ventricle. These vessels are affected much less commonly than the vessels to the left ventricle. The major hemodynamic effects of acute right heart failure are pronounced reductions in cardiac output and arterial blood pressure, and the principal treatment is infusion of blood or plasma. Bypass of the right ventricle (by anastomosing the right atrium to the pulmonary artery) may be performed surgically in patients with certain congenital cardiac defects, such as severe narrowing of the tricuspid valve or maldevelopment of the right ventricle. The effects of acute right heart failure or right ventricular bypass are directionally similar to those predicted above by analysis of the model shown in Figure 19-13. |
|
|
|
ROLE OF THE HEART RATE IN CONTROL OF CARDIAC OUTPUT |
|
Cardiac output is the product of stroke volume and heart rate. Analysis of the control of cardiac output has thus far been restricted to the control of stroke volume, and the role of heart rate has not been considered. Analysis of the effect of a change in heart rate on cardiac output is complex because a change in heart rate alters the other three factors (preload, afterload, and contractility) that determine stroke volume (Fig. 19-1). An increase in heart rate, for example, shortens the duration of diastole. Hence, ventricular filling is diminished; that is, preload is reduced. If an increase in heart rate altered cardiac output, arterial pressure would change; that is, afterload would be altered. Finally, a rise in heart rate would increase the net influx of Ca++ per minute into myocardial cells (see also Chapter 16), and this influx would enhance myocardial contractility. |
|
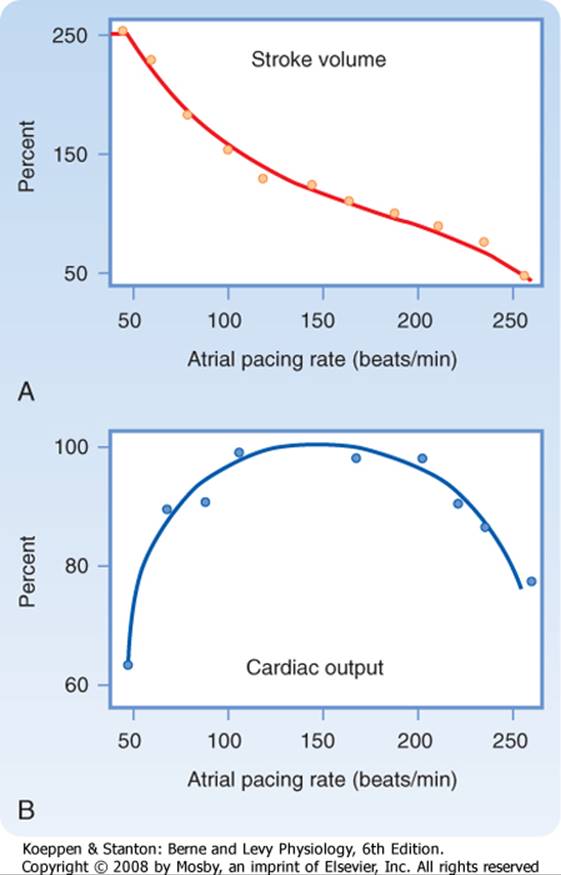
The effects of changes in heart rate on cardiac output have been studied extensively, and the results are similar to those shown in Figure 19-14. As atrial pacing frequency is gradually increased, stroke volume progressively diminishes (Fig. 19-14, A). The decrease in stroke volume is caused by the reduced time for ventricular filling. The change in stroke volume is not inversely proportional to the change in heart rate because the direction of the change in cardiac output (Qh) is markedly influenced by the actual level of the heart rate (Fig. 19-14, B). For example, as pacing frequency is increased from 50 to 100 beats/min, the increase in heart rate augments Qh. Because Qh = SV × HR, the decrease in stroke volume (SV) over this frequency range must be proportionately less than the increase in heart rate (HR). |
|
|
|
Figure 19-14 Changes in stroke volume (A) and cardiac output (B) induced by changing the rate of atrial pacing. (Redrawn from Kumada Met al: Jpn J Physiol 17:538, 1967.) |
|
Over the frequency range from about 100 to 200 beats/min, however, Qh is not affected significantly by changes in pacing frequency (Fig. 19-14, B). Hence, as pacing frequency is increased, the decrease in stroke volume must be approximately equal to the increase in heart rate. In addition, generalized vascular autoregulation tends to keep tissue blood flow constant (see also Chapter 17). This adaptation leads to changes in preload and afterload that also keep Qh nearly constant. |
|
Finally, at excessively high pacing frequencies (above 200 beats/min, Fig. 19-14), further increases in heart rate decrease Qh. Therefore, the induced decrease in stroke volume must have exceeded the increase in heart rate at this high range of pacing frequencies. At such high pacing frequencies, the ventricular filling time is so severely restricted that compensation is inadequate and cardiac output decreases sharply. Although the relationship of Qh to heart rate is characteristically that of an inverted U in the general population, the relationship varies quantitatively among subjects and among physiological states. |
|
page 403 |
|
|
|
page 404 |
|
IN THE CLINIC |
|
The characteristic relationship between cardiac output and heart rate explains the urgent need for treatment of patients who have excessively slow or excessively fast heart rates. Profound bradycardia (slow rate) may occur as a result of a very slow sinus rhythm in patients with sick sinus syndrome or as a result of a slow idioventricular rhythm in patients with complete atrioventricular block. In either rhythm disturbance, the capacity of the ventricles to fill during a prolonged diastole is limited (often by the noncompliant pericardium). Hence, cardiac output usually decreases substantially because the very slow heart rate cannot be counterbalanced by a sufficiently large stroke volume. Consequently, these bradycardias often require the installation of an artificial pacemaker. |
|
Excessively high heart rates in patients with supraventricular or ventricular tachycardias frequently require emergency treatment because these patients have cardiac output that may be critically low. In such patients, the filling time is so restricted at very high heart rates that even small additional reductions in filling time cause disproportionately severe reductions in filling volume. Slowing the tachycardia to a more normal rhythm can generally be accomplished pharmacologically, but electrical cardioversion may be required in emergencies (see Chapter 16). |
|
|
|
Strong correlations between heart rate and cardiac output must be interpreted cautiously. In exercising subjects, for example, cardiac output and heart rate usually increase proportionately, and stroke volume may remain constant or increase only slightly (see Exercise). The temptation is great to conclude that the increase in cardiac output during exercise must be caused solely by the observed increase in heart rate. However, Figure 19-14 shows that over a wide range of heart rates, a change in heart rate may have little influence on cardiac output. The principal increase in cardiac output during exercise must therefore be attributed to other factors. Such ancillary factors include the pronounced reduction in peripheral vascular resistance because of the vasodilation in the active skeletal muscles and the increased contractility of cardiac muscle associated with the generalized increase in sympathetic neural activity. Nevertheless, the increase in heart rate is still an important factor. Abundant data show that if the heart rate cannot increase normally during exercise, the augmentation in cardiac output and the capacity for exercise are severely limited. Because stroke volume changes only slightly during exercise, the increase in heart rate may play an important permissive role in augmenting cardiac output during physical exercise. |
|
ANCILLARY FACTORS THAT AFFECT THE VENOUS SYSTEM AND CARDIAC OUTPUT |
|
|
|
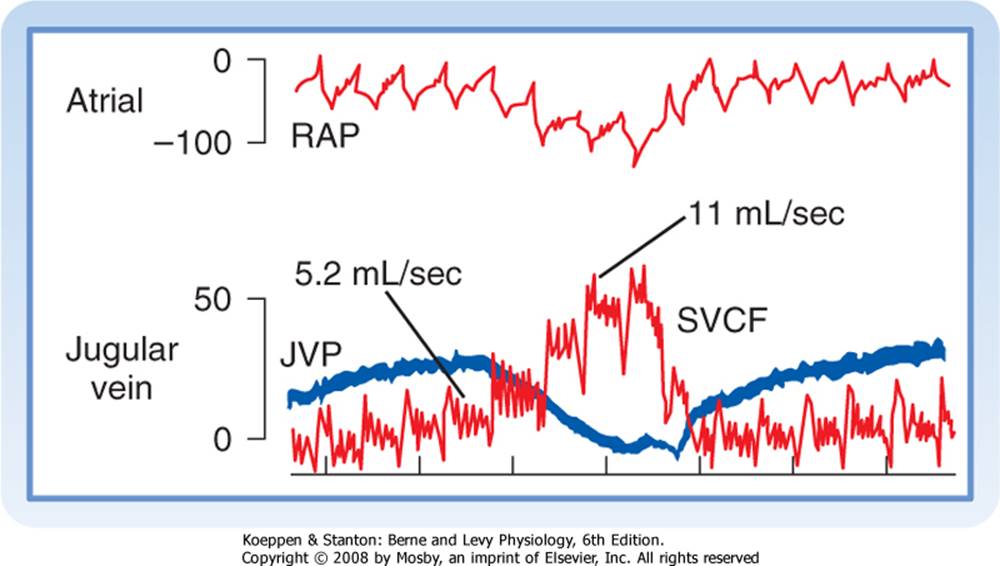
Figure 19-15 During a normal inspiration, intrathoracic, right atrial (RAP), and jugular venous (JVP) pressure decrease, and flow in the superior vena cava (SVCF) increases (from 5.2 to 11 mL/sec). All pressures are in mm H2O. Femoral arterial pressure (not shown) did not change substantially during the normal inspiration. |
|
In earlier sections of this chapter, the interrelationships between central venous pressure and cardiac output were simplified by restricting the discussion to the effects evoked by individual variables. However, because the cardiovascular system is regulated by so many feedback control loops, its responses are rarely simple. A change in blood volume, for example, not only affects cardiac output directly by the Frank-Starling mechanism but also triggers reflexes that alter other aspects of cardiac function (such as the heart rate, atrioventricular conduction, and myocardial contractility) and other characteristics of the vascular system (such as peripheral resistance and venomotor tone). Several other factors, especially gravity (see Chapter 17) and respiration, also regulate cardiac output. |
|
Circulatory Effects of Respiratory Activity |
|
The normal, periodic activity of the respiratory muscles causes rhythmic variations in vena caval flow (Fig. 19-15). During respiration, the reduction in intrathoracic pressure is transmitted to the lumens of the thoracic blood vessels. The reduction in central venous pressure during inspiration increases the pressure gradient between extrathoracic and intrathoracic veins. The consequent acceleration in venous return to the right atrium is shown in Figure 19-15 as an increase in superior vena caval blood flow from 5.2 mL/sec during expiration to 11 mL/sec during inspiration. |
|
The exaggerated reduction in intrathoracic pressure achieved by a strong inspiratory effort against a closed glottis (called Müller's maneuver) does not increase venous return proportionately. The extrathoracic veins collapse near their entry into the chest when their internal pressures fall below the ambient level. As the veins collapse, flow into the chest momentarily stops (see Chapter 17). The cessation of flow raises pressure upstream and forces the collapsed segment to open again. |
|
During normal expiration, flow into the central veins decelerates. However, the mean rate of venous return during normal respiration exceeds the flow during a brief period of apnea (cessation of respiration). Hence, normal inspiration apparently facilitates venous return more than normal expiration impedes it. In part, this facilitation of venous return is implemented by the valves in the veins of the extremities. These valves prevent any reversal of flow during expiration. Thus, the respiratory muscles and venous valves constitute an auxiliary pump for venous return. |
|
page 404 |
|
|
|
page 405 |
|
IN THE CLINIC |
|
The dramatic increase in intrathoracic pressure induced by coughing constitutes an auxiliary pumping mechanism for the blood despite its concurrent tendency to impede venous return. Because patients undergoing certain diagnostic procedures, such as coronary angiography or electrophysiological testing of cardiac function, are at increased risk for ventricular fibrillation, they are trained to cough rhythmically on command during such procedures. If ventricular fibrillation does occur, each cough can generate substantial increases in arterial blood pressure, and enough cerebral blood flow may be promoted to sustain consciousness. The cough raises intravascular pressure equally in the intrathoracic arteries and veins. Blood is propelled through the extrathoracic tissues because the increased pressure is transmitted to the extrathoracic arteries, but not to the extrathoracic veins because the venous valves prevent backflow from the intrathoracic to the extrathoracic veins. |
|
In most forms of artificial respiration (mouth-to-mouth resuscitation, mechanical respiration), lung inflation is achieved by applying endotracheal pressure above atmospheric pressure, and expiration occurs by passive recoil of the thoracic cage (see Chapter 21). Thus, lung inflation is accompanied by an appreciable rise in intrathoracic pressure. Vena caval flow decreases sharply during the phase of positive pressure lung inflation when the endotracheal pressure progressively rises. When negative endotracheal pressure is used to facilitate deflation, vena caval flow accelerates more than when the lungs are allowed to deflate passively. |
|
|
|
Sustained expiratory efforts increase intrathoracic pressure and thus impede venous return. Straining against a closed glottis (termed Valsalva's maneuver) regularly occurs during coughing, defecation, and heavy lifting. Intrathoracic pressures in excess of 100 mm Hg have been recorded in trumpet players, and pressures higher than 400 mm Hg have been observed during paroxysms of coughing. Such increases in pressure are transmitted directly to the lumens of the intrathoracic arteries. After coughing stops, arterial blood pressure may fall precipitously because of the preceding impediment to venous return. |
|
INTERPLAY OF CENTRAL AND PERIPHERAL FACTORS IN CONTROL OF THE CIRCULATION |
|
The primary function of the circulatory system is to deliver the nutrients needed for tissue metabolism and growth and to remove the products of metabolism. Previously, we examined the contributions of the components of the cardiovascular system to maintain adequate tissue perfusion under different physiological conditions. In this section, we explore the interrelationships among the various components of the circulatory system. The autonomic nervous system and the baroreceptors and chemoreceptors play key roles in regulating the cardiovascular system. Control of fluid balance by the kidneys, with maintenance of a constant blood volume, is also very important. |
|
In any well-regulated system, one way to evaluate the extent and sensitivity of its regulatory mechanisms is to disturb the system and to observe how it restores the preexisting steady state. Two such disturbances, physical exercise and hemorrhage, are used in the following sections to illustrate operation of the various regulatory factors. |
|
Exercise |
|
The cardiovascular adjustments that occur during exercise consist of a combination of neural and local (chemical) factors. Neural factors include (1) central command, (2) reflexes that originate in the contracting muscle, and (3) the baroreceptor reflex. |
|
Central command is the cerebrocortical activation of the sympathetic nervous system that produces cardiac acceleration, increased myocardial contractile force, and peripheral vasoconstriction. Reflexes are activated intramuscularly by stimulation of mechanoreceptors (by stretch, tension) and chemoreceptors (by metabolic products) in response to muscle contraction. Impulses from these receptors travel centrally via small myelinated (group III) and unmyelinated (group IV) afferent nerve fibers. Group IV unmyelinated fibers may represent the muscle chemoreceptors, as no morphological chemoreceptor has been identified. The central connections of this reflex are unknown, but the efferent limb consists of sympathetic nerve fibers to the heart and peripheral blood vessels. The baroreceptor reflex is described in Chapter 18, and local factors that influence skeletal muscle blood flow (metabolic vasodilators) are described in Chapter 17. Vascular chemoreceptors are important in regulation of the cardiovascular system during exercise. Evidence for this assertion comes from the observations that the pH, PCO2, and PO2 of arterial blood remain normal during exercise and that the vascular chemoreceptors are located on the arterial side of the circulatory system. |
|
Mild to Moderate Exercise |
|
In humans or trained animals, anticipation of physical activity inhibits vagal nerve impulses to the heart and increases sympathetic discharge. The result is an increase in heart rate and myocardial contractility. The tachycardia and enhanced contractility increase cardiac output. |
|
Peripheral Resistance |
|
When cardiac stimulation occurs, the sympathetic nervous system also changes vascular resistance in the periphery. Sympathetic-mediated vasoconstriction increases vascular resistance and thereby diverts blood away from the skin, kidneys, splanchnic regions, and inactive muscle (Fig. 19-16). This increased vascular resistance persists throughout the period of exercise. |
|
page 405 |
|
|
|
page 406 |
|
Cardiac output and blood flow to active muscles increase with progressive increases in the intensity of exercise. Blood flow to the myocardium increases, whereas flow to the brain is unchanged. Skin blood flow initially decreases during exercise, and then it increases as body temperature rises with increments in the duration and intensity of exercise. Skin blood flow finally decreases when the skin vessels constrict as total body O2 consumption nears its maximal value (Fig. 19-16). |
|
|
|
Figure 19-16 Approximate distribution of cardiac output at rest and at different levels of exercise up to the maximal O2 consumption ((VO2max) in a normal young man. (Redrawn from Ruch HP, Patton TC: Physiology and Biophysics, 12th ed. Philadelphia, Saunders, 1974.) |
|
The major circulatory adjustment to prolonged exercise occurs in the vasculature of the active muscles. Local formation of vasoactive metabolites dilates the resistance vessels markedly. This dilation progresses with increases in the intensity of exercise. Potassium is one of the vasodilator substances released by the contracting muscle, and this ion may be partly responsible for the initial decrease in vascular resistance in the active muscles. Other contributing factors may be the release of adenosine and a decrease in tissue pH during sustained exercise. The local accumulation of metabolites relaxes the terminal arterioles, and blood flow through the muscle may increase 15- to 20-fold above the resting level. This metabolic vasodilation of the precapillary vessels in active muscles occurs very soon after the onset of exercise. The decrease in TPR enables the heart to pump more blood at a lesser load, and it pumps more efficiently than if TPR were unchanged (see Chapters 17 and 18). |
|
Marked changes in the capillary circulation also occur during exercise. At rest, only a small percentage of the capillaries are perfused, whereas in actively contracting muscle, all or nearly all of the capillaries contain flowing blood (capillary recruitment). The surface area available for exchange of gases, water, and solutes is increased many times. Furthermore, hydrostatic pressure in the capillaries is increased because of relaxation of the resistance vessels. Hence, water and solutes move into the muscle tissue. Tissue pressure rises and remains elevated during exercise as fluid continues to move out of the capillaries; this tissue fluid is carried away by the lymphatics. Lymph flow is increased as a result of the rise in capillary hydrostatic pressure and the massaging effect of the contracting muscles on the valve-containing lymphatic vessels (see Chapter 17). |
|
|
|
Figure 19-17 Effect of different levels of exercise on several cardiovascular variables. (Data from Carlsten A, Grimby G: The Circulatory Response to Muscular Exercise in Man. Springfield, IL, Charles C Thomas, 1966.) |
|
page 406 |
|
|
|
page 407 |
|
Contracting muscle avidly extracts O2 from the perfusing blood and thereby increases the arteriovenous O2 difference (Fig. 19-17). This release of O2 from blood is facilitated by the shift in the oxyhemoglobin dissociation curve during exercise. During exercise, the high concentration of CO2 and the formation of lactic acid reduce tissue pH. This decrease in pH plus the increase in temperature in the contracting muscle shifts the oxyhemoglobin dissociation curve to the right (see Chapter 23). Therefore, at any given PO2, less O2 is held by the hemoglobin in the red cells, and consequently more O2 is available for the tissues. Oxygen consumption may increase as much as 60-fold, with only a 15-fold increase in muscle blood flow. Muscle myoglobin may serve as a limited O2 store during exercise, and it can release the attached O2 at very low partial pressures. However, myoglobin can also facilitate O2 transport from capillaries to mitochondria by serving as an O2 carrier. |
|
Cardiac Output |
|
Because the enhanced sympathetic drive and the reduced parasympathetic inhibition of the sinoatrial node continue during exercise, tachycardia persists. If the workload is moderate and constant, the heart rate will reach a certain level and remain there throughout the period of exercise. However, if the workload increases, the heart rate increases concomitantly until a plateau of about 180 beats/min is reached during strenuous exercise. In contrast to the large increase in heart rate, the increase in stroke volume is only about 10% to 35%, the larger values occurring in trained individuals (Fig. 19-17). In well-trained distance runners, whose cardiac output can reach six to seven times the resting level, stroke volume attains about twice the resting value. |
|
Thus, the increase in cardiac output observed during exercise is correlated principally with an increase in heart rate. If the baroreceptors are denervated, the cardiac output and heart rate responses to exercise are small in comparison to those in individuals with normally innervated baroreceptors. However, with total cardiac denervation, exercise still increases cardiac output as much as it does in normal individuals. This increase in cardiac output is achieved chiefly by means of an elevated stroke volume. However, if a β-adrenergic receptor antagonist is given to dogs with denervated hearts, exercise performance is impaired. The β-adrenergic receptor antagonist prevents the cardiac acceleration and enhanced contractility caused by increased amounts of circulating catecholamines. Therefore, the increase in cardiac output necessary for maximal exercise performance is limited. |
|
Venous Return |
|
|
|
Figure 19-18 Cardiovascular adjustments in exercise. C, vasoconstrictor activity; D, vasodilator activity; IX, glossopharyngeal nerve; VR, vasomotor region; X, vagus nerve; +, increased activity; -, decreased activity. |
|
page 407 |
|
|
|
page 408 |
|
In addition to the contribution made by sympathetically mediated constriction of the capacitance vessels in both exercising and nonexercising parts of the body, venous return is aided by the auxiliary pumping action of the working skeletal muscles and the muscles of respiration (see also Chapters 21 and 24). The intermittently contracting muscles compress the veins that course through them. Because the venous valves are oriented toward the heart, the contracting muscle pumps blood back toward the right atrium (see Chapter 17). In exercise, the flow of venous blood to the heart is also aided by the deeper and more frequent respirations that increase the pressure gradient between the abdominal and thoracic veins (intrathoracic pressure becomes more negative during exercise). |
|
In humans, blood reservoirs do not contribute much to the circulating blood volume. In fact, blood volume is usually reduced slightly during exercise, as evidenced by a rise in the hematocrit ratio. This decrease in blood volume is caused by water loss externally through sweating and enhanced ventilation and by fluid movement into the contracting muscle. However, fluid loss is counteracted in several ways. Fluid loss from the vascular compartment into the contracting muscles eventually reaches a plateau as interstitial fluid pressure rises and opposes the increased hydrostatic pressure in capillaries of the active muscle. Fluid loss is partially offset by movement of fluid from the splanchnic regions and inactive muscle into the bloodstream. This influx of fluid results from (1) a decrease in hydrostatic pressure in the capillaries of these tissues and (2) an increase in plasma osmolarity because of movement of osmotically active molecules into blood from the contracting muscle. Reduced urine formation by the kidneys also helps conserve body water. |
|
The large volume of venous blood returning to the heart is so effectively pumped through the lungs and out into the aorta that central venous pressure remains essentially constant. Thus, the Frank-Starling mechanism of a greater initial fiber length does not account for the greater stroke volume in moderate exercise. X-ray films of individuals at rest and during exercise reveal a decrease in heart size during exercise. However, during maximal or near-maximal exercise, right atrial pressure and end-diastolic ventricular volume do increase, and the Frank-Starling mechanism contributes to the enhanced stroke volume in very vigorous exercise. |
|
Arterial Pressure |
|
If the exercise involves a large proportion of the body musculature, such as in running or swimming, the reduction in total vascular resistance can be considerable. Nevertheless, arterial pressure starts to rise with the onset of exercise, and the increase in blood pressure roughly parallels the severity of the exercise performed (Fig. 19-17). Therefore, the increase in cardiac output is proportionally greater than the decrease in TPR. The vasoconstriction produced in the inactive tissues by the sympathetic nervous system (and to some extent by the release of catecholamines from the adrenal medulla) is important for maintenance of normal or increased blood pressure. Sympathectomy or drug-induced block of the adrenergic sympathetic nerve fibers decreases arterial pressure (hypotension) during exercise. |
|
Sympathetic neural activity also elicits vasoconstriction in active skeletal muscle when additional muscles are recruited. In experiments in which one leg is working at maximal levels and then the other leg starts to work, blood flow decreases in the first working leg. Furthermore, blood levels of norepinephrine rise significantly during exercise, and most of the norepinephrine is released from sympathetic nerves to the active muscles. |
|
As body temperature rises during exercise, the skin vessels dilate in response to thermal stimulation of the heat-regulating center in the hypothalamus, and TPR decreases further. This reduction in TPR would reduce blood pressure were it not for the increased cardiac output and the constriction of arterioles in the renal, splanchnic, and other tissues. |
|
In general, mean arterial pressure rises during exercise as a result of the increase in cardiac output. However, the effect of enhanced cardiac output is offset by an overall decrease in TPR, and therefore mean blood pressure increases only slightly. Vasoconstriction in the inactive vascular beds helps maintain normal arterial blood pressure for adequate perfusion of the active tissues. The actual mean arterial pressure attained during exercise thus represents a balance between cardiac output and TPR (see Chapter 17). Systolic pressure usually increases more than diastolic pressure, which results in an increase in pulse pressure (Fig. 19-17). The larger pulse pressure is primarily attributable to a greater stroke volume, but also to more rapid ejection of blood by the left ventricle and diminished peripheral runoff during the brief ventricular ejection period (see also Chapter 17). |
|
Severe Exercise |
|
During exhaustive exercise, the compensatory mechanisms begin to fail. The heart rate attains a maximal level of about 180 beats/min, and stroke volume reaches a plateau. The heart rate may then decrease and result in a fall in blood pressure. The subject also frequently becomes dehydrated. Sympathetic vasoconstrictor activity supersedes the vasodilator influence on vessels of the skin such that the rate of heat loss is decreased. Body temperature is normally elevated in exercise. A reduction in heat loss through cutaneous vasoconstriction can lead to very high body temperatures and to acute distress during severe exercise. Tissue pH and blood pH decrease as a result of increased lactic acid and CO2 production. The reduced pH may be a key factor that determines the maximal amount of exercise that a given individual can tolerate. Muscle pain, a subjective feeling of exhaustion, and loss of the will to continue determine exercise tolerance. A summary of the neural and local effects of exercise on the cardiovascular system is diagrammed in Figure 19-18. |
|
Postexercise Recovery |
|
When exercise stops, the heart rate and cardiac output quickly decrease-the sympathetic drive to the heart is essentially removed. In contrast, TPR remains low for some time after the exercise is stopped, presumably because vasodilator metabolites have accumulated in the muscles during the exercise period. As a result of the reduced cardiac output and persistence of vasodilation in the muscles, arterial pressure falls, often below preexercise levels, for brief periods. Blood pressure is then stabilized at normal levels by the baroreceptor reflexes. |
|
page 408 |
|
|
|
page 409 |
|
Limits of Exercise Performance |
|
The two main factors that limit skeletal muscle performance in humans are the rate of O2 utilization by the muscles and the O2 supply to the muscles. However, O2 use by muscle is probably not a critical factor. During exercise, maximal O2 consumption (VO2max) by a large percentage of the body's muscle mass is unchanged or increases only slightly when additional muscles are activated. In fact, during exercise of a large muscle mass, as in vigorous bicycling, the addition of bilateral arm exercise without change in the cycling effort produces only a small increase in cardiac output and VO2max. However, the additional arm exercise decreases blood flow to the legs. This centrally mediated (baroreceptor reflex) vasoconstriction during maximal cardiac output prevents the fall in blood pressure that would otherwise be caused by metabolically induced vasodilation in the active muscle. If muscle O2 use were a significant limiting factor, recruitment of more contracting muscles would entail the use of much more O2 to meet the enhanced O2 requirements. |
|
Limitation of the O2 supply could be caused by inadequate oxygenation of blood in the lungs or limitation of the supply of O2-laden blood to the muscles. Failure to oxygenate blood fully by the lungs can be excluded because even with the most strenuous exercise at sea level, arterial blood is fully saturated with O2. Therefore, O2 delivery to the active muscles (or blood flow because the arterial blood O2 content is normal) appears to be the limiting factor in muscle performance. This limitation could be caused by the inability to increase cardiac output beyond a critical level. In turn, this inability is caused by a limitation in stroke volume because the heart rate reaches maximal levels before VO2max is reached. Hence, the major factor that limits muscle performance is the pumping capacity of the heart. |
|
Physical Training and Conditioning |
|
The response of the cardiovascular system to regular exercise is to increase its capacity to deliver O2 to the active muscles and improve the ability of the muscle to use O2. VO2max varies with the level of physical conditioning. Training progressively increases VO2max, which reaches a plateau at the highest level of conditioning. Highly trained athletes have a lower resting heart rate, a greater stroke volume, and lower peripheral resistance than they had before training or after deconditioning. The low resting heart rate is caused by a higher vagal tone and a lower sympathetic tone. During exercise, the maximal heart rate of a trained individual is the same as that in an untrained person, but it is attained at a higher level of exercise. |
|
IN THE CLINIC |
|
Endurance training, such as running or swimming, increases left ventricular volume without increasing left ventricular wall thickness. In contrast, strength exercises, such as weightlifting, increase left ventricular wall thickness (hypertrophy) with little effect on ventricular volume. However, this increase in wall thickness is small relative to that observed in chronic hypertension, in which afterload is persistently elevated because of high peripheral resistance. |
|
|
|
A trained person also exhibits low vascular resistance in the muscles. If an individual exercises one leg regularly over an extended period and does not exercise the other leg, vascular resistance is lower and VO2max is higher in the "trained" leg than in the "untrained" leg. Physical conditioning is also associated with greater extraction of O2 from the blood (greater arteriovenous O2 difference) by the muscles. With long-term training, capillary density in skeletal muscle increases. Also, an increase in the number of arterioles may account for the decrease in muscle vascular resistance. The number of mitochondria increases, as do the oxidative enzymes in mitochondria. In addition, levels of ATPase activity, myoglobin, and enzymes involved in lipid metabolism increase in response to physical conditioning. |
|
Hemorrhage |
|
The cardiovascular system is the principal system affected in an individual who has lost a large quantity of blood. Arterial systolic, diastolic, and pulse pressures decrease, and the arterial pulse is rapid and feeble. The cutaneous veins collapse, and they fill slowly when compressed centrally. The skin is pale, moist, and slightly cyanotic. Respiration is rapid, but the depth of respiration may be shallow or deep. |
|
Course of Arterial Blood Pressure Changes |
|
Cardiac output decreases as a result of blood loss. The amount of blood removed when donating blood (≈10%) is well tolerated, and there is little change in mean arterial blood pressure. This is not the case when greater amounts are lost from the circulation. The changes in mean arterial pressure evoked by acute hemorrhage are illustrated in Figure 19-19. If sufficient blood is rapidly withdrawn to decrease mean arterial pressure to 50 mm Hg, the pressure then tends to rise spontaneously toward the control level over the next 20 or 30 minutes. In some individuals (curve A, Fig. 19-19), this trend continues and normal pressure is regained within a few hours. In others (curve B, Fig. 19-19), the pressure rises initially after the cessation of hemorrhage. The pressure then begins to decline, and it continues to fall at an accelerating rate until death ensues. This progressive deterioration in cardiovascular function is termed hemorrhagic shock. At some time after the hemorrhage, the deterioration in the cardiovascular system becomes irreversible. A lethal outcome can be prevented only temporarily by any known therapy, including massive transfusions of donor blood. |
|
Compensatory Mechanisms |
|
page 409 |
|
|
|
page 410 |
|
The changes in arterial pressure immediately after acute blood loss (Fig. 19-19) indicate that certain compensatory mechanisms must be operative. Any mechanism that raises arterial blood pressure toward normal in response to a reduction in pressure is designated a negative-feedback mechanism. This mechanism is termed negative because the direction of the secondary change in pressure is opposite the direction of the initiating change after the acute blood loss. The following negative-feedback responses are evoked: (1) baroreceptor reflexes, (2) chemoreceptor reflexes, (3) cerebral ischemia responses, (4) reabsorption of tissue fluids, (5) release of endogenous vasoconstrictor substances, and (6) renal conservation of salt and water. |
|
Baroreceptor Reflexes |
|
|
|
Figure 19-19 Changes in mean arterial pressure after rapid hemorrhage. At time zero, blood is rapidly removed, thereby reducing the mean arterial pressure to 50 mm Hg. After a period in which the pressure returns toward the control level, some individuals continue to improve until the control pressure is attained (curve A). However, in other individuals, the pressure will begin to decline until death ensues (curve B). |
|
The reductions in mean arterial pressure and pulse pressure during hemorrhage decrease stimulation of the baroreceptors in the carotid sinuses and aortic arch (see Chapter 18). Several cardiovascular responses are thus evoked, all of which tend to restore the normal level of arterial pressure. Such responses include reduction of vagal tone and enhancement of sympathetic tone, increased heart rate, and enhanced myocardial contractility. |
|
The increased sympathetic tone also produces generalized venoconstriction, which has the same hemodynamic consequences as transfusion of blood (Fig. 19-9). Sympathetic activation constricts certain blood reservoirs. This vasoconstriction acts as an autotransfusion of blood into the circulation. In humans, the cutaneous, pulmonary, and hepatic branches of the vasculature constitute the principal blood reservoirs. |
|
Generalized arteriolar constriction is a prominent response to the reduced baroreceptor stimulation during hemorrhage. The reflex increase in peripheral resistance minimizes the fall in arterial pressure caused by the reduction in cardiac output. Figure 19-20 shows the effect of an 8% blood loss on mean aortic pressure. When both vagi were cut to eliminate the influence of the aortic arch baroreceptors and only the carotid sinus baroreceptors were operative (Fig. 19-20, A), this hemorrhage decreased mean aortic pressure by 14%. This pressure change did not differ significantly from the decline in pressure (12%) evoked by the same hemorrhage before vagotomy (not shown). When the carotid sinuses were denervated and the aortic baroreceptor reflexes were intact, the 8% blood loss decreased mean aortic pressure by 38% (see Fig. 19-20, B). Hence, the carotid sinus baroreceptors were more effective than the aortic baroreceptors in attenuating the fall in pressure. The aortic baroreceptor reflex must also have been operative, however, because when both sets of afferent baroreceptor pathways were interrupted (see Fig. 19-20, C), an 8% blood loss reduced arterial pressure by 48%. |
|
Arteriolar constriction is widespread during hemorrhage but it is by no means uniform. Vasoconstriction is most pronounced in the cutaneous, skeletal muscle, and splanchnic vascular beds, and it is slight or absent in the cerebral and coronary circulations in response to hemorrhage. In many instances, cerebral and coronary vascular resistance is diminished. The reduced cardiac output is redistributed to favor flow through the brain and the heart. |
|
|
|
Figure 19-20 Changes in mean aortic pressure in response to an 8% blood loss in three groups of individuals. A, The carotid sinus baroreceptors were intact and the aortic reflexes were interrupted. B, The aortic reflexes were intact and the carotid sinus reflexes were interrupted. C, All sinoaortic reflexes were abrogated. (Data from Shepherd JT: Circulation 50:418, 1974; derived from the data of Edis AJ: Am J Physiol 221:1352, 1971.) |
|
page 410 |
|
|
|
page 411 |
|
In the early stages of mild to moderate hemorrhage, renal resistance changes only slightly. The tendency for increased sympathetic activity to constrict the renal vessels is counteracted by autoregulatory mechanisms (see Chapters 18 and 32). With more prolonged and severe hemorrhage, however, renal vasoconstriction becomes intense. |
|
The severe renal and splanchnic vasoconstriction during hemorrhage favors the heart and brain. However, if such constriction persists too long, it may be detrimental. Frequently, patients survive the acute hypotensive period of a prolonged, severe hemorrhage, only to die several days later from the kidney failure that results from renal ischemia. Intestinal ischemia may also have dire effects. For example, intestinal bleeding and extensive sloughing of the mucosa can occur after only a few hours of hemorrhagic hypotension. Furthermore, the diminished splanchnic flow swells the centrilobular cells in the liver (i.e., those cells closest to the central vein). The resulting obstruction of the hepatic sinusoids raises portal venous pressure, and this response intensifies intestinal blood loss. |
|
Chemoreceptor Reflexes |
|
Reductions in arterial pressure below about 60 mm Hg do not evoke any additional responses through the baroreceptor reflexes because this pressure level constitutes the threshold for stimulation (see Chapter 18). However, low arterial pressure may stimulate peripheral chemoreceptors because inadequate local blood flow leads to hypoxia in the chemoreceptor tissue. Chemoreceptor excitation may then enhance the already existent peripheral vasoconstriction evoked by the baroreceptor reflexes. In addition, respiratory stimulation assists venous return by the auxiliary pumping mechanism described earlier (see also Chapter 24). |
|
Cerebral Ischemia |
|
When arterial pressure falls below about 40 mm Hg as a consequence of blood loss, the resulting cerebral ischemia activates the sympathoadrenal system. The sympathetic nervous discharge is several times greater than the maximal neural activity that occurs when the baroreceptors cease to be stimulated. The vasoconstriction and increase in myocardial contractility may be pronounced. With more severe degrees of cerebral ischemia, however, the vagal centers also become activated. The resulting bradycardia aggravates the hypotension that initiated the cerebral ischemia |
|
Reabsorption of Tissue Fluids |
|
|
|
Figure 19-21 Changes in arterial blood pressure and plasma colloid osmotic pressure in response to withdrawal of 45% of the estimated blood volume over a 30-minute period, beginning at time zero. (Redrawn from Zweifach BW: Anesthesiology 41:157, 1974.) |
|
The arterial hypotension, arteriolar constriction, and reduced venous pressure during hemorrhagic hypotension lower hydrostatic pressure in the capillaries. The balance of these forces promotes the net reabsorption of interstitial fluid into the vascular compartment (see Chapter 17). The rapidity of this response is displayed in Figure 19-21. When 45% of the estimated blood volume was removed over a 30-minute period, mean arterial blood pressure declined rapidly and then was largely restored to near the control level. Plasma colloid osmotic pressure declined markedly during the bleeding and continued to decrease more gradually for several hours. The reduction in colloid osmotic pressure reflects dilution of the blood by tissue fluids that contain little protein. |
|
Considerable quantities of fluid may thus be drawn into the circulation during hemorrhage. About 0.25 mL of fluid per minute per kilogram of body weight may be reabsorbed by the capillaries. Thus, approximately 1 L of fluid per hour might be autoinfused from the interstitial spaces into the circulatory system of an average individual after acute blood loss. |
|
Substantial quantities of fluid may shift slowly from the intracellular to the extracellular space. This fluid exchange is probably mediated by secretion of cortisol from the adrenal cortex in response to hemorrhage. Cortisol appears to be essential for the full restoration of plasma volume after hemorrhage. |
|
Endogenous Vasoconstrictors |
|
The catecholamines epinephrine and norepinephrine are released from the adrenal medulla in response to the same stimuli that evoke widespread sympathetic nervous discharge (see Chapter 42). Blood levels of catecholamines are high during and after hemorrhage. When blood loss is such that arterial pressure is reduced to 40 mm Hg, the level of catecholamines increases as much as 50-fold. Epinephrine comes almost exclusively from the adrenal medulla, whereas norepinephrine is derived from both the adrenal medulla and peripheral sympathetic nerve endings. These humoral substances reinforce the effects of the sympathetic nervous activity listed previously. |
|
page 411 |
|
|
|
page 412 |
|
|
|
Figure 19-22 Mean percent changes in arterial blood pressure and plasma vasopressin concentration in response to blood loss. (Redrawn from Shen YT et al: Circ Res 68:1422, 1991.) |
|
Vasopressin (antidiuretic hormone), a potent vasoconstrictor, is secreted by the posterior pituitary gland in response to hemorrhage (see Chapters 34 and 40). The plasma concentration of vasopressin rises progressively as arterial blood pressure diminishes (Fig. 19-22). The receptors responsible for the augmented release of vasopressin are the aortic arch and carotid sinus baroreceptors (high pressure) and stretch receptors in the left atrium (low pressure). |
|
The diminished renal perfusion during hemorrhagic hypotension leads to the secretion of renin from the juxtaglomerular apparatus (see Chapter 34). This enzyme acts on a plasma protein, angiotensinogen, to form the decapeptide angiotensin I, which in turn is cleaved to the active octapeptide angiotensin II by angiotensin-converting enzyme (ACE); angiotensin II is a very powerful vasoconstrictor. |
|
Renal Conservation of Salt and Water |
|
Fluid and electrolytes are conserved by the kidneys during hemorrhage in response to various stimuli, including the increased secretion of vasopressin noted previously (Fig. 19-22) and increased renal sympathetic nerve activity, which enhances NaCl reabsorption by the nephron (decreased excretion). The lower arterial pressure decreases the glomerular filtration rate, which also curtails the excretion of water and electrolytes. In addition, the elevated levels of angiotensin II, as described earlier, stimulate the release of aldosterone from the adrenal cortex. Aldosterone, in turn, stimulates reabsorption of NaCl by the nephrons. Thus, NaCl and water excretion is decreased (see also Chapter 34). |
|
Decompensatory Mechanisms |
|
In contrast to negative-feedback mechanisms, hemorrhage also evokes latent positive-feedback mechanisms. These mechanisms exaggerate any primary change initiated by the blood loss. Specifically, positive-feedback mechanisms aggravate the hypotension induced by blood loss and tend to initiate "vicious" cycles, which may lead to death. |
|
|
|
Figure 19-23 Ventricular function curve for the left ventricle during the course of hemorrhagic shock. Curve A represents the control function curve; curve B, 117 minutes; curve C, 247 minutes; curve D, 280 minutes; curve E, 295 minutes; and curve F, 310 minutes after the initial hemorrhage. (Redrawn from Crowell JW, Guyton AC: Am J Physiol 203:248, 1962.) |
|
Whether a positive-feedback mechanism will lead to a vicious cycle depends on the gain of that mechanism. Gain is the ratio of the secondary change evoked by a given mechanism to the initiating change itself. A gain greater than 1 induces a vicious cycle; a gain less than 1 does not. Consider a positive-feedback mechanism with a gain of 2. If mean arterial pressure were to decrease by 10 mm Hg, a positive-feedback mechanism with a gain of 2 would then evoke a secondary reduction in pressure of 20 mm Hg, which in turn would cause a further decrease of 40 mm Hg. Thus, each change would induce a subsequent one that is twice as great. Hence, mean arterial pressure would decline at an ever-increasing rate until death occurred. This process is depicted in curve B in Figure 19-19. |
|
Conversely, a positive-feedback mechanism with a gain of 0.5 also exaggerates any change in mean arterial pressure, but the change would not necessarily lead to death. If arterial pressure suddenly decreased by 10 mm Hg, a positive-feedback mechanism would initiate a secondary, additional fall of 5 mm Hg. This decrease, in turn, would provoke a further decrease of 2.5 mm Hg. The process would continue in ever-diminishing steps until arterial pressure approached an equilibrium value. |
|
Some of the more important positive-feedback mechanisms that are evident during hemorrhage include (1) cardiac failure, (2) acidosis, (3) central nervous system depression, (4) aberrations in blood clotting, and (5) depression of the mononuclear phagocytic system (MPS).* |
|
Cardiac Failure |
|
page 412 |
|
|
|
page 413 |
|
The role of cardiac failure in the progression of shock during hemorrhage is controversial. All investigators agree that the heart fails terminally, but opinions differ about the importance of cardiac failure during earlier stages of hemorrhagic hypotension. Shifts to the right in ventricular function curves (Fig. 19-23) provide evidence of a progressive depression in myocardial contractility during hemorrhage. |
|
The hypotension induced by hemorrhage reduces coronary blood flow and therefore depresses ventricular function. The consequent reduction in cardiac output further reduces arterial pressure, a classic example of a positive-feedback mechanism. Furthermore, reduced blood flow to peripheral tissues leads to an accumulation of vasodilator metabolites that decrease peripheral resistance and therefore aggravate the fall in arterial pressure. |
|
Acidosis |
|
The inadequate blood flow during hemorrhage affects the metabolism of all cells. The decreased O2 delivery to cells accelerates tissue production of lactic acid and other acid metabolites. Moreover, impaired kidney function prevents adequate excretion of the excess H+, and generalized metabolic acidosis ensues. The resulting depressant effect of acidosis on the heart further reduces tissue perfusion and thus aggravates the metabolic acidosis. Acidosis also reduces the reactivity of the heart and resistance vessels to neurally released and circulating catecholamines and thereby intensifies the hypotension. |
|
Central Nervous System Depression |
|
The hypotension in shock reduces cerebral blood flow. Moderate degrees of cerebral ischemia induce pronounced sympathetic nervous stimulation of the heart, arterioles, and veins, as noted earlier. In severe hypotension, however, the cardiovascular centers in the brainstem eventually become depressed because of inadequate cerebral blood flow. The resulting loss of sympathetic tone then reduces cardiac output and peripheral resistance. The consequent reduction in mean arterial pressure intensifies the inadequate cerebral perfusion. |
|
Endogenous opioids, such as enkephalins and β-endorphin, may be released into the brain substance and into the circulation in response to the same stresses that provoke circulatory shock. Opioids are stored, along with catecholamines, in secretory granules in the adrenal medulla and in sympathetic nerve terminals, and they are released together in response to stress. Similar stimuli release β-endorphin and adrenocorticotropic hormone from the anterior pituitary gland. Opioids depress the brainstem centers that mediate some of the compensatory autonomic adaptations to blood loss, endotoxemia, and other shock-provoking stress. Conversely, the opioid antagonist naloxone improves cardiovascular function and survival in various forms of shock. |
|
Aberrations in Blood Clotting |
|
The alterations in blood clotting after hemorrhage are typically biphasic. An initial phase of hypercoagulability is followed by a secondary phase of hypocoagulability and fibrinolysis. In the initial phase, platelets and leukocytes adhere to the vascular endothelium, and intravascular clots, or thrombi, develop within a few minutes of the onset of severe hemorrhage. Coagulation may be extensive throughout the small blood vessels. |
|
The initial phase is further enhanced by the release of thromboxane A2 from various ischemic tissues. Thromboxane A2 aggregates platelets. As more platelets aggregate, more thromboxane A2 is released and more platelets are trapped. This form of positive feedback intensifies and prolongs the clotting tendency. The mortality from certain standard shock-provoking procedures has been reduced considerably by the administration of anticoagulants such as heparin. |
|
Mononuclear Phagocytic System |
|
During the course of hemorrhagic hypotension, MPS function becomes depressed. The phagocytic activity of the MPS is modulated by an opsonic protein. The opsonic activity in plasma diminishes during shock, and this change may account in part for the depression in MPS function. As a result, antibacterial and antitoxin defense mechanisms are impaired. Endotoxins from the normal bacterial flora of the intestine constantly enter the circulation. Ordinarily, they are inactivated by the MPS, principally in the liver. When the MPS is depressed, these endotoxins invade the general circulation. Endotoxins produce profound, generalized vasodilation, mainly by inducing the synthesis of an isoform of nitric oxide synthase in the smooth muscle of blood vessels throughout the body. The profound vasodilation aggravates the hemodynamic changes caused by blood loss. |
|
In addition to their role in inactivating endotoxin, macrophages release many of the mediators associated with shock. These mediators include acid hydrolases, neutral proteases, oxygen free radicals, certain coagulation factors, and the following arachidonic acid derivatives: prostaglandins, thromboxanes, and leukotrienes. Macrophages also release certain monokines that modulate temperature regulation, intermediary metabolism, hormone secretion, and the immune system. |
|
Interactions of Positive- and Negative-Feedback Mechanisms |
|
Hemorrhage provokes a multitude of circulatory and metabolic derangements. Some of these changes are compensatory and others are decompensatory. Some of these feedback mechanisms possess high gain and others possess low gain. Furthermore, the gain of any specific mechanism varies with the severity of the hemorrhage. For example, with only a slight loss of blood, mean arterial pressure is maintained within the normal range and the gain of the baroreceptor reflexes is high. With greater losses of blood, when mean arterial pressure is below 60 mm Hg (i.e., below the threshold for the baroreceptors), further reductions in pressure have no additional influence through the baroreceptor reflexes. Hence, below this critical pressure, the baroreceptor reflex gain is zero or near zero. |
|
page 413 |
|
|
|
page 414 |
|
Generally, with minor degrees of blood loss, the gains of negative-feedback mechanisms are high, whereas those of positive-feedback mechanisms are low. The opposite is true with more severe hemorrhage. The gains of the various mechanisms add algebraically. Therefore, whether a vicious cycle develops depends on whether the sum of the positive and negative gains exceeds 1. Total gains in excess of 1 are of course more likely with severe losses of blood. Therefore, to avert a vicious cycle, serious hemorrhages must be treated quickly and intensively, preferably by whole blood transfusion, before the process becomes irreversible. |
|
KEY CONCEPTS |
|
1. Two important relationships between cardiac output (Qh) and central venous pressure (Pv) prevail in the cardiovascular system. With respect to the heart, Qhvaries directly with Pv (or preload) over a very wide range of Pv. This relationship is represented by the cardiac function curve, and it expresses the Frank-Starling mechanism. In the vascular system, Pv varies inversely with Qh. This relationship is represented by the vascular function curve, and it reflects the fact that as Qh increases, a greater fraction of the total blood volume resides in the arteries and a smaller volume resides in the veins. 2. The principal cardiac mechanisms that govern cardiac output are the changes in numbers of myocardial cross-bridges that interact and in the affinity of the contractile proteins for Ca++. The principal factors that govern the vascular function curve are arterial and venous compliance, peripheral vascular resistance, and total blood volume. 3. The equilibrium values of Qh and Pv that prevail under a given set of conditions are determined by the intersection of the cardiac and vascular function curves. At very low and very high heart rates, the heart is unable to pump an adequate Qh. At very low heart rates, the increase in filling during diastole cannot compensate for the small number of cardiac contractions per minute. At very high heart rates, the large number of contractions per minute cannot compensate for the inadequate filling time. 4. Gravity influences Qh because the veins are so compliant, and substantial quantities of blood tend to pool in the veins of dependent portions of the body. Respiration changes the pressure gradient between the intrathoracic and extrathoracic veins. Hence, respiration serves as an auxiliary pump, which may affect the mean level of Qh and induce rhythmic changes in stroke volume during the various phases of the respiratory cycle. 5. In anticipation of exercise, vagus nerve impulses to the heart are inhibited and the sympathetic nervous system is activated by central command. The result is an increase in heart rate, myocardial contractile force, and regional vascular resistance. In addition, vascular resistance increases in the skin, kidneys, splanchnic regions, and inactive muscles and decreases markedly in the active muscles. The overall effect is a pronounced reduction in total peripheral resistance, which along with the auxiliary pumping action of the contracting skeletal muscles, greatly increases venous return. The increase in heart rate and myocardial contractility, both induced by the activation of cardiac sympathetic nerves, enables the heart to transfer blood to the pulmonary and systemic circulations, thereby increasing cardiac output. Stroke volume increases only slightly. O2 consumption and blood O2 extraction increase, and systolic pressure and mean blood pressure increase slightly. As body temperature rises during exercise, the skin blood vessels dilate. However, when the heart rate becomes maximal during severe exercise, the skin vessels constrict. This increases the effective blood volume but causes greater increases in body temperature and a feeling of exhaustion. The limiting factor in exercise performance is delivery of blood to the active muscles. 6. Acute blood loss induces tachycardia, hypotension, generalized arteriolar constriction, and generalized venoconstriction. Acute blood loss invokes a number of negative-feedback (compensatory) mechanisms, such as baroreceptor and chemoreceptor reflexes, responses to moderate cerebral ischemia, reabsorption of tissue fluids, release of endogenous vasoconstrictors, and renal conservation of water and electrolytes. Acute blood loss also invokes a number of positive-feedback (decompensatory) mechanisms, such as cardiac failure, acidosis, central nervous system depression, aberrations in blood coagulation, and depression of the mononuclear phagocytic system. The outcome of acute blood loss depends on the sum of gains of the positive- and negative-feedback mechanisms and on the interactions between these mechanisms. |