OBJECTIVES
After reading this chapter, you should be able to:>
![]() Outline the processes involved in the secretion of H+ into the tubules and discuss the significance of these processes in the regulation of acid–base balance.
Outline the processes involved in the secretion of H+ into the tubules and discuss the significance of these processes in the regulation of acid–base balance.
![]() Define acidosis and alkalosis, and give (in mEq/L and pH) the normal mean and the range of H+ concentrations in blood that are compatible with health.
Define acidosis and alkalosis, and give (in mEq/L and pH) the normal mean and the range of H+ concentrations in blood that are compatible with health.
![]() List the principal buffers in blood, interstitial fluid, and intracellular fluid, and, using the Henderson–Hasselbalch equation, describe what is unique about the bicarbonate buffer system.
List the principal buffers in blood, interstitial fluid, and intracellular fluid, and, using the Henderson–Hasselbalch equation, describe what is unique about the bicarbonate buffer system.
![]() Describe the changes in blood chemistry that occur during the development of metabolic acidosis and metabolic alkalosis, and the respiratory and renal compensations for these conditions.
Describe the changes in blood chemistry that occur during the development of metabolic acidosis and metabolic alkalosis, and the respiratory and renal compensations for these conditions.
![]() Describe the changes in blood chemistry that occur during the development of respiratory acidosis and respiratory alkalosis, and the renal compensation for these conditions.
Describe the changes in blood chemistry that occur during the development of respiratory acidosis and respiratory alkalosis, and the renal compensation for these conditions.
INTRODUCTION
The kidneys play a key role in the maintenance of acid–base balance and to do this they must excrete acid in the amount equivalent to the production of nonvolatile acids in the body. The production of nonvolatile acids will vary with diet, metabolism, and disease. The kidneys must also filter and reabsorb plasma bicarbonate, and thus prevent the loss of bicarbonate in the urine. Both processes are linked physiologically, due to the nephron’s ability to secrete H+ions into the filtrate.
RENAL H+ SECRETION
The cells of the proximal and distal tubules, like the cells of the gastric glands (see Chapter 25), secrete hydrogen ions. Hydrogen secretion also occurs in the collecting ducts. The transporter that is responsible for H+ secretion in the proximal tubules is the Na–H exchanger (primarily NHE3) (Figure 39–1). This is an example of secondary active transport; Na+ is moved from the inside of the cell to the interstitium by Na, K ATPase on the basolateral membrane, which keeps intracellular Na+ low, thus establishing the drive for Na+ to enter the cell, via the Na–H exchanger, from the tubular lumen. The Na–H exchanger secretes H+ into the lumen in exchange for Na+.

FIGURE 39–1 Secretion of acid by proximal tubular cells in the kidney. H+ is transported into the tubular lumen by an antiport in exchange for Na+. Active transport by Na, K ATPase is indicated by arrows in the circle. Dashed arrows indicate diffusion.
The secreted H+ ion combines with filtered ![]() to form H2CO3 and the presence of carbonic anhydrase on the apical membrane of the proximal tubule catalyzes the formation of H2O and CO2 from H2CO3. The apical membrane of epithelial cells lining the proximal tubule is permeable to CO2 and H2O, and they enter the tubule rapidly. 80% of the filtered load of
to form H2CO3 and the presence of carbonic anhydrase on the apical membrane of the proximal tubule catalyzes the formation of H2O and CO2 from H2CO3. The apical membrane of epithelial cells lining the proximal tubule is permeable to CO2 and H2O, and they enter the tubule rapidly. 80% of the filtered load of ![]() is reabsorbed in the proximal tubule.
is reabsorbed in the proximal tubule.
Inside the cell, carbonic anhydrase is also present and can catalyze the formation of H2CO3 from CO2 and H2O. H2CO3 dissociates into H+ ions and ![]() ; the H+ is secreted into the tubular lumen, as mentioned above, and the
; the H+ is secreted into the tubular lumen, as mentioned above, and the ![]() that is formed diffuses into the interstitial fluid. Thus, for each H+ ion secreted, one Na+ ion and one
that is formed diffuses into the interstitial fluid. Thus, for each H+ ion secreted, one Na+ ion and one ![]() ion enter the interstitial fluid. Because carbonic anhydrase catalyzes the formation of H2CO3, drugs that inhibit carbonic anhydrase depress both secretion of acid by the proximal tubules and the reactions that depend on it.
ion enter the interstitial fluid. Because carbonic anhydrase catalyzes the formation of H2CO3, drugs that inhibit carbonic anhydrase depress both secretion of acid by the proximal tubules and the reactions that depend on it.
Some evidence suggests that H+ is secreted in the proximal tubules by other types of transporters, but the evidence for these additional transporters is controversial, and in any case, their contribution is small relative to that of the Na–H exchange mechanism.
This is in contrast to what occurs in the distal tubules and collecting ducts, where H+ secretion is relatively independent of Na+ in the tubular lumen. In this part of the tubule, most H+ is secreted by an ATP-driven proton pump. Aldosterone acts on this pump to increase distal H+ secretion. The I cells in this part of the renal tubule secrete acid and, like the parietal cells in the stomach, contain abundant carbonic anhydrase and numerous tubulovesicular structures. There is evidence that the H+-translocating ATPase that produces H+ secretion is located in these vesicles as well as in the apical cell membrane and that, in acidosis, the number of H+ pumps is increased by insertion of these tubulovesicles into the apical cell membrane. Some of the H+ is additionally secreted by H–K+ ATPase. The I cells also contain anion exchanger 1 (AE1, formerly known as Band 3), an anion exchange protein, in their basolateral cell membranes. This protein may function as a Cl/HCO3 exchanger for the transport of ![]() to the interstitial fluid.
to the interstitial fluid.
FATE OF H+ IN THE URINE
The amount of acid secreted depends upon the subsequent events that modify the composition of the tubular urine. The maximal H+ gradient against which the transport mechanisms can secrete in humans corresponds to a urine pH of about 4.5; that is, an H+ concentration in the urine that is 1000 times the concentration in plasma. pH 4.5 is thus the limiting pH. This is normally reached in the collecting ducts. If there were no buffers that “tied up” H+ in the urine, this pH would be reached rapidly, and H+ secretion would stop. However, three important reactions in the tubular fluid remove free H+, permitting more acid to be secreted (Figure 39–2). These are the reactions of H+ with ![]() to form CO2 and H2O (discussed above), with
to form CO2 and H2O (discussed above), with ![]() to form
to form ![]() (titratable acids), and with NH3 to form NH4+.
(titratable acids), and with NH3 to form NH4+.

FIGURE 39–2 Fate of H+ secreted into a tubule in exchange for Na+. Top: Reabsorption of filtered bicarbonate via CO2. Middle: Formation of monobasic phosphate. Bottom: Ammonium formation. Note that in each instance one Na+ ion and one ![]() ion enter the bloodstream for each H+ ion secreted. A–, anion.
ion enter the bloodstream for each H+ ion secreted. A–, anion.
REACTION WITH BUFFERS
The three buffers of importance in the renal handling of acid and its secretion into the lumen are thus bicarbonate, dibasic phosphate, and ammonia. On an average diet, approximately 40% of nonvolatile acids (about 30 mEq/day), produced by the body in the course of various metabolic reactions is excreted as titratable acid (ie, phosphate system) and 60% of nonvolatile acid (about 50 mEq/day) is excreted as NH4+. The pK’ of the bicarbonate system is 6.1, that of the dibasic phosphate system is 6.8, and that of the ammonia system is 9.0. The concentration of ![]() in the plasma, and consequently in the glomerular filtrate, is normally about 24 mEq/L, whereas that of phosphate is only 1.5 mEq/L. Therefore, in the proximal tubule, most of the secreted H+ reacts with
in the plasma, and consequently in the glomerular filtrate, is normally about 24 mEq/L, whereas that of phosphate is only 1.5 mEq/L. Therefore, in the proximal tubule, most of the secreted H+ reacts with ![]() as described above, to form H2CO3 (Figure 39–2) and this enters the cell as CO2 and H2O following the action of carbonic anhydrase in the brush border of the proximal tubule cells. The CO2 entering the tubular cells adds to the pool of CO2 available to form H2CO3. Because most of the H+ is removed from the tubule, the pH of the fluid is changed very little. This is the mechanism by which
as described above, to form H2CO3 (Figure 39–2) and this enters the cell as CO2 and H2O following the action of carbonic anhydrase in the brush border of the proximal tubule cells. The CO2 entering the tubular cells adds to the pool of CO2 available to form H2CO3. Because most of the H+ is removed from the tubule, the pH of the fluid is changed very little. This is the mechanism by which ![]() is reabsorbed; for each mole of
is reabsorbed; for each mole of ![]() removed from the tubular fluid, 1 mol of
removed from the tubular fluid, 1 mol of ![]() diffuses from the tubular cells into the blood, although it is important to note that it is not the same mole that disappeared from the tubular fluid. About 4500 mEq of
diffuses from the tubular cells into the blood, although it is important to note that it is not the same mole that disappeared from the tubular fluid. About 4500 mEq of ![]() are filtered and reabsorbed each day.
are filtered and reabsorbed each day.
Secreted H+ also reacts with dibasic phosphate (![]() ) to form monobasic phosphate (
) to form monobasic phosphate (![]() ). This happens to the greatest extent in the distal tubules and collecting ducts, because it is here that the phosphate that escapes proximal reabsorption is greatly concentrated by the reabsorption of water. H+ ions are also known to combine to a minor degree with other buffer anions.
). This happens to the greatest extent in the distal tubules and collecting ducts, because it is here that the phosphate that escapes proximal reabsorption is greatly concentrated by the reabsorption of water. H+ ions are also known to combine to a minor degree with other buffer anions.
The ammonia buffering system allows secreted H+ to combine with NH3, and this occurs in the proximal tubule (where NH3 is made, see below) and in the distal tubules. The pK′ of the ammonia system is 9.0, and the ammonia system is titrated only from the pH of the urine to pH 7.4, so it contributes very little to the titratable acidity. Each H+ ion that reacts with the buffers contributes to the urinary titratable acidity, which is measured by determining the amount of alkali that must be added to the urine to return its pH to 7.4, the pH of the glomerular filtrate. However, the titratable acidity obviously measures only a fraction of the acid secreted, since it does not account for the H2CO3that has been converted to H2O and CO2.
The reabsorption of ![]() is crucial to the maintenance of acid–base balance, as a loss of a single
is crucial to the maintenance of acid–base balance, as a loss of a single ![]() ion in the urine would be the equivalent of adding a H+ ion to the blood. However, the kidneys have the ability to replenish the body with new bicarbonate ions. This occurs when H+ ions are removed from the body as NH4+ or titratable acid, as there is formation of new bicarbonate within the cells, and this enters the blood (ie, these bicarbonate ions are not those originally filtered, and yet they still enter the blood).
ion in the urine would be the equivalent of adding a H+ ion to the blood. However, the kidneys have the ability to replenish the body with new bicarbonate ions. This occurs when H+ ions are removed from the body as NH4+ or titratable acid, as there is formation of new bicarbonate within the cells, and this enters the blood (ie, these bicarbonate ions are not those originally filtered, and yet they still enter the blood).
AMMONIA SECRETION
As mentioned above, reactions in the renal tubular cells produce NH4+ and ![]() . NH4+ is in equilibrium with NH3 and H+ in the cells. Because the pK’ of this reaction is 9.0, the ratio of NH3 to NH4+ at pH 7.0 is 1:100 (Figure 39–3). However, NH3 is lipid-soluble and diffuses across the cell membranes down its concentration gradient into the interstitial fluid and tubular urine. In the urine it reacts with H+ to form NH4+, and the NH4+ remains “trapped” in the urine.
. NH4+ is in equilibrium with NH3 and H+ in the cells. Because the pK’ of this reaction is 9.0, the ratio of NH3 to NH4+ at pH 7.0 is 1:100 (Figure 39–3). However, NH3 is lipid-soluble and diffuses across the cell membranes down its concentration gradient into the interstitial fluid and tubular urine. In the urine it reacts with H+ to form NH4+, and the NH4+ remains “trapped” in the urine.

FIGURE 39–3 Major reactions involved in ammonia production in the kidneys.
The principal reaction producing NH4+ in cells is conversion of glutamine to glutamate. This reaction is catalyzed by the enzyme glutaminase, which is abundant in renal tubular cells (Figure 39–3). Glutamic dehydrogenasecatalyzes the conversion of glutamate to α-ketoglutarate, with the production of more NH4+. Subsequent metabolism of α-ketoglutarate utilizes 2H+, freeing 2![]() .
.
In chronic acidosis, the amount of NH4+ excreted at any given urine pH also increases, because more NH3 enters the tubular urine. The effect of this adaptation of NH3 secretion, the cause of which is unsettled, is further removal of H+ from the tubular fluid and consequently a further enhancement of H+ secretion by the renal tubules and excretion in the urine. Because the amount of phosphate buffer filtered at the glomerulus cannot be increased, urinary excretion of acid via the phosphate buffer system is limited. The production of NH4+ by the renal tubules is the only way the kidneys can remove even the normal amount, much less an increased amount, of nonvolatile acid produced in the body.
In the inner medullary cells of the collecting duct, the main process by which NH3 is secreted into the urine and then changed to NH4+, is called nonionic diffusion (see Chapter 2), thereby maintaining the concentration gradient for diffusion of NH3. In the proximal tubule, nonionic diffusion of NH4+ is less important as NH4+ can be secreted into the lumen, often by replacing H+ on the Na–H exchanger.
Salicylates and a number of other drugs that are weak bases or weak acids are also secreted by nonionic diffusion. They diffuse into the tubular fluid at a rate that depends on the pH of the urine, so the amount of each drug excreted varies with the pH of the urine.
pH CHANGES ALONG THE NEPHRON
A moderate drop in pH occurs in the proximal tubular fluid, but, as noted above, most of the secreted H+ has little effect on luminal pH because of the formation of CO2 and H2O from H2CO3. In contrast, the distal tubule has less capacity to secrete H+, but secretion in this segment has a greater effect on urinary pH.
FACTORS AFFECTING ACID SECRETION
Renal acid secretion is altered by changes in the intracellular PCO2, K+ concentration, carbonic anhydrase level, and adrenocortical hormone concentration. When the PCO2 is high (respiratory acidosis), more intracellular H2CO3 is available to buffer the hydroxyl ions and acid secretion is enhanced, whereas the reverse is true when the PCO2 falls. K+ depletion enhances acid secretion, apparently because the loss of K+ causes intracellular acidosis even though the plasma pH may be elevated. Conversely, K+ excess in the cells inhibits acid secretion. When carbonic anhydrase is inhibited, acid secretion is inhibited because the formation of H2CO3 is decreased. Aldosterone and the other adrenocortical steroids that enhance tubular reabsorption of Na+ also increase the secretion of H+ and K+.
BICARBONATE EXCRETION
Although the process of ![]() reabsorption does not involve actual transport of this ion into the tubular cells,
reabsorption does not involve actual transport of this ion into the tubular cells, ![]() reabsorption is proportional to the amount filtered over a relatively wide range. There is no demonstrable Tm, but
reabsorption is proportional to the amount filtered over a relatively wide range. There is no demonstrable Tm, but ![]() reabsorption is decreased by an unknown mechanism when the extracellular fluid (ECF) volume is expanded (Figure 39–4). When the plasma
reabsorption is decreased by an unknown mechanism when the extracellular fluid (ECF) volume is expanded (Figure 39–4). When the plasma ![]() concentration is low, all the filtered
concentration is low, all the filtered ![]() is reabsorbed; but when the plasma
is reabsorbed; but when the plasma ![]() concentration is high; that is, above 26–28 mEq/L (the renal threshold for
concentration is high; that is, above 26–28 mEq/L (the renal threshold for ![]() ),
), ![]() appears in the urine and the urine becomes alkaline. Conversely, when the plasma
appears in the urine and the urine becomes alkaline. Conversely, when the plasma ![]() falls below about 26 mEq/L, the value at which all the secreted H+ is being used to reabsorb
falls below about 26 mEq/L, the value at which all the secreted H+ is being used to reabsorb ![]() , more H+ becomes available to combine with other buffer anions. Therefore, the lower the plasma
, more H+ becomes available to combine with other buffer anions. Therefore, the lower the plasma ![]() concentration drops, the more acidic the urine becomes and the greater its NH4+ content (see Clinical Box 39–1).
concentration drops, the more acidic the urine becomes and the greater its NH4+ content (see Clinical Box 39–1).

FIGURE 39–4 Effect of ECF volume on ![]() filtration, reabsorption, and excretion in rats. The pattern of
filtration, reabsorption, and excretion in rats. The pattern of ![]() excretion is similar in humans. The plasma
excretion is similar in humans. The plasma ![]() concentration is normally about 24 mEq/L. (Reproduced with permission from Valtin H: Renal Function, 2nd ed. Little, Brown, 1983.)
concentration is normally about 24 mEq/L. (Reproduced with permission from Valtin H: Renal Function, 2nd ed. Little, Brown, 1983.)
CLINICAL BOX 39–1
Implications of Urinary pH Changes
Depending on the rates of the interrelated processes of acid secretion, NH4+ production, and ![]() excretion, the pH of the urine in humans varies from 4.5 to 8.0. Excretion of urine that is at a pH different from that of the body fluids has important implications for the body’s electrolyte and acid–base economy. Acids are buffered in the plasma and cells, the overall reaction being
excretion, the pH of the urine in humans varies from 4.5 to 8.0. Excretion of urine that is at a pH different from that of the body fluids has important implications for the body’s electrolyte and acid–base economy. Acids are buffered in the plasma and cells, the overall reaction being ![]() . The H2CO3 forms CO2 and H2O, and the CO2 is expired, while the NaA appears in the glomerular filtrate. To the extent that the Na+ is replaced by H+ in the urine, Na+ is conserved in the body. Furthermore, for each H+ ion excreted with phosphate or as NH4+, there is a net gain of one
. The H2CO3 forms CO2 and H2O, and the CO2 is expired, while the NaA appears in the glomerular filtrate. To the extent that the Na+ is replaced by H+ in the urine, Na+ is conserved in the body. Furthermore, for each H+ ion excreted with phosphate or as NH4+, there is a net gain of one ![]() ion in the blood, replenishing the supply of this important buffer anion. Conversely, when base is added to the body fluids, the OH– ions are buffered, raising the plasma
ion in the blood, replenishing the supply of this important buffer anion. Conversely, when base is added to the body fluids, the OH– ions are buffered, raising the plasma ![]() . When the plasma level exceeds 28 mEq/L, the urine becomes alkaline and the extra
. When the plasma level exceeds 28 mEq/L, the urine becomes alkaline and the extra ![]() is excreted in the urine. Because the rate of maximal H+ secretion by the tubules varies directly with the arterial PCO2.
is excreted in the urine. Because the rate of maximal H+ secretion by the tubules varies directly with the arterial PCO2. ![]() reabsorption is also affected by the PCO2. This relationship has been discussed in more detail in the text.
reabsorption is also affected by the PCO2. This relationship has been discussed in more detail in the text.
THERAPEUTIC HIGHLIGHT
Sulfonamides inhibit carbonic anhydrase and sulfonamide derivatives have been used clinically as diuretics because of their inhibitory effects on carbonic anhydrase in the kidney (see Chapter 37).
DEFENSE OF H+ CONCENTRATION
The mystique that envelopes the subject of acid–base balance makes it necessary to point out that the core of the problem is not “buffer base” or “fixed cation” or the like, but simply the maintenance of the H+ concentration of the ECF. The mechanisms regulating the composition of the ECF are particularly important as far as this specific ion is concerned, because the machinery of the cells is very sensitive to changes in H+ concentration. Intracellular H+concentration, which can be measured by using microelectrodes, pH-sensitive fluorescent dyes, and phosphorus magnetic resonance, is distinct from extracellular pH and appears to be regulated by a variety of intracellular processes. However, it is sensitive to changes in ECF H+ concentration.
The pH notation is a useful means of expressing H+ concentrations in the body, because the H+ concentrations are very low relative to those of other cations. Thus, the normal Na+ concentration of arterial plasma that has been equilibrated with red blood cells is about 140 mEq/L, whereas the H+ concentration is 0.00004 mEq/L (Table 39–1). The pH, the negative logarithm of 0.00004, is therefore 7.4. Of course, a decrease in pH of 1 unit, for example, from 7.0 to 6.0, represents a 10-fold increase in H+ concentration. It is important to remember that the pH of blood is the pH of true plasma—plasma that has been in equilibrium with red cells—because the red cells contain hemoglobin, which is quantitatively one of the most important blood buffers (see Chapter 36).

TABLE 39–1 H+ concentration and pH of body fluids.
H+ BALANCE
The pH of the arterial plasma is normally 7.40 and that of venous plasma slightly lower. Technically, acidosis is present whenever the arterial pH is below 7.40, and alkalosis is present whenever it is above 7.40, although variations of up to 0.05 pH unit occur without untoward effects. The H+ concentrations in the ECF that are compatible with life cover an approximately fivefold range, from 0.00002 mEq/L (pH 7.70) to 0.0001 mEq/L (pH 7.00).
Amino acids are utilized in the liver for gluconeogenesis, leaving NH4+ and ![]() as products from their amino and carboxyl groups (Figure 39–5). The NH4+ is incorporated into urea (see Chapter 28) and the protons that are formed are buffered intracellularly by
as products from their amino and carboxyl groups (Figure 39–5). The NH4+ is incorporated into urea (see Chapter 28) and the protons that are formed are buffered intracellularly by ![]() , so little NH4+ and
, so little NH4+ and ![]() escape into the circulation. However, metabolism of sulfur-containing amino acids produces H2SO4, and metabolism of phosphorylated amino acids such as phosphoserine produces H3PO4. These strong acids enter the circulation and present a major H+ load to the buffers in the ECF. The H+ load from amino acid metabolism is normally about 50 mEq/d. The CO2 formed by metabolism in the tissues is in large part hydrated to H2CO3 (see Chapter 36), and the total H+ load from this source is over 12,500 mEq/d. However, most of the CO2 is excreted in the lungs, and only small quantities of the H+ remain to be excreted by the kidneys. Common sources of extra acid loads are strenuous exercise (lactic acid), diabetic ketosis (acetoacetic acid and β-hydroxybutyric acid), and ingestion of acidifying salts such as NH4Cl and CaCl2, which in effect add HCl to the body. A failure of diseased kidneys to excrete normal amounts of acid is also a cause of acidosis. Fruits are the main dietary source of alkali. They contain Na+ and K+ salts of weak organic acids, and the anions of these salts are metabolized to CO2, leaving NaHCO3 and KHCO3 in the body. NaHCO3 and other alkalinizing salts are sometimes ingested in large amounts, but a more common cause of alkalosis is loss of acid from the body as a result of vomiting of gastric juice rich in HCl. This is, of course, equivalent to adding alkali to the body.
escape into the circulation. However, metabolism of sulfur-containing amino acids produces H2SO4, and metabolism of phosphorylated amino acids such as phosphoserine produces H3PO4. These strong acids enter the circulation and present a major H+ load to the buffers in the ECF. The H+ load from amino acid metabolism is normally about 50 mEq/d. The CO2 formed by metabolism in the tissues is in large part hydrated to H2CO3 (see Chapter 36), and the total H+ load from this source is over 12,500 mEq/d. However, most of the CO2 is excreted in the lungs, and only small quantities of the H+ remain to be excreted by the kidneys. Common sources of extra acid loads are strenuous exercise (lactic acid), diabetic ketosis (acetoacetic acid and β-hydroxybutyric acid), and ingestion of acidifying salts such as NH4Cl and CaCl2, which in effect add HCl to the body. A failure of diseased kidneys to excrete normal amounts of acid is also a cause of acidosis. Fruits are the main dietary source of alkali. They contain Na+ and K+ salts of weak organic acids, and the anions of these salts are metabolized to CO2, leaving NaHCO3 and KHCO3 in the body. NaHCO3 and other alkalinizing salts are sometimes ingested in large amounts, but a more common cause of alkalosis is loss of acid from the body as a result of vomiting of gastric juice rich in HCl. This is, of course, equivalent to adding alkali to the body.
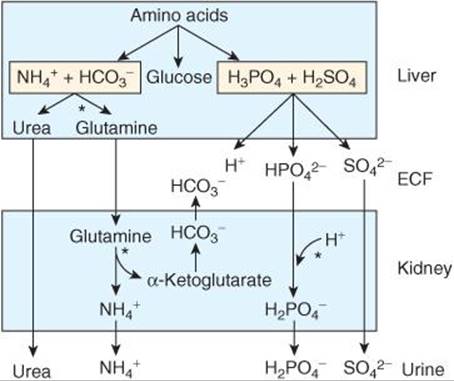
FIGURE 39–5 Role of the liver and kidneys in the handling of metabolically produced acid loads. Sites where regulation occurs are indicated by asterisks. (Modified and reproduced with permission from Knepper MA, et al: Ammonium, urea, and systemic pH regulation. Am J Physiol 1987;253:F199.)
BUFFERING
Buffering is of key importance in maintaining H+ homeostasis. It is defined in Chapter 1 and discussed in Chapter 36 in the context of gas transport, with an emphasis on roles for proteins, hemoglobin, and the carbonic anhydrase system in the blood. Carbonic anhydrase is also found in high concentration in gastric acid-secreting cells (see Chapter 25) and in renal tubular cells (see Chapter 37). Carbonic anhydrase is a protein with a molecular weight of 30,000 that contains an atom of zinc in each molecule. It is inhibited by cyanide, azide, and sulfide. In vivo, buffering is, of course, not limited to the blood. The principal buffers in the blood, interstitial fluid, and intracellular fluid are listed in Table 39–2. The principal buffers in cerebrospinal fluid (CSF) and urine are the bicarbonate and phosphate systems. In metabolic acidosis, only 15–20% of the acid load is buffered by the ![]() system in the ECF, and most of the remainder is buffered in cells. In metabolic alkalosis, about 30–35% of the OH– load is buffered in cells, whereas in respiratory acidosis and alkalosis, almost all of the buffering is intracellular.
system in the ECF, and most of the remainder is buffered in cells. In metabolic alkalosis, about 30–35% of the OH– load is buffered in cells, whereas in respiratory acidosis and alkalosis, almost all of the buffering is intracellular.

TABLE 39–2 Principal buffers in body fluids.
In animal cells, the principal regulators of intracellular pH are ![]() transporters. Those characterized to date include the
transporters. Those characterized to date include the ![]() exchanger AE1, three
exchanger AE1, three ![]() cotransporters, and a K+–
cotransporters, and a K+–![]() cotransporter.
cotransporter.
SUMMARY
When a strong acid is added to the blood, the major buffer reactions are driven to the left. The blood levels of the three “buffer anions” Hb– (hemoglobin), Prot– (protein), and ![]() consequently drop. The anions of the added acid are filtered into the renal tubules. They are accompanied (“covered”) by cations, particularly Na+, because electrochemical neutrality is maintained. By processes that have been discussed above, the tubules replace the Na+ with H+and in so doing reabsorb equimolar amounts of Na+ and
consequently drop. The anions of the added acid are filtered into the renal tubules. They are accompanied (“covered”) by cations, particularly Na+, because electrochemical neutrality is maintained. By processes that have been discussed above, the tubules replace the Na+ with H+and in so doing reabsorb equimolar amounts of Na+ and ![]() , thus conserving the cations, eliminating the acid, and restoring the supply of buffer anions to normal. When CO2 is added to the blood, similar reactions occur, except that since it is H2CO3 that is formed, the plasma
, thus conserving the cations, eliminating the acid, and restoring the supply of buffer anions to normal. When CO2 is added to the blood, similar reactions occur, except that since it is H2CO3 that is formed, the plasma ![]() rises rather than falls.
rises rather than falls.
RENAL COMPENSATION TO RESPIRATORY ACIDOSIS AND ALKALOSIS
As noted in Chapter 36, a rise in arterial PCO2 due to decreased ventilation causes respiratory acidosis and conversely, a decline in PCO2 causes respiratory alkalosis. The initial changes shown in Figure 35-8 are those that occur independently of any compensatory mechanism; that is, they are those of uncompensated respiratory acidosis or alkalosis. In either situation, changes are produced in the kidneys, which then tend to compensate for the acidosis or alkalosis, adjusting the pH toward normal.
![]() reabsorption in the renal tubules depends not only on the filtered load of
reabsorption in the renal tubules depends not only on the filtered load of ![]() , which is the product of the glomerular filtration rate (GFR) and the plasma
, which is the product of the glomerular filtration rate (GFR) and the plasma ![]() level, but also on the rate of H+ secretion by the renal tubular cells, since
level, but also on the rate of H+ secretion by the renal tubular cells, since ![]() is reabsorbed by exchange for H+. The rate of H+ secretion—and hence the rate of
is reabsorbed by exchange for H+. The rate of H+ secretion—and hence the rate of ![]() reabsorption—is proportional to the arterial PCO2, probably because the more CO2 that is available to form H2CO3 in the tubular cells, the more H+ that can be secreted. Furthermore, when the PCO2 is high, the interior of most cells becomes more acidic. In respiratory acidosis, renal tubular H+ secretion is therefore increased, removing H+from the body; and even though the plasma
reabsorption—is proportional to the arterial PCO2, probably because the more CO2 that is available to form H2CO3 in the tubular cells, the more H+ that can be secreted. Furthermore, when the PCO2 is high, the interior of most cells becomes more acidic. In respiratory acidosis, renal tubular H+ secretion is therefore increased, removing H+from the body; and even though the plasma ![]() is elevated,
is elevated, ![]() reabsorption is increased, further raising the plasma
reabsorption is increased, further raising the plasma ![]() . This renal compensation for respiratory acidosis is shown graphically in the shift from acute to chronic respiratory acidosis in Figure 35–8. Cl– excretion is increased, and plasma Cl– falls as plasma
. This renal compensation for respiratory acidosis is shown graphically in the shift from acute to chronic respiratory acidosis in Figure 35–8. Cl– excretion is increased, and plasma Cl– falls as plasma ![]() is increased. Conversely, in respiratory alkalosis, the low PCO2 hinders renal H+ secretion,
is increased. Conversely, in respiratory alkalosis, the low PCO2 hinders renal H+ secretion, ![]() reabsorption is depressed, and
reabsorption is depressed, and ![]() is excreted, further reducing the already low plasma
is excreted, further reducing the already low plasma ![]() and lowering the pH toward normal.
and lowering the pH toward normal.
METABOLIC ACIDOSIS
When acids stronger than Hb and the other buffer acids are added to blood, metabolic acidosis is produced; and when the free H+ level falls as a result of addition of alkali or removal of acid, metabolic alkalosis results. Following the example from Chapter 35, if H2SO4 is added, the H+ is buffered and the Hb–, Prot–, and ![]() levels in plasma drop. The H2CO3 formed is converted to H2O and CO2, and the CO2 is rapidly excreted via the lungs. This is the situation in uncompensated metabolic acidosis. Actually, the rise in plasma H+ stimulates respiration, so that the PCO2, instead of rising or remaining constant, is reduced. This respiratory compensation raises the pH even further. The renal compensatory mechanisms then bring about the excretion of the extra H+ and return the buffer systems to normal.
levels in plasma drop. The H2CO3 formed is converted to H2O and CO2, and the CO2 is rapidly excreted via the lungs. This is the situation in uncompensated metabolic acidosis. Actually, the rise in plasma H+ stimulates respiration, so that the PCO2, instead of rising or remaining constant, is reduced. This respiratory compensation raises the pH even further. The renal compensatory mechanisms then bring about the excretion of the extra H+ and return the buffer systems to normal.
RENAL COMPENSATION
The anions that replace ![]() in the plasma in metabolic acidosis are filtered, each with a cation (principally Na+), thus maintaining electrical neutrality. The renal tubular cells secrete H+ into the tubular fluid in exchange for Na+; and for each H+ secreted, one Na+ and one
in the plasma in metabolic acidosis are filtered, each with a cation (principally Na+), thus maintaining electrical neutrality. The renal tubular cells secrete H+ into the tubular fluid in exchange for Na+; and for each H+ secreted, one Na+ and one ![]() are added to the blood. The limiting urinary pH of 4.5 would be reached rapidly and the total amount of H+ secreted would be small if no buffers were present in the urine to “tie up” H+. However, secreted H+ reacts with
are added to the blood. The limiting urinary pH of 4.5 would be reached rapidly and the total amount of H+ secreted would be small if no buffers were present in the urine to “tie up” H+. However, secreted H+ reacts with ![]() to form CO2 and H2O (bicarbonate reabsorption); with
to form CO2 and H2O (bicarbonate reabsorption); with ![]() to form
to form ![]() ; and with NH3 to form NH4+. In this way, large amounts of H+ can be secreted, permitting correspondingly large amounts of
; and with NH3 to form NH4+. In this way, large amounts of H+ can be secreted, permitting correspondingly large amounts of ![]() to be returned to (in the case of bicarbonate reabsorption) or added to the depleted body stores and large numbers of the cations to be reabsorbed. It is only when the acid load is very large that cations are lost with the anions, producing diuresis and depletion of body cation stores. In chronic acidosis, glutamine synthesis in the liver is increased, using some of the NH4+ that usually is converted to urea (Figure 39–5), and the glutamine provides the kidneys with an additional source of NH4+. NH3 secretion increases over a period of days (adaptation of NH3 secretion), further improving the renal compensation for acidosis. In addition, the metabolism of glutamine in the kidneys produces α-ketoglutarate, and this in turn is decarboxylated, producing
to be returned to (in the case of bicarbonate reabsorption) or added to the depleted body stores and large numbers of the cations to be reabsorbed. It is only when the acid load is very large that cations are lost with the anions, producing diuresis and depletion of body cation stores. In chronic acidosis, glutamine synthesis in the liver is increased, using some of the NH4+ that usually is converted to urea (Figure 39–5), and the glutamine provides the kidneys with an additional source of NH4+. NH3 secretion increases over a period of days (adaptation of NH3 secretion), further improving the renal compensation for acidosis. In addition, the metabolism of glutamine in the kidneys produces α-ketoglutarate, and this in turn is decarboxylated, producing ![]() , which enters the bloodstream and helps buffer the acid load (Figure 39–5).
, which enters the bloodstream and helps buffer the acid load (Figure 39–5).
The overall reaction in blood when a strong acid such as H2SO4 is added is:
![]()
For each mole of H+ added, 1 mole of NaHCO3 is lost. The kidney in effect reverses the reaction:
![]()
and the H+ and ![]() are excreted. Of course, H2SO4 is not excreted as such, the H+ appearing in the urine as titratable acidity and NH4+.
are excreted. Of course, H2SO4 is not excreted as such, the H+ appearing in the urine as titratable acidity and NH4+.
In metabolic acidosis, the respiratory compensation tends to inhibit the renal response in the sense that the induced drop in PCO2 hinders acid secretion, but it also decreases the filtered load of ![]() and so its net inhibitory effect is not great.
and so its net inhibitory effect is not great.
METABOLIC ALKALOSIS
In metabolic alkalosis, the plasma ![]() level and pH rise (Figure 39–6). The respiratory compensation is a decrease in ventilation produced by the decline in H+ concentration, and this elevates the PCO2. This brings the pH back toward normal while elevating the plasma
level and pH rise (Figure 39–6). The respiratory compensation is a decrease in ventilation produced by the decline in H+ concentration, and this elevates the PCO2. This brings the pH back toward normal while elevating the plasma ![]() level still further. The magnitude of this compensation is limited by the carotid and aortic chemoreceptor mechanisms, which drive the respiratory center if any appreciable fall occurs in the arterial PO2. In metabolic alkalosis, more renal H+ secretion is expended in reabsorbing the increased filtered load of
level still further. The magnitude of this compensation is limited by the carotid and aortic chemoreceptor mechanisms, which drive the respiratory center if any appreciable fall occurs in the arterial PO2. In metabolic alkalosis, more renal H+ secretion is expended in reabsorbing the increased filtered load of ![]() ; and if the
; and if the ![]() level in plasma exceeds 26–28 mEq/L,
level in plasma exceeds 26–28 mEq/L, ![]() appears in the urine. The rise in PCO2 inhibits the renal compensation by facilitating acid secretion, but its effect is relatively slight.
appears in the urine. The rise in PCO2 inhibits the renal compensation by facilitating acid secretion, but its effect is relatively slight.

FIGURE 39–6 Siggaard–Andersen curve nomogram. (Courtesy of O Siggaard–Andersen and Radiometer, Copenhagen, Denmark.)
THE SIGGAARD–ANDERSEN CURVE NOMOGRAM
Use of the Siggaard–Andersen curve nomogram (Figure 39–6) to plot the acid–base characteristics of arterial blood is helpful in clinical situations. This nomogram has PCO2 plotted on a log scale on the vertical axis and pH on the horizontal axis. Thus, any point to the left of a vertical line through pH 7.40 indicates acidosis, and any point to the right indicates alkalosis. The position of the point above or below the horizontal line through a PCO2 of 40 mm Hg defines the effective degree of hypoventilation or hyperventilation.
If a solution containing NaHCO3 and no buffers were equilibrated with gas mixtures containing various amounts of CO2, the pH and PCO2 values at equilibrium would fall along the dashed line on the left in Figure 39–6 or a line parallel to it. If buffers were present, the slope of the line would be greater; and the greater the buffering capacity of the solution, the steeper the line. For normal blood containing 15 g of hemoglobin/dL, the CO2titration line passes through the 15-g/dL mark on the hemoglobin scale (on the underside of the upper curved scale) and the point where the ![]() mm Hg and
mm Hg and ![]() lines intersect, as shown in Figure 39–6. When the hemoglobin content of the blood is low, there is significant loss of buffering capacity, and the slope of the CO2 titration line diminishes. However, blood of course contains buffers in addition to hemoglobin, so that even the line drawn from the zero point on the hemoglobin scale through the normal PCO2–pH intercept is steeper than the curve for a solution containing no buffers.
lines intersect, as shown in Figure 39–6. When the hemoglobin content of the blood is low, there is significant loss of buffering capacity, and the slope of the CO2 titration line diminishes. However, blood of course contains buffers in addition to hemoglobin, so that even the line drawn from the zero point on the hemoglobin scale through the normal PCO2–pH intercept is steeper than the curve for a solution containing no buffers.
For clinical use, arterial blood or arterialized capillary blood is drawn anaerobically and its pH measured. The pHs of the same blood after equilibration with each of two gas mixtures containing different known amounts of CO2are also determined. The pH values at the known PCO2 levels are plotted and connected to provide the CO2 titration line for the blood sample. The pH of the blood sample before equilibration is plotted on this line, and the PCO2 of the sample is read off the vertical scale. The standard bicarbonate content of the sample is indicated by the point at which the CO2 titration line intersects the bicarbonate scale on the ![]() mm Hg line. The standard bicarbonate is not the actual bicarbonate concentration of the sample but, rather, what the bicarbonate concentration would be after elimination of any respiratory component. It is a measure of the alkali reserve of the blood, except that it is measured by determining the pH rather than the total CO2 content of the sample after equilibration. Like the alkali reserve, it is an index of the degree of metabolic acidosis or alkalosis present.
mm Hg line. The standard bicarbonate is not the actual bicarbonate concentration of the sample but, rather, what the bicarbonate concentration would be after elimination of any respiratory component. It is a measure of the alkali reserve of the blood, except that it is measured by determining the pH rather than the total CO2 content of the sample after equilibration. Like the alkali reserve, it is an index of the degree of metabolic acidosis or alkalosis present.
Additional graduations on the upper curved scale of the nomogram (Figure 39–6) are provided for measuring buffer base content; the point where the CO2 calibration line of the arterial blood sample intersects this scale shows the mEq/L of buffer base in the sample. The buffer base is equal to the total number of buffer anions (principally Prot–, ![]() , and Hb–) that can accept hydrogen ions in the blood. The normal value in an individual with 15 g of hemoglobin per deciliter of blood is 48 mEq/L.
, and Hb–) that can accept hydrogen ions in the blood. The normal value in an individual with 15 g of hemoglobin per deciliter of blood is 48 mEq/L.
The point at which the CO2 calibration line intersects the lower curved scale on the nomogram indicates the base excess. This value, which is positive in alkalosis and negative in acidosis, is the amount of acid or base that would restore 1 L of blood to normal acid–base composition at a PCO2 of 40 mm Hg. It should be noted that a base deficiency cannot be completely corrected simply by calculating the difference between the normal standard bicarbonate (24 mEq/L) and the actual standard bicarbonate and administering this amount of NaHCO3 per liter of blood; some of the added ![]() is converted to CO2 and H2O, and the CO2 is lost in the lungs. The actual amount that must be added is roughly 1.2 times the standard bicarbonate deficit, but the lower curved scale on the nomogram, which has been developed empirically by analyzing many blood samples, is more accurate.
is converted to CO2 and H2O, and the CO2 is lost in the lungs. The actual amount that must be added is roughly 1.2 times the standard bicarbonate deficit, but the lower curved scale on the nomogram, which has been developed empirically by analyzing many blood samples, is more accurate.
In treating acid–base disturbances, one must, of course, consider not only the blood but also all the body fluid compartments. The other fluid compartments have markedly different concentrations of buffers. It has been determined empirically that administration of an amount of acid (in alkalosis) or base (in acidosis) equal to 50% of the body weight in kilograms times the blood base excess per liter will correct the acid–base disturbance in the whole body. At least when the abnormality is severe, however, it is unwise to attempt such a large correction in a single step; instead, about half the indicated amount should be given and the arterial blood acid–base values determined again. The amount required for final correction can then be calculated and administered. It is also worth noting that, at least in lactic acidosis, NaHCO3 decreases cardiac output and lowers blood pressure, so it should be used with caution.
CHAPTER SUMMARY
![]() The cells of the proximal and distal tubules secrete hydrogen ions. Acidification also occurs in the collecting ducts. The reaction that is primarily responsible for H+ secretion in the proximal tubules is Na+–H+ exchange. Na is absorbed from the lumen of the tubule and H is excreted.
The cells of the proximal and distal tubules secrete hydrogen ions. Acidification also occurs in the collecting ducts. The reaction that is primarily responsible for H+ secretion in the proximal tubules is Na+–H+ exchange. Na is absorbed from the lumen of the tubule and H is excreted.
![]() The maximal H+ gradient against which the transport mechanisms can secrete in humans corresponds to a urine pH of about 4.5. However, three important reactions in the tubular fluid remove free H+, permitting more acid to be secreted. These are the reactions with
The maximal H+ gradient against which the transport mechanisms can secrete in humans corresponds to a urine pH of about 4.5. However, three important reactions in the tubular fluid remove free H+, permitting more acid to be secreted. These are the reactions with ![]() to form CO2 and H2O, with
to form CO2 and H2O, with ![]() to form
to form ![]() , and with NH3 to form NH4+.
, and with NH3 to form NH4+.
![]() Carbonic anhydrase catalyzes the formation of H2CO3, and drugs that inhibit carbonic anhydrase depress secretion of acid by the proximal tubules.
Carbonic anhydrase catalyzes the formation of H2CO3, and drugs that inhibit carbonic anhydrase depress secretion of acid by the proximal tubules.
![]() Renal acid secretion is altered by changes in the intracellular PCO2, K+ concentration, carbonic anhydrase level, and adrenocortical hormone concentration.
Renal acid secretion is altered by changes in the intracellular PCO2, K+ concentration, carbonic anhydrase level, and adrenocortical hormone concentration.
MULTIPLE-CHOICE QUESTIONS
For all questions, select the single best answer unless otherwise directed.
1. Which of the following is the principal buffer in interstitial fluid?
A. Hemoglobin
B. Other proteins
C. Carbonic acid
D. H2PO4
E. Compounds containing histidine
2. Increasing alveolar ventilation increases the blood pH because
A. it activates neural mechanisms that remove acid from the blood.
B. it makes hemoglobin a stronger acid.
C. it increases the PO2 of the blood.
D. it decreases the PCO2 in the alveoli.
E. the increased muscle work of increased breathing generates more CO2.
3. In uncompensated metabolic alkalosis
A. the plasma pH, the plasma ![]() concentration, and the arterial PCO2 are all low.
concentration, and the arterial PCO2 are all low.
B. the plasma pH is high and the plasma ![]() concentration and arterial PCO2 are low.
concentration and arterial PCO2 are low.
C. the plasma pH and the plasma ![]() concentration are low and the arterial PCO2 is normal.
concentration are low and the arterial PCO2 is normal.
D. the plasma pH and the plasma ![]() concentration are high and the arterial PCO2 is normal.
concentration are high and the arterial PCO2 is normal.
E. the plasma pH is low, the plasma ![]() concentration is high, and the arterial PCO2 is normal.
concentration is high, and the arterial PCO2 is normal.
4. In a patient with a plasma pH of 7.10, the [![]() ]/[H2CO3] ratio in plasma is
]/[H2CO3] ratio in plasma is
A. 20.
B. 10.
C. 2.
D. 1.
E. 0.1.
CHAPTER RESOURCES
Adrogué HJ, Madius NE: Management of life-threatening acid–base disorders. N Engl J Med 1998;338:26.
Brenner BM, Rector FC Jr (editors): The Kidney, 6th ed, 2 Vols. Saunders, 1999.
Davenport HW: The ABC of Acid–Base Chemistry, 6th ed. University of Chicago Press, 1974.
Halperin ML: Fluid, Electrolyte, and Acid–Base Physiology, 3rd ed. Saunders, 1998.
Lemann J Jr., Bushinsky DA, Hamm LL: Bone buffering of acid and base in humans. Am J Physiol Renal Physiol 2003;285:F811 (Review).
Vize PD, Wolff AS, Bard JBL (editors): The Kidney: From Normal Development to Congenital Disease. Academic Press, 2003.