Paul B. Blanch
Immediate Concerns
Ventilation/Perfusion (VA/Q) in the Normal Lung
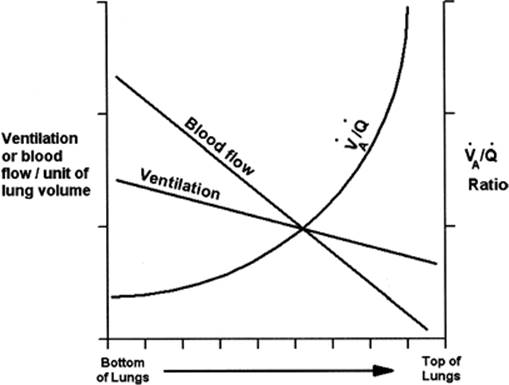
The lung's primary function is to add oxygen (O2) to, and remove carbon dioxide (CO2) from, blood passing through the pulmonary capillary beds. For this to occur, the gas we breathe must be matched to the blood flowing through our lungs. Average minute alveolar ventilation (VA) for a healthy adult is 4 liters (L) per minute, while resting cardiac output (Q) is 5 L/minute; therefore that optimal ventilation/perfusion matching (VA/Q ratio) is 4 L/minute divided by 5 L/minute or 0.8. Perfect VA/Q matching is unlikely because the distribution of gas and blood flow varies across the lung fields for several reasons. Both gases and blood have mass and are therefore gravity dependent (Fig. 128.1); as a result, both increase as we progress from the apex to the base of the lung. Gravity's effect on blood flow is, however, predominant; it has been estimated that in an upright subject, six times as much blood passes through each lung base compared to its apex, whereas only 2½ times as much air reaches each lung base. These different gradients dictate that the VA/Q ratio rises progressively from the bottom to the top of the lungs.
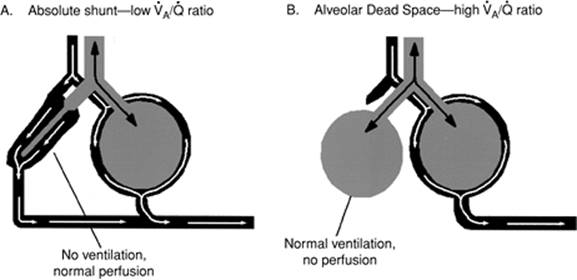
Furthermore, the lungs are composed of millions of alveoli, connected to each other and eventually to the trachea by a labyrinth of pathways and interconnections (pores of Kohn). Few connections are consistent in either length or diameter; this effect conspires to further disrupt the distribution of inhaled gases. Even the healthiest athletes exhibit areas of shunt and dead space (Fig. 128.2). About 30% of the air a healthy adult breathes each minute is wasted as dead space ventilation (VD), and 3% to 5% of the cardiac output passes through the lungs without undergoing gas exchange (shunt). Any pathophysiologic stimulus that acutely increases or decreases ventilation or cardiac output is likely to have a pronounced impact on VA/Q ratios and in turn, on oxygenation and CO2 removal.
Positive Pressure Breathing
Positive pressure mechanical ventilation, unlike normal breathing, increases transpulmonary pressure, reduces venous return, and ultimately lowers cardiac output. Positive pressure breathing also preferentially forces gas into areas of the lung with the lowest airway resistance (Raw) and highest compliance (CRS). It is not uncommon for ventilated patients to require airway pressures (Paw) of 30 cm H2O or more; yet, normal systolic pulmonary arterial pressures seldom exceed 20 to 25 mm Hg. It follows that during positive pressure inflations, if intraluminal alveolar pressure exceeds the hydrostatic pressure, blood flow and gas exchange cease—until alveolar pressure falls below hydrostatic levels again during exhalation. Given these factors, it is easy to understand how mechanical ventilation often disrupts VA/Q, and why up to 60% or more of each positive pressure breath is wasted as VD. Allowing patients to breathe spontaneously between mechanical breaths significantly reduces mean transpulmonary and transluminal pressures and improves venous return and cardiac output, which in turn improves VA/Q.
|
|
|
Figure 128.1. The effects of gravity on ventilation (VA)/perfusion (Q) ratio (VA/Q). In the upright subject, gravity affects VA, Q, and concomitantly, the VA/Q ratio. Gravitational forces pull on both the gases we breathe and pulmonary blood flow; as a result, VA and Q increase from a lung's apex to its base. Due to blood's greater mass, gravity's effect on Q predominates; it is estimated that Q at a lung's base is six times as great as at its apex, compared to only 2½ times as much VA at the lung's base versus its apex. The resultant VA/Q ratio is therefore greater at the lung apices than the bases. |
VA/Q Inequalities in Respiratory Failure
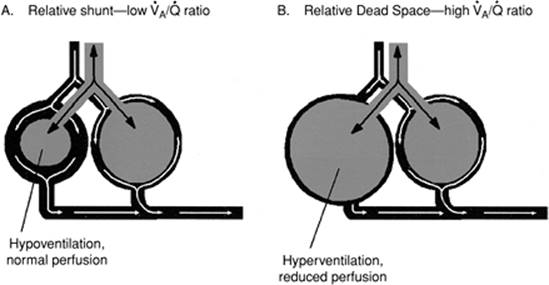
It is not necessary that alveoli be completely deprived of VA or Q for life-threatening symptoms to exist. When significant areas of a patient's lungs receive too much or too little VA or Q, these regions exhibit abnormally high or low VA/Q ratios, referred to as relative shunt and relative dead space (Fig. 128.3). Relative shunt and VD are extremely common in the intensive care unit (ICU) setting, and disrupt CO2 removal and oxygenation just as quickly as comparable but smaller areas of absolute VD or shunt.
|
|
|
Figure 128.2. Ventilation (VA)/perfusion (Q) (VA/Q) abnormalities. A: Absolute shunt—low VA/Q ratio. An intrapulmonary, or absolute, shunt occurs when blood continues to perfuse collapsed or otherwise unventilated alveoli; blood literally shunts past or bypasses the lung, without participating in gas exchange. B: Alveolar dead space—high VA/Q ratio. Dead space or wasted ventilation exists when alveoli receive ventilation but no blood flow. |
Conditions Affecting Lung Structure
Along with conditions that affect only VA or Q, several disorders actually damage lung structure. Furthermore, failure to properly manage the ventilator, in some situations, may play a role in determining the ultimate severity and progression of the lung disease (1,2,3,4,5,6,7). Critical care personnel called on to manage ventilators for these patients, whether in a primary or consulting role, must possess a thorough understanding of the pathophysiology and treatment of acute respiratory failure.
Reductions in the arterial partial pressure of oxygen (PaO2) and carbon dioxide (PaCO2) are characteristic of the early stages of acute respiratory distress syndrome (ARDS).
Widespread, but not uniform, alveolar destabilization and collapse (atelectasis) are hallmarks of ARDS. If ARDS is not aggressively managed in its early stages, pulmonary consolidation (secondary to atelectasis) develops and may lead to a fibro-prolific phase; the chances for recovery are significantly reduced if the disease progresses to this point (8). Hypoxemia results from both relative and absolute shunting caused by complete or partial alveolar collapse and the continued perfusion of these lung regions.
|
|
|
Figure 128.3. Relative ventilation (VA)/perfusion (Q) (VA/Q) abnormalities. A: Relative shunt—low VA/Q ratio. A relative shunt occurs when an alveolus receives too much Q in relation to VA. B:Relative dead space—high VA/Q ratio. Relative dead space exists when an alveolus receives too much VA relative to its Q. |
Ventilator Therapy
With respect to therapy, a shifting emphasis in the role of mechanical ventilation has occurred. Positive pressure ventilation was clearly responsible for the decrease in mortality following the poliomyelitis epidemic. Yet, a similar reduction in mortality has been slow to respond following the widespread application of mechanical ventilatory support to ARDS or to acute exacerbations of chronic obstructive pulmonary disease (COPD). Although this is in part due to the multisystem dysfunction that frequently accompanies such problems, it now appears that the inappropriate use of mechanical ventilation has played a significant role.
Poliomyelitis, Guillain-Barré syndrome, and other neuromuscular disease states produce respiratory insufficiency because of mechanical and neural failure to control diaphragmatic driven ventilation. In the absence of complications such as aspiration of gastric contents, pulmonary parenchymal function remains intact. By contrast, ARDS represents a failure of gas exchange that is related almost entirely to parenchymal involvement. Furthermore, neuromuscular and musculoskeletal function generally remain unimpaired during ARDS, although there are exceptions such as flail chest associated with underlying pulmonary contusion after trauma. Even in this situation, however, the musculoskeletal abnormality is of secondary importance compared with the underlying lung contusion.
Even the simplest ventilator provides a satisfactory means for sustaining VA when neuromuscular and musculoskeletal problems predominate. Yet, it would be very surprising if a simple ventilator performed equally well in the therapy of ARDS, in which an entirely different spectrum of pathophysiologic changes occur. Thus, when a decrease in residual alveolar volume is present—whether caused by surfactant depletion, partial airway obstruction, interstitial and alveolar pulmonary edema, or a combination of these factors—a simple mechanical ventilator can have salutary effects only while it restores alveolar volume and improves oxygen exchange during the inhalation phase, provided, of course, that ventilatory pressures do not approach or exceed pulmonary hydrostatic pressures. During exhalation, the beneficial effects of inflation quickly dissipate, especially if alveolar volume is allowed to return to its starting point.
In fact, opening alveoli during inhalation and allowing them to close again during exhalation may exacerbate the problem. It seems that when alveoli collapse, surfactant activity is lost. There are two putative theories to explain this: first, surfactant molecules are forced into close proximity during collapse; ultimately they collide and clump together (9,10); and/or second, surfactant is forced up into the airways during alveolar collapse (11)—once in the airways, surfactant is either damaged or removed by ciliary action.
Positive End-expiratory Pressure (PEEP)
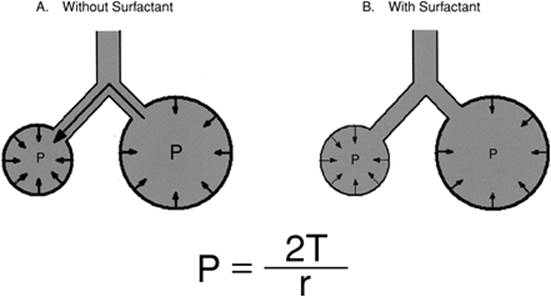
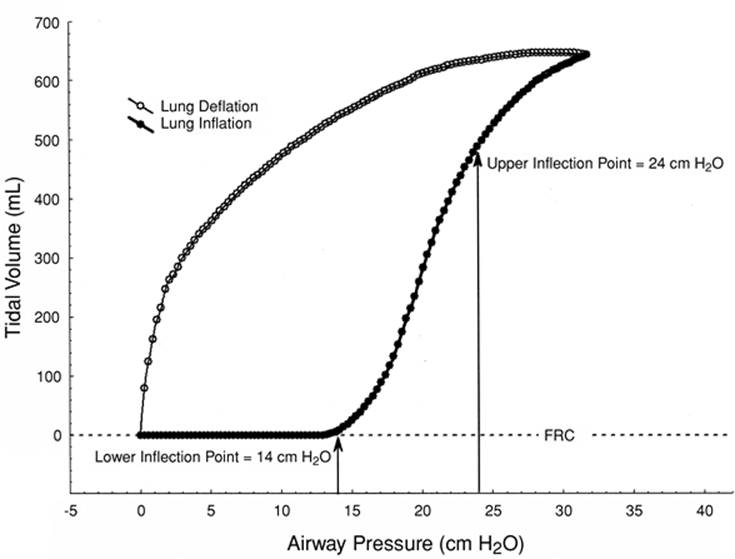
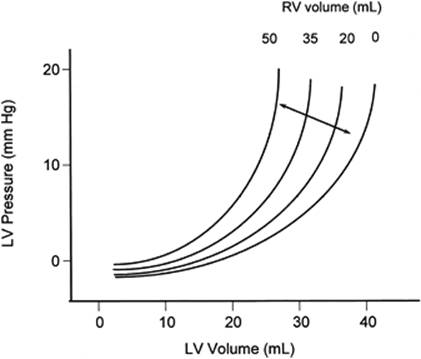
Reduced levels of surfactant, such as occur during ARDS, lead to widespread atelectasis and hypoxemia; these conditions respond poorly to mechanical ventilation alone. The law of Laplace states that pressure inside a spherical structure is directly proportional to tension in that structure's wall and inversely proportional to its radius. Normally, alveolar surface forces, at alveolar-capillary membranes, are essentially identical. Laplace's law dictates that a loss of surfactant means a greater pressure is required to keep smaller alveoli open (Fig. 128.4). When this occurs, smaller alveoli empty into larger ones, eventually collapsing. A plot of the lung's pressure–volume relationship during ARDS helps to better visualize this phenomenon (Fig. 128.5). Without adequate surfactant, significant portions of the lungs collapse at end-exhalation. During inhalation, as pressure is applied to the airways (x-axis, Fig. 128.5), nothing initially happens. However, when the applied pressure reaches sufficient magnitude, in this instance 14 cm H2O, some of the collapsed alveoli start to open and gas begins entering the lungs. This “opening” pressure is commonly referred to as the lower inflection point (Fig. 128.5) and provides the theoretical underpinnings for the use of PEEP; that is, an ARDS-related surfactant deficiency predisposes to alveolar collapse unless counteracted by force. Clinically, the easiest way to accomplish this goal is by maintaining PEEP, preferably somewhat above the lower inflection point (12). Since the therapeutic objective is to prevent alveolar collapse—that is, to keep the alveoli open—the approach is often referred to as the open lung approach (13,14).
|
|
|
Figure 128.4. Laplace's law and its effect on alveoli. Laplace's law states that pressure (P) inside a sphere is directly proportional to the tension in the walls (T) and inversely proportional to the sphere's radius (r). A: Without surfactant. Wall or surface tension in both large and small alveoli is about the same. As a result, a greater pressure develops in the smaller alveolus, which then proceeds to empty into adjacent larger alveoli. B: With surfactant. The surface tension–reducing properties of surfactant increase as individual surfactant molecules get closer together. This property counteracts Laplace's law and reduces the tendency for small alveoli to empty into nearby larger alveoli. |
|
|
|
Figure 128.5. Inflation and deflation characteristics in the surfactant-deficient lung. Surfactant-deficient alveoli generally remain open throughout exhalation (open circles); at end-exhalation, unstable alveoli empty into adjacent larger alveoli and collapse, significantly reducing functional residual capacity (FRC). Furthermore, once collapsed, alveoli tend to stay collapsed until a relatively high pressure is applied. In this idealized example, airway pressure is steadily increased to inflate the lungs (solid circles). Note that airway pressure reaches 14 cm H2O before any measurable volume enters the lungs; at this point (lower inflection point), collapsed alveoli begin to open, the lungs begin to accept volume, and the pressure–volume curve changes slope upward. Alveoli continue to open, those already open expand, and airway pressure continues to rise until the average patent alveoli begin to approach their maximum volume. At this point, the pressure–volume curve flattens; in other words, from this point on, larger changes in pressure will be required to produce a complementary change in volume. This slope change is referred to as the upper inflection point. Although the pressure–volume curve may be difficult to measure at the bedside, avoiding ventilator-induced lung injury likely requires that all mechanical ventilation occur between the upper and lower inflection points; that is, patient airway pressure should not be allowed above the upper inflection point or below the lower inflection point. |
Combining mechanical ventilation and PEEP usually decreases shunt and improves oxygenation (15,16,17,18), often significantly; nevertheless, ARDS mortality rates have to improve. The reasons for this are complex, but theories for these failures are starting to emerge (19). It now appears that, to reduce ARDS-associated morbidity and mortality, we must avoid the risks associated with both low-volume (4,5,6,7) and high-volume (1,2,3) lung injury. To this end, all tidal ventilation must occur between the lower and upper inflection points (19). It sounds easy, but bedside determination of inflection points is difficult; nevertheless, it is worth the effort.
To date, a universally agreed on ventilatory approach, or mode, for managing critically ill patients has failed to emerge. Considering the wide variety of conditions ameliorated by mechanical ventilation, and the extreme range of severity between patients with the same problem, a single, always best approach may not exist. Clinicians, therefore, must understand and recognize the potential and limitations of their favored approaches.
Ventilator Classification
Positive versus Negative Pressure
Today, virtually all ventilators function by providing some variant of positive pressure. Yet, during the polio epidemic, “iron lungs” or negative pressure ventilators were in common use. Negative pressure devices require that the patient's body be tightly enclosed within a tube or box while the head remains outside. Once the patient is sealed inside, a pump or bellows evacuates gas from inside the box; this creates a negative pressure around the patient's thorax, making atmospheric pressure positive in relation to alveolar pressure. As a result, gas flows from the mouth to alveoli, trying to equalize the pressure difference. Since this process is nearly identical to normal breathing, negative pressure ventilators tend to provide better VA/Q ratios (20) and produce less interference with cardiac output (21) than positive pressure counterparts. Nevertheless, these devices quickly lost favor for several compelling reasons: (a) iron lungs are very large and difficult to move; (b) maintaining an airtight seal around the patient's neck, without irritation, is nearly impossible; (c) personnel responsible for providing patient monitoring and routine care could not easily access important areas of their patient's body.
Controlled versus Assisted Breaths
Although modern ICU ventilators offer many different operational modes, from the patient's standpoint, only two breath types remain: controlled (mechanical or mandated) and assisted-spontaneous. Controlled breaths, used during controlled mechanical ventilation (CMV), are completely defined by the attending clinician. Controlled breaths are always delivered on schedule and without regard for the patient. For this reason, clinicians favoring CMV must hyperventilate (to suppress respiration), heavily sedate, or even paralyze their patients to avoid patient–ventilator interface complications. From another perspective, CMV strategies should replace 100% of a patient's work of breathing (WOB). Patients allowed to breathe spontaneously during CMV frequently end up out of phase with the ventilator—that is, attempting to breathe when the ventilator is not in the inspiratory phase. Also known as dyssynchrony, out of phase breathing during CMV produces very high patient WOB (22). Assisted-spontaneous breathing strategies involve a work-sharing approach between patient and ventilator (23). Theoretically speaking, a work-sharing approach makes perfect sense; ideally, the ventilator functions to “unload” the WOB the patient cannot tolerate. Critically ill patients face an above-normal workload, primarily from their pulmonary disease process, and secondarily, from their artificial breathing apparatus, including the endotracheal tube (ET), breathing circuits, humidifiers, and the ventilator (24,25). Unfortunately, there is a fatal flaw in the ventilator–patient work-sharing concept: until recently (26) we have not been able to find a reliable, readily available, easy-to-perform, and noninvasive methodology for determining just how much WOB our patients can actually tolerate (27,28,29), and this determination is absolutely crucial. If the ventilator off-loads too much work, the patient's respiratory muscles are predisposed to atrophy. If the ventilator provides insufficient support, fatigue is likely. Either scenario can add unnecessary days, or even weeks, to the period of time patients require ventilatory support. Fatigued or weak patients make poor candidates for weaning and attempts at liberation from the ventilator; moreover, the risk for developing ventilator-associated pneumonia (VAP) correlates directly to the time spent on ventilatory support (30). For some, these concepts imply that hyperventilation, sedation, and paralysis predispose to atrophy, and that CMV should be used with extreme caution. Research suggests that the diaphragm, which evolved to contract without interruption from birth until death, begins to loose contractility shortly after initiating CMV (31); the loss of contractility is time dependent and continues to worsen as mechanical ventilation is prolonged (31).
Ventilator Breaths—Defining Characteristics
The idea of trying to classify each ventilator type, to better understand how specific ventilators interact with and affect physiology, remains as common a goal today as ever. Yet, today's ventilators include so many modes and options, they are nearly impossible to classify. For a time, some tried to classify ventilator modes (32), but even this strategy is no longer reliable because many ventilators now incorporate dual-mode capabilities—the ability to switch modes within an individual ventilator breath.
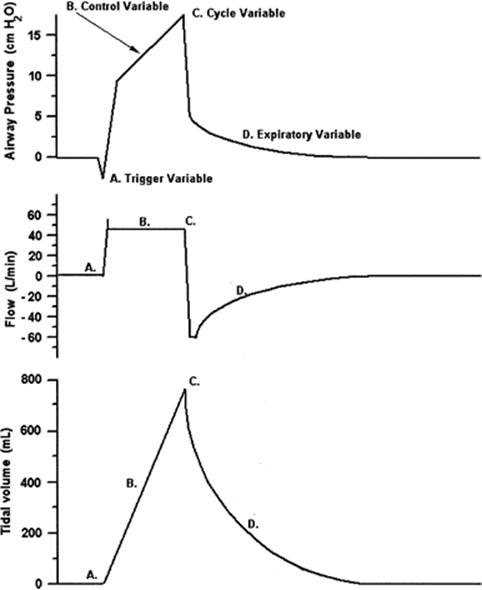
Instead of trying to classify ventilators, modes, or even submodes, it may be easier to develop and use a standardized set of terms and describe the breath types in use. This is possible since, regardless of ventilator or breath type, all ventilator breaths are delivered in four distinct phases or variables (Fig. 128.6).
Phase or Control Variables
Each ventilator breath must begin for some reason and at some specific moment in time. The physical change that initiates a breath is known as the trigger variable (labeled A, Fig. 128.6). Once a breath is triggered “on,” the ventilator must somehow precisely manage how gas is forced into the patient's lungs; the physical characteristic managed during lung inflation is the control variable (labeled B, Fig. 128.6). After delivering the prescribed volume or pressure, inflation must end. This physical change responsible for ending inflation is called the cycle variable, or cycling (labeled C, Fig. 128.6). Immediately following inhalation is exhalation, or the exhalation variable (labeled D, Fig. 128.6). Unlike the previous three variables, use of an exhalation variable is optional.
|
|
|
Figure 128.6. Pressure, flow, and volume curves for a mechanical ventilator breath. (A) The trigger variable is the physical characteristic used by the ventilator to initiate a mechanical inflation of the lungs. In this case, pressure falls before the breath starts; the represented ventilator breath is likely pressure triggered. (B) Control variable. For patient safety, the ventilator must precisely control an important aspect involved with inflating the patient's lungs. For this breath, flow is held constant; the ventilator is described as flow controlled. (C) Cycle variable. Each mechanical breath must end such that the lungs are properly filled and then allow the patient to exhale. The physical characteristic that determines appropriate lung filling is the cycle variable. This example shows that the breath ending after the control variable (flow) has continued for a specific interval of time; this ventilator is time cycled. (D) Expiratory variable. Modern ventilators either control pressure during exhalation or they do not. In this example, pressure returns to ambient (0 cm H2O), so this ventilator has no operative expiratory variable. |
In early attempts at ventilator classification, author(s) often used the term “cycling” for both breath initiation and termination. Do not confuse the breath initiation, triggering, with breath termination, cycling; the ambiguous use of the term cycling continues to produce confusion.
All ventilators systematically change the pressure, flow, and volume with respect to time (Fig. 128.6). Thus, when characterizing any of the four phase variables, pressure, flow, volume, or time are the only possible physical characteristics a ventilator could change or control during any phase of the respiratory cycle (Table 128.1). It is also important to note that although some of these characteristics correlate and may change jointly, in direction and magnitude, they do not always do so. The practical side of this translates into an important tenet: ventilators can control only one characteristic at a time. This does not, however, preclude using multiple characteristics, provided they are used in a logical sequence, and one at a time.
Trigger Variable
Ventilators are triggered “on” by time, pressure, flow, or volume. Today's ventilators, however, often depend on multiple trigger variables used sequentially. For example, with a trigger sensitivity set for 2 (actually, -2 cm H2O), breath rate set to ten breaths per minute (bpm) and in the CMV mode, this ventilator has at least two trigger variables. First, breaths may be pressure-triggered when the ventilator is in the expiratory phase and baseline airway pressure is reduced by 2 cm H2O or more. If, however, the patient makes no attempt to breathe, the CMV rate timer count reaches zero and a time-triggered breath results—exactly 6 seconds (s) after the last ventilator breath. This mode is known as assist-control (A/C), because patients can assist as often as they like, but if they stop breathing (assisting), the ventilator reverts to the predefined CMV rate. Another way ventilators employ multiple trigger variables is by using two sensors, for instance pressure and flow; triggering occurs in response to the variable's threshold (pressure or flow) that is breached first.
Control Variable
Once a breath is triggered “on,” patient safety cannot be ensured unless the delivery of gas into the lungs is precisely controlled. Of the four potential physical changes (Table 128.1), only pressure and floware used to any extent. Flow is emphasized to underscore an engineering issue: volume-controlled ventilators are actually flow controlled. There are several reasons: First, the integral of flow, with respect to time, is volume. Therefore, precisely controlling inspiratory flow (VI) for a preset inspiratory time (TI) produces an exact tidal volume (VT) based on the following equation:
|
Table 128.1 Ventilator Breath Classification |
||||||||||||||||||
|
||||||||||||||||||
![]()
Algebraically speaking, the operator can preset only two of these variables, in this case VI and TI; the third variable (VT) cannot be preset because it is a consequence of VI and TI. Given a choice, however, most clinicians prefer to preset the VI and VT; in this situation, TI becomes the consequential or resultant variable. In an effort to obviate this preference, most of today's ventilators use an algebraic variant of equation 1:
![]()
This design allows operators to preset VT and VI. Furthermore, since the operator actually predefines VT— referring to the ventilator as a volume controller, or as volume-controlled ventilation (VCV)—this is perfectly acceptable; this nomenclature will be used henceforth.
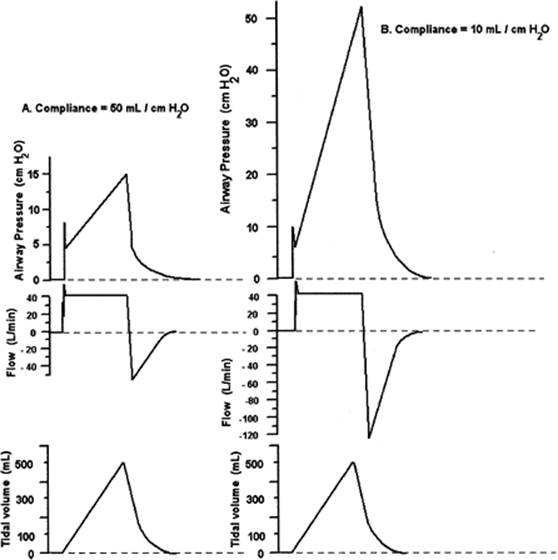
Volume-controlled strategies differ markedly from pressure-controlled ventilation (PCV). When we opt for VCV, our priorities are clear: we wish to prescribe (preset) VT, VI, and flow pattern. If we want these parameters reliably delivered, then airway pressure (Paw) must not be restricted. When Paw is allowed to vary, VT, VI, and flow pattern are delivered, regardless of the patient's pulmonary mechanics (Fig. 128.7). High peak inflation pressures (PIP) are a concern, so ventilators allow clinicians to preset a maximum safe level of Paw; this setting, referred to as a high-pressure limit, functions as a cycle variable—that is, ending inspiration (or diverting gas flow) the moment Paw violates the established threshold. Keep in mind, though, cycling via a high-pressure limit truncates breath delivery, negates volume control, and reduces VT.
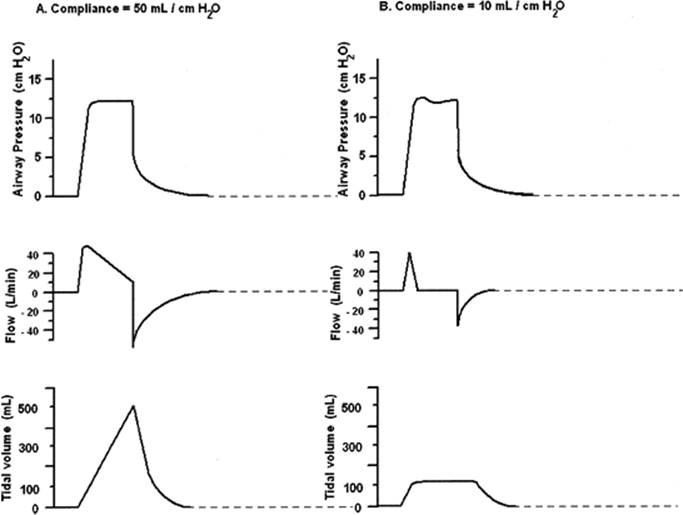
Pressure-controlled strategies allow us to preset a desired Paw and TI; conversely, VT, VI, and flow waveform cannot be predetermined. Pressure-controlled breaths always generate an exponentially decelerating flow pattern; the individual's CRS and Raw determine the magnitude of VI and VT (Fig. 128.8) (33,34). Inasmuch as PCV does not control VT, and preset pressure never varies, clinicians must ensure that PCV is carefully monitored; always carefully set low/high VT alarms (if available), as well as low/high minute ventilation alarms.
Cycle Variable
All four physical changes are commonly used for cycling ventilator breaths. Pressure cycling is common during intermittent positive pressure breathing (IPPB); flow cycling predominates during pressure support ventilation (PSV); and either time or volume is common during VCV. Without question, time is the most commonly used cycle variable, particularly if one remembers that with today's VCVs, cycling occurs when TI lapses, not in response to volume.
Expiratory Variable
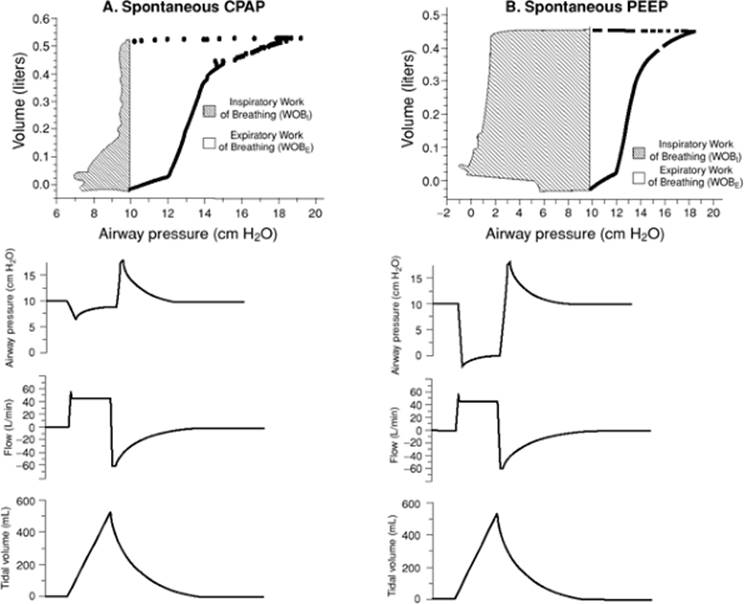
The expiratory phase is the least varied of the four; attempts at manipulating the expiratory phase variable have met with little success. Varying flow resistance (retard), negative end-expiratory pressure (NEEP), and PEEP have all been thoroughly tried and discarded. Compelling evidence, however, substantiates using continuous positive airway pressure (CPAP) and PEEP to restore or increase functional residual capacity (FRC) (35,36,37), reduce shunt and improve oxygenation (15,16,17,18), and reduce WOB (38).
Classifying Breaths
The four phase variables provide us with a method for classifying ventilator breaths that is easy to use and understand.
It makes sense to classify by breath behavior because today's ventilators offer so many breath types. For instance, the breath depicted in Figure 128.6 is pressure-triggered, volume-controlled, and time or volume cycled; there is no exhalation phase variable. In Figures 128.7 and 128.8, the breaths are time triggered, volume controlled, and time or volume cycled; and time triggered, pressure controlled, and time cycled, respectively. Some ventilator modes like intermittent mandatory ventilation (IMV) or synchronized IMV (SIMV) allow two different breath types. Mandated breaths might be time triggered, volume controlled, and time cycled, whereas between scheduled breaths, spontaneous breaths might be pressure triggered, pressure controlled, and pressure cycled.
|
|
|
Figure 128.7. Response of volume-controlled ventilation (VCV) to a sudden change in respiratory system compliance (CRS). A: Compliance = 50 mL/cm H2O. An airway pressure, flow, and tidal volume curve for a patient with this CRS and receiving VCV. B: Compliance = 10 mL/cm H2O. An airway pressure, flow, and tidal volume curve for the same patient as shown in A except that the patient's CRS is acutely reduced. Note that volume and flow are essentially unaffected, but airway pressure is dramatically elevated as the ventilator required far more pressure to provide the same flow and volume into the much stiffer lungs. |
Ventilator Design
Modern ICU ventilators are expensive and seemingly complex; yet, although the electronics may be complicated, the basic ventilator component configuration is simple and has changed very little over the last 20 years. In its simplest form, a mechanical ventilator requires only a few essential components (Fig. 128.9).
Power Sources
Pneumatics
Ventilators must have power. Most patients require at least some oxygen; this makes the energy stored within compressed oxygen a reliable and convenient power source. Gas-powered ventilators are called pneumatic. The powering gas source can be oxygen or compressed air, as long as the gas source is free of contaminants and debris and is dry. Hospital oxygen supplies virtually never pose contamination or water concerns; whether in bulk form or in cylinders, oxygen is certified clean and pure (99.99%). Compressed air sources are, however, a completely different matter. Compressors aspirate air from the environment; if aspirated air is contaminated, so too will be the compressed air. There have been instances of hospitals locating compressor intakes too close to parking lots and, on occasion, compressing exhaust gases along with air. Also, environmental air contains water vapor, some of which condenses and becomes liquid during the compression process; any and all water must be removed or it can cause serious damage to ventilators and other pneumatic equipment. Finally, most compressors use rapidly moving pistons or rotors to compress the air; operating at such high speed requires lubrication. Compressed air, for human consumption, should never involve using an oil-lubricated device. Small oil particles are compressed along with the air and can cause serious lung injury if inhaled.
Despite potential drawbacks associated with using compressed air sources, pneumatic ventilators offer several advantages, particularly when used for transport. For instance, pneumatic ventilators are always ready to go; they never require time-consuming recharging as battery-powered units do. Moreover, pneumatic ventilators use no expensive batteries, power supplies, or electric cables that can fail or must be periodically replaced. Furthermore, batteries often contain extremely toxic components—lead, cadmium, lithium, and so forth—and must be properly disposed of or recycled, often at hospital expense. Pneumatic ventilators are also exceptionally robust; many pneumatic components will operate through many millions of actuations without failure. They are also reasonably priced and easy to maintain.
|
|
|
Figure 128.8. Response of pressure-controlled ventilation (PCV) to a sudden change in respiratory system compliance (CRS). A: Compliance = 50 mL/cm H2O. An airway pressure, flow, and tidal volume curve for a patient with this CRS and receiving PCV. B: Compliance = 10 mL/cm H2O. An airway pressure, flow, and tidal volume curve for the same patient as shown in panel A, except the patient's CRSis acutely reduced. Note pressure is essentially unaffected, but flow and volume are dramatically reduced as the far stiffer lungs respond to the same airway pressure with less flow and volume. |
|
|
|
Figure 128.9. Schema of a basic ventilator. This schematic includes all of the major components necessary for ventilator operation. The logic component provides timing signals responsible for the inspiratory and expiratory phases. Ventilator logic must also synchronize the onset of each breath by the closing of the exhalation valve. Ventilator logic may be provided by fluidics, analog electronics, digital electronics (microprocessors), or pneumatics. All ventilators, regardless of simplicity, are either electrically powered (with or without battery backup) or pneumatically powered. None so far are powered by both modes. |
Electric Power
Electricity is cheap, reliable, and, in most countries, virtually ubiquitous. As a result, electricity powers most ventilators. Electrically powered units use alternating current (AC), AC converted to direct current (DC), battery, or some combination (Fig. 128.9). Unfortunately, ventilators are either pneumatically or electrically powered, never both. As a result, if power outages are likely, clinicians must consider their alternatives carefully; ventilators with battery backup are great, but will only operate for, at best, a few hours. Few if any of us have considered how ventilator-dependent patients would be ventilated in the event of an extended loss of electricity. This point is not simply a theoretical one, as just such a scenario occurred following Hurricane Katrina (39).
Conventional Ventilator Logic
All ventilators require some sort of logic to coordinate the timing of inhalation (I) and exhalation (E), as well as actuating the flow/volume delivery mechanism and the exhalation valve (Fig. 128.9).
Traditionally, ventilator logic involved pneumatics, standard electronics, fluidics, or some combination of these. To initiate and maintain inhalation, logic signals simultaneously activate both the flow/volume delivery system and the exhalation valve. At the same time, ventilator logic is responsible for timing or controlling inhalation and for monitoring breath delivery; the ventilator's logic must be prepared to cycle the breath “off” if the high Paw limit is breached or when cycling criteria is met.
Microprocessor-controlled Logic
The first microprocessor-controlled ventilator was introduced in the early 1980s. Today, microprocessor-controlled logic dominates virtually every category of mechanical ventilation. Given that a microprocessor, or central processing unit (CPU), has virtually no influence on ventilator performance per se, it is not unreasonable to wonder why microprocessor ventilators are so popular. The answer is, in a nutshell, that they are far more flexible and vastly safer than any other type of ventilator. Some of the many advantages offered by today's CPU-controlled ventilators are listed in Table 128.2.
Relational Logic
An advantage offered only by a CPU is an ability to answer relational questions. A CPU can easily evaluate the “truth” of simple relational expressions such as the following: Is x < y?, x = y?, or is x > y?. A relational question can either be true or false. For instance, x might be the patient's Paw and y the operator-selected high-pressure limit. During each breath, the CPU could be instructed to evaluate, every few milliseconds, the relational expression Is x > y? If the answer is false, then the ventilator breath continues; if the answer is true, then the breath would be cycled “off” and the overpressure alarms sounded and/or illuminated. Modern CPUs evaluate simple expressions with blinding speed. In fact, microprocessor-controlled ventilators evaluate dozens of relational expressions—in a specific sequence, continuously—until each mechanical breath is safely delivered.
Logical Expressions
Microprocessors can also evaluate logical expressions or operate on the results of a relational question; logical operations follow the rules of Boolean algebra. For example, NOT true is false and NOT false is true. The AND function operates on two relational questions and requires that they both be true for the result to be true. That is, true AND true is true, but true AND false is false. The OR function also operates on two relational questions but requires only one of the questions to be true for the result to be true; true OR false is true, but false OR false is false.
As an example, a CPU might evaluate the following two questions: Is exhaled VT less than inhaled VT, divided by 2?, AND is the operator setting for VT unchanged? If answered true AND true, then the ventilator might be instructed to warn clinicians of a low exhaled VT; from there, the patient's breathing circuit and ET cuff could then be quickly checked for leaks. With these simple building blocks, powerful algorithms can be devised that monitor all aspects of ventilator operations and make today's mechanical ventilators safer than ever before.
Computer Memory
A CPU, no matter how powerful or fast, cannot function without memory. How could a CPU answer the relational question, Is x (Paw) greater than y (airway pressure limit)? if it couldn't remember the value of y? Additionally, how would a CPU know when, or how often, to answer relational questions?
In our example, the value for x (Paw) varies continuously as a function of time, whereas the value for y (airway pressure limit) may remain constant; on the other hand, y will most likely vary from one patient to the next. Somehow, the CPU must be able to update the values for x and y as often as they change. This requires easily erasable memory, known as random-access memory (RAM). There is a caveat, however—easily erased means volatile and volatile means easily lost. For instance, valuable data might be lost the instant power is lost. As a result, ventilator CPUs cannot operate safely without battery backup to maintain critical data stored in RAM; without a patient's exact data safely stored, the ventilator could malfunction, even if power was lost for an instant. Data stored in RAM is bidirectional; this means the CPU can store (write) information into RAM and read it later. Memory is limited, so the CPU must use its memory over and over again. Suppose the area used for storing a patient's pressure limit (y) is already “occupied” and the operator changes the pressure limit; the CPU simply “writes over”—thereby erasing, the pre-existing pressure limit value.
Instructions how to use data stored in RAM and the sequence and timing of all functions carried out by the CPU reside in a different type of memory on known as read-only memory (ROM). This form of memory is nonvolatile and not easily altered. It is this memory that cues the CPU as to how often and when to evaluate the relational and logical operations. In fact, the entire sequence, or code, responsible for every conceivable ventilator function is stored in ROM. The use of ROM comes with a caveat too: ROM is nonvolatile, but it is not impervious. Even the slightest change in a critical instruction could harm a patient. As a result, ventilator CPUs must have powerful “watchdog” systems that constantly evaluate every aspect of their behavior. Watchdogs always err on the side of safety—should they detect anything out of the ordinary, they immediately terminate CPU operation, protect the patient, and alert the operator of the malfunction—often referred to as a vent-inop. Once a bizarre or unusual behavior has been detected, manufacturers ensure that CPU integrity is verified before the ventilator will function again. Unfortunately, too often vent-inop conditions require technical assistance from a biomedical engineer or factory representative. To obviate such problems, engineers have tried two, or even three, CPUs, which are programmed to constantly evaluate each other. This strategy eliminates the need for watchdogs but, in the case of only two CPUs, does not eliminate the problem; when one CPU detects a problem, who decides which CPU is still functioning properly? With a three-CPU design, there is always a “referee”; the aberrant CPU, once detected, can be shut off leaving two CPUs to continue safely operating the ventilator until it can be safely replaced.
|
Table 128.2 Advantages of Microprocessor-controlled Ventilators |
|||||||||||
|
Ventilator Control Systems
Open Loop Control
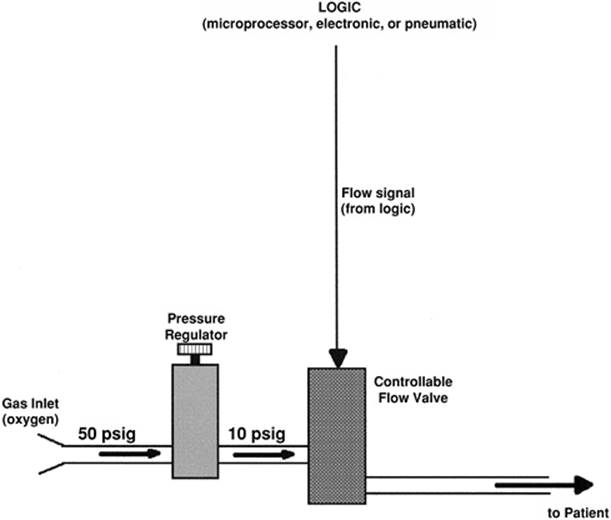
Open loop ventilator designs (Fig. 128.10) are economical and straightforward but functionally limited. Ventilators using open loops offer VCV or PCV; they seldom provide both. Open loop systems are also not fault tolerant. For instance, suppose over time and with prolonged usage, a ventilator's flow valve gradually drifts out of calibration. Now, consider that the signal designed to produce 0.75 L/s yields only 0.60 L/s, and VT is preset to 0.75 L. This patient will receive a VT no greater than 0.6 L, and the ventilator, even if CPU controlled, would have no way of detecting this problem.
|
|
|
Figure 128.10. Schema of open loop ventilator control. Virtually all positive pressure ventilators control flow (shown) or pressure during each mechanical breath. The simplest control system involves a properly synchronized signal from the logic element that produces the output (flow); the ventilator does not verify accuracy, so the operator must do so. |
Closed Loop Control
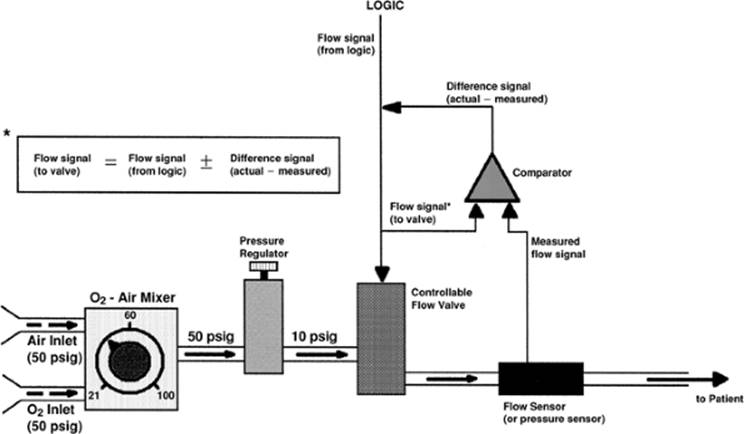
Closed loop, or feedback, designs (Fig. 128.11) are far more complex and expensive than open loop designs. In return, they deliver exceptional accuracy and automatically correct for many common failures and variances. Using the same preset VT of 0.75 L and VI of 0.75 L/s, a closed loop ventilator delivers the requested VT even if the flow valve is no longer calibrated, thereby protecting the patient. Given the example above, ventilator logic opens the flow valve, expecting 0.75 L/s; yet, a flow sensor, located just downstream from the flow valve, measures the actual flow (0.6 L/s) and sends an electric signal—proportional to measured flow—to the comparator (Fig. 128.11). The comparator functions to analyze (electrically) the difference between the measured flow and actuating signals; if the signals are identical, nothing happens; if the signals vary, the comparator provides an output signal proportional in magnitude to the difference. The comparator's output adds to, or removes from, the existing signal actuating the valve—in this case, the combined signals open the valve to produce a higher flow. Comparators function nearly instantaneously, so the flow valve's output can be corrected repeatedly, as often as the valve's response time and the programmed TI allow. A response time of 10 ms allows 100 corrections in a TI of 1 second, if necessary.
Closed loop feedback also corrects the ventilator outputs when affected by changing pulmonary impedance, different breathing circuits, and high-resistance humidifiers. Closed loop designs that incorporate flow and pressure sensors do not require separate valves for VCV and PCV. In this instance, a flow valve is either opened and a prescribed VT delivered, or the valve is opened to provide an initial high flow, and a closed loop pressure algorithm maintains any desired target pressure by manipulating the valve's output flow based on the target pressure.
Closed loop designs require accurate onboard flow and pressure sensors as well as sophisticated control algorithms; these are relatively costly and can be damaged by rough handling. For these reasons, transport ventilators often incorporate open loop designs.
Microprocessors and Closed Loop Control
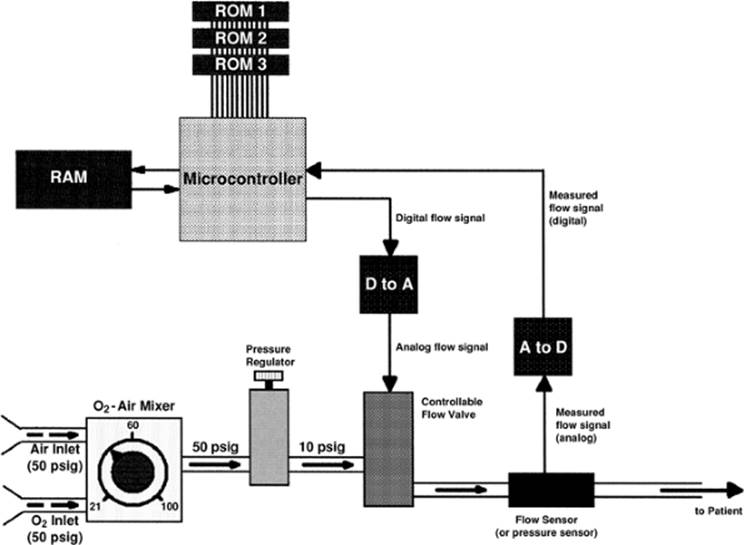
The first CPU-powered ventilators were too slow to perform all of the tasks involved in operating the ventilator and provide the corrected signals required for closed loop control. To maintain accuracy and speed, the first generation of CPU-powered ventilators combined digital logic with analog, closed loop control systems. In contrast, today's CPUs perform billions of operations per second, leaving adequate time for the CPU to provide “corrected” signals necessary for closed loop control (Fig. 128.12).
Microprocessors operate using digital (D) signals, but most of our real-world hardware (valves, sensors, transducers) require analog (A) signals. It follows that for a CPU to actuate a valve, a digital signal from the CPU must first be converted to analog; this takes place in a D-to-A signal processing chip (Fig. 128.12). Analog information, such as measured flow signals, must be similarly converted A to D before the CPU can use them. During closed loop control, once a measured signal is converted A to D and reaches the CPU, it is compared to the current actuating signal. Based on the difference, the CPU computes a new actuating signal; its digital representation is sent to the D to A, and from there, it proceeds to replace the existing signal. As each of these transformations take time, it is easy to see why early CPUs did not have sufficient speed to provide closed loop corrections. The state-of-the-art CPUs are so fast, digital control rivals that of analog comparators for controlling closed loop systems.
|
|
|
Figure 128.11. Schema of closed loop ventilator control. Ventilator reliability and accuracy is vastly improved by measuring the actual output (flow), comparing the measured to desired, and correcting the actuating signal by the difference. At the onset of each breath, a signal from the ventilator's logic actuates (opens) the output valve. The resultant output (flow) is measured immediately by a flow sensor positioned downstream. The flow sensor converts measured gas flow into an analog electric signal, which is routed to one side of an electronic comparator. The actuating signal (actual) from the logic element is fed into the other side of the comparator, where it is compared to the measured signal. If the two signals differ, the comparator adds (or subtracts) an amount of electricity proportional to the signal difference to (or from) the actuating signal. The entire loop requires only about 10 msec to complete; that means the actual signal could theoretically be corrected as many as 100 times in a typical mechanical breath lasting just 1 sec. Normally, however, it requires only a few iterations before the measured and desired signals are identical. |
Conventional Mechanical Ventilatory Techniques
Compliance and Resistance—The End-inspiratory Plateau
Operational Principles
The terms postinflation hold, end-inspiratory pause, and end-inspiratory plateau (EIP) all refer to the same ventilator routine; the instant VT delivery is complete, the ventilator stops gas flow but does not allow the patient to exhale until a specified period of time, the EIP, elapses (Fig. 128.13). The EIP is considered part of TI because the VT volume remains in the lungs and the patient does not exhale until the EIP is complete; ventilators often allow plateaus as long as 2 seconds. Although this may not seem excessive, when combined with the existing TI, EIPs are often long enough to adversely impact hemodynamics and are poorly tolerated by spontaneously breathing patients.
Clinical Applications
An end-inspiratory plateau has been advocated as a method to improve the distribution of inhaled gases, thereby decreasing VD/VT and PaCO2 (40). Theoretically, this makes sense; if inhalation was long enough, gas redistribution into slow-filling spaces would improve overall distribution (41). Gas redistribution during EIP is thought to result secondary to collateral ventilation and Pendelluft flow.
Collateral ventilation occurs when gas enters the alveoli from adjacent alveoli through channels in the alveolar walls (pores of Kohn) or through cross-communications between bronchioles (Lambert canals). Pendelluft flow occurs when, during EIP, volume from fast-filling spaces redistributes into slow-filling spaces. Such gas flow is caused by regional pressure gradients that arise as a consequence of maldistribution secondary to positive pressure inflation.
|
|
|
Figure 128.12. Schema of a microprocessor-controlled closed loop control system. First-generation microprocessor-controlled ventilators combined digital (D) signals converted to analog (A) with an analog closed loop system. This approach was necessary because digital control of closed loop feedback added several time-consuming steps: corrected signals had to be converted D to A before they could operate ventilator valves, and the measured signal had to be converted A to D before the microprocessor could compare it to desired and determine an appropriate correction. Unfortunately, microprocessors available at the time were simply not fast enough to adequately monitor lung inflation and provide corrected closed loop signals. Today's microprocessors easily perform billions of operations per second, and most second- or third-generation microprocessor-controlled ventilators provide closed loop control using only digital signal processing. |
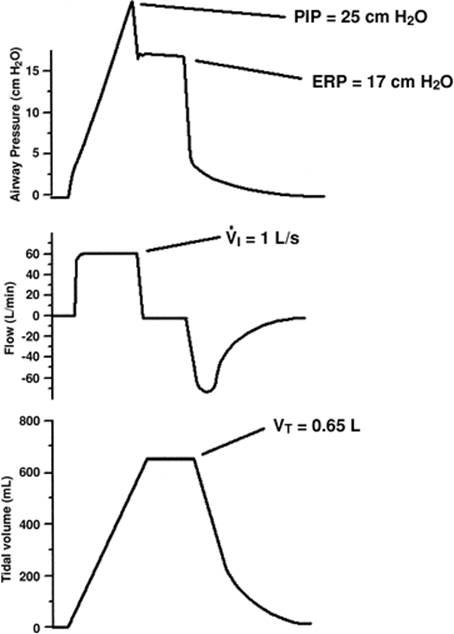
The EIP is seldom used to improve distribution, but rather to determine CRS and Raw. During the plateau time, as gas flow ceases, the flow-resistive component of PIP disappears. The remaining pressure—the plateau pressure—also reflects the static elastic recoil pressure (ERP) of the lungs. Exhaled VT, PIP, and ERP are used in determining the patient's CRS and Raw (Table 128.3). These measurements are often performed routinely to assess the patient's progress or to gauge the response to bronchodilators.
Inspiratory Flow Waveforms
Before the advent of microprocessor-powered ventilators, different ventilator brands delivered gas flow using a wide variety of methodologies: pistons, injectors, bellows, solenoids, and so forth. Each flow-generating technique produced a different inspiratory flow pattern: square or constant (Fig. 128.14A), sinusoidal, decelerating (Fig. 128.14B), accelerating. Clinicians immediately began to wonder which waveform was best, or, could matching specific waveforms with specific pulmonary conditions make a difference? To this day, these questions remain essentially unresolved. Some tried various waveforms and found little or no difference in the distribution of ventilation (42). Other studies, modeling multiple lung compartments with different Raw, showed improved distribution with the decelerating waveform compared to others (43,44). Clinical reports confirmed the utility of a decelerating pattern (45,46,47). In one investigation, VT, TI, I:E ratio, and ventilator rate were held constant. Compared to the constant-flow pattern, the decelerating waveform significantly reduced patient PIP, PaCO2, VD/VT ratio, and alveolar-to-arterial oxygen pressure gradient P(A-a)O2 (46). However, mean Paw was significantly greater, predisposing to adverse hemodynamic effects.
|
|
||||||
|
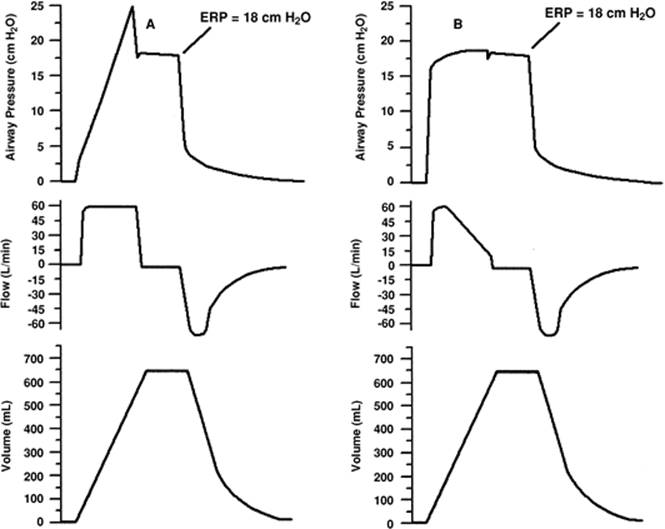
Figure 128.13. Compliance and resistance determination in the ventilator patient. Respiratory system compliance (CRS) and airway resistance (Raw) determination by end-inspiratory plateau (EIP) requires volume-controlled mode, square flow pattern, inspiratory flow rate (VI) of exactly 1 liter (L)/second (s) (or 60 L/minute), and an EIP of ≥0.25 second. In this example, the peak inflation pressure (PIP) reaches 25 cm H2O the instant flow ceases. After the preset tidal volume (VT) is delivered, the EIP begins, that is, gas flow from the ventilator ceases and the patient is not permitted to exhale. During the EIP, pressure equilibrates between the lungs and breathing circuit and elastic recoil pressure (ERP) of the lungs can be measured at the airway opening. The greater the difference between a patient's PIP and ERP, the greater the Raw. Compliance is computed by dividing VT (0.65 L) by measured ERP minus the baseline pressure (0 cm H2O), and is given in units of L/cm H2O or mL/cm H2O. Resistance is computed as PIP minus ERP divided by VI (must be 1 L/s) and is stated in units of cm H2O/L/s. In this example, CRS is 0.038 L/cm H2O and Raw is 8 cm H2O/L/s. |
||||||
|
Table 128.3 Measurement of Compliance and Airway Resistance |
||||||
|
|
|
|
Figure 128.14. Differences in peak inflation pressure (PIP) when using a square or decelerating inspiratory flow (VI) waveform. A: An airway pressure (Paw), flow, and volume curve for a typical volume-controlled breath delivered using a square VI waveform. Following breath delivery, an end-inspiratory plateau (EIP) terminates gas flow and allows pressure to equilibrate between the lungs and airway opening; at equilibration, Paw reflects the elastic recoil pressure (ERP) of the respiratory system; that is, of the lungs and thorax combined. Note that the PIP of this breath is nearly 25 cm H2O. B: An airway pressure, flow, and volume curve for the same breath, delivered to the same patient, except using a decelerating VI waveform in this instance. Again, following breath delivery, an EIP allows determination of ERP. Note that the PIP of this breath is 8 cm H2O lower than for the square waveform; nevertheless, the measured ERP (18 cm H2O) is exactly the same as that using the square flow pattern. This occurs because a decelerating flow pattern reduces gas flow to near zero (as during an EIP) before the breath cycles “off” and the EIP begins. |
In addition to the potential to improve distribution, decelerating waveforms significantly reduce PIP, especially when contrasted to square (Fig. 128.14) or accelerating patterns. Some clinicians opt for a decelerating pattern, believing the lower PIPs may help protect their patients from ventilator-induced lung injury (VILI). This logic is flawed; the pulmonary edema and lung injury, often seen during mechanical ventilation, are now believed to be the consequence of excessive volume (volutrauma) rather than excessive pressure (barotrauma) (48,49). Furthermore, the main determinant of volutrauma appears to be end-inspiratory lung volume (the overall lung distention) rather than the FRC (which depends on PEEP) (19,37). Based on this information, reducing PIP by waveform selection offers no advantage; patients supported with VCV receive the same VT, and therefore overall lung expansion, regardless of waveform (Fig. 128.14).
Inspiratory flow waveforms impact yet another aspect of mechanical ventilation: patient–ventilator synchrony. During any form of patient-triggered mechanical ventilation, the spontaneous inspiratory effort may extend well into mechanical inflation. If, at any point, spontaneous flow demand exceeds the preset VI, flow starvation results. Flow starvation distorts pressure patterns and exaggerates WOB. Decelerating flow patterns often provide initial VI spontaneous sufficient to meet patient demand; if at any point, however, VI is reduced below that the patient is demanding, flow starvation follows. Often, flow starvation of this nature can be managed by simply switching from a decelerating to a constant waveform to maintain a higher VI throughout the breath (Fig. 128.15).
Controlled Ventilation
Operational Principles
Mechanical ventilation is indicated when spontaneous ventilation is inadequate or absent. Physiologically, this means the patient is incapable of maintaining acceptable PaCO2 and arterial pH levels. CMV delivers an operator-selected breathing rate, VT, peak VI, and flow pattern; CMV operates completely independent of patient efforts to breathe (Fig. 128.16A). When patients attempt to breathe during CMV, the result can be violent patient–ventilator dyssynchrony. Consequently, patients supported by CMV often require hyperventilation to blunt the normal stimulus to breathe, heavy sedation, or even pharmacologic paralysis.
|
|
|
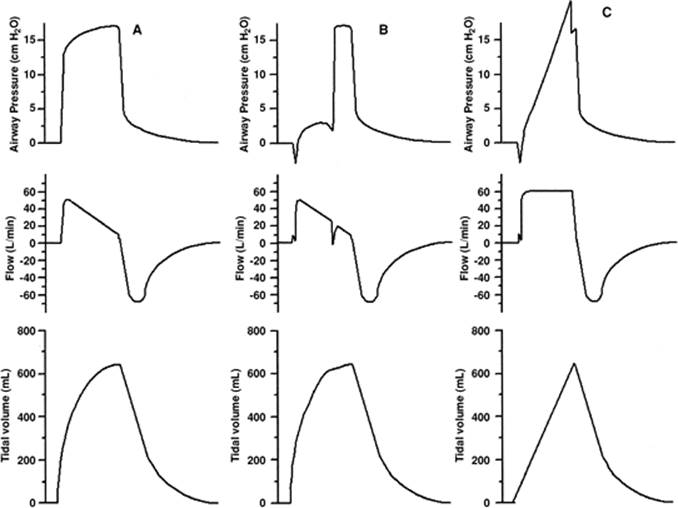
Figure 128.15. Improving patient–ventilator synchrony using a square instead of decelerating flow waveform, during volume-controlled ventilation (VCV). A: An airway pressure (Paw), flow, and tidal volume (VT) curve for a heavily sedated or very relaxed patient receiving VCV. B: An airway pressure, flow, and VT curve for the same patient, except the patient is awake, alert, and “fighting the ventilator,”; that is, attempting to breathe spontaneously during machine breaths. Note that both the Paw pressure pattern and VI pattern are distorted by the patient's effort. Distortions are often exacerbated by the selected flow pattern, particularly the decelerating pattern, which progressively reduces VI while patient flow demands may remain high. In situations where the patient flow demand exceeds VI from the ventilator, a tremendous additional workload is imposed on the patient; this predisposes to fatigue and makes managing the patient difficult. C: An airway pressure, flow, and VT curve for the same patient, making the same effort to breathe spontaneously, except the selected VI pattern is switched from decelerating to square. Note that peak VI is nearly identical in each case; yet, by maintaining a high flow longer, a square flow pattern better meets the patient flow demand. |
Clinical Applications
Indications for CMV and CMV with PEEP (Fig. 128.16B) include apnea, ARDS, central nervous system depression, drug overdose, or neuromuscular dysfunction. For this subset of patients, an accidental disconnection from the ventilator or a ventilator failure is life threatening. Thus, CMV requires vigilant monitoring and carefully set disconnect and failure-to-cycle alarms.
Patient-triggered Ventilation
Operational Principles
There are two basic forms of patient-triggered breaths: mechanical and spontaneous. Patient-triggered mechanical breaths (Fig. 128.16C) are nearly identical to CMV breaths in that the VT, peak VI, and flow pattern are all operator selected; the only difference is assisted mechanical ventilation (AMV) which requires that the patient trigger each and every breath. Thus, when supported by AMV, patients must not experience an acute apneic episode; otherwise, all ventilation ceases. Concern for this possibility explains why so few physicians opted to use AMV before ventilators came equipped with backup ventilator modes. For AMV, a backup mode might allow the operator to select desired CMV settings which the ventilator defaults to and uses in the event of apnea.
Clinical Applications
Patient-triggered ventilation is considered a vital link between CMV and extubation. In theory, it allows the patient to breathe spontaneously in preparation for removal of the ventilator. Spontaneous breathing is never consistent, however, meaning AMV is extraordinarily difficult to optimize to a patient's efforts. If the preset VI, VT, or both are too high, patient WOB falls to essentially zero; if they are insufficient or the patient becomes dyssynchronous, WOB skyrockets.
|
|
|
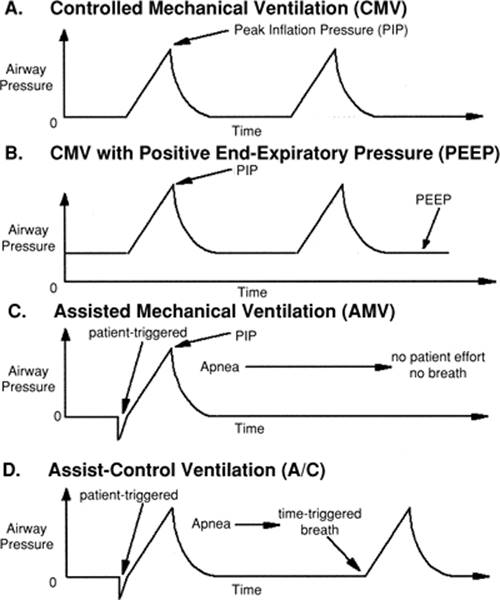
Figure 128.16. Conventional mechanical ventilatory airway pressure patterns. A: Controlled mechanical ventilation (CMV). Mechanical breath rate, tidal volume (VT), and inspiratory flow rate (VI) and pattern are all selected and set by the operator and cannot be altered appreciably by patient efforts to breathe. B: CMV with positive end-expiratory pressure (PEEP). Exhalation stops at a predetermined pressure above ambient (PEEP level). If the PEEP is adequate, it mechanically stabilizes and prevents alveolar collapse secondary to acute respiratory distress syndrome (ARDS). C:Assisted mechanical ventilation (AMV). Tidal volume and VI are prescribed and set by the operator and cannot be altered, regardless of patient effort; the patient is, however, completely responsible for determining breathing rate by physically triggering the ventilator. D: Assist-control ventilation (A/C). This mode combines AMV with a CMV backup. This is accomplished using two trigger variables (for instance, pressure and time) and initiating a breath to whichever occurs first. The operator sets VT, VI and pattern, CMV rate, and trigger sensitivity. After each breath, regardless of which variable triggered the breath, the CMV rate timing clock is restarted. At this point, if a spontaneous effort triggers a breath before the CMV timer lapses, the breath is pressure triggered and the CMV clock restarted. If the patient fails to breathe or cannot spontaneously trigger, the CMV clock will run down and the next breath will be time triggered. Using the A/C strategy, patients may breathe as rapidly as they desire, but never at a rate lower than the CMV mechanical rate setting. |
CMV Backup
The use of dual-trigger variables allowed clinicians to safely use AMV well before the incorporation of backup modes. Patient-triggered support with a time-triggered CMV backup was coined assist/controlled ventilation (A/C) (Fig. 128.16D). When using A/C, the operator sets a minimum acceptable breathing rate using the CMV rate control, and adjusts trigger sensitivity (usually pressure). As with AMV, the patient triggers breaths, as often as desired, by breaching the trigger threshold. If the patient stops breathing, however, or the spontaneous breathing rate drops below the preset minimum, time-triggered CMV intercedes until a clinician investigates or adequate breathing activity resumes.
Potential Problems
Assisted mechanical ventilation and CMV, used alone or in conjunction, predispose to hyperventilation, ventilator-induced VA/Q abnormalities, and excessive WOB. These untoward effects are related to anxiety-driven ventilator–patient dyssynchrony and maldistribution of ventilation, respectively. A disproportionate amount of the VT is delivered anteriorly to nondependent lung regions with decreased perfusion when patients are in the supine position (50). Conversely, spontaneous breathing tends to promote better VA/Q distribution. Some studies have demonstrated that VD increases during CMV and AMV, with or without PEEP (51,52) Downs and Mitchell (51) reported that increases in VD were related to the rate of mechanical breathing, regardless of the ventilatory pattern, mode, and whether or not PEEP was used.
As mentioned, ventilator-patient dyssynchrony is very common during CMV, AMV, and A/C modes of ventilation. These modes all require preset VI and flow waveforms while patient breathing patterns frequently vary. When patient flow demand exceeds that provided by the ventilator, the WOB imposed on the patient may become excessive (22). Recent trends toward smaller mechanical VTs have exacerbated the issue (53). Patients allowed to breathe spontaneously while receiving low-VT lung-protective ventilation will likely suffer from both flow and volume starvation (Fig. 128.17); the additional WOB can be enormous. Clinicians facing this situation are left with few palatable options: increasing VT and VI predispose to ventilator-induced lung injury; yet, continued sedation or paralysis will undoubtedly complicate or prolong the weaning process.
Intermittent Mandatory Ventilation
Operational Principles
With spontaneous breathing rates often >100 breaths per minute, infants with hyaline membrane disease confounded even the best early efforts at patient–ventilator synchronization. The simple concept of providing a continuous flow, from which these babies could breathe spontaneously between mandated mechanical breaths (54,55,56), resulted in a new ventilatory mode referred to as intermittent mandatory ventilation (IMV). After proving its utility on neonates, IMV was later advocated for adults, especially those difficult to wean from mechanical ventilation (57). Neonatal IMV systems provided a continuous flow of gas throughout the respiratory cycle; tidal ventilation was accomplished by simply closing the exhalation valve and diverting flow into the lungs (54,55).
|
|
|
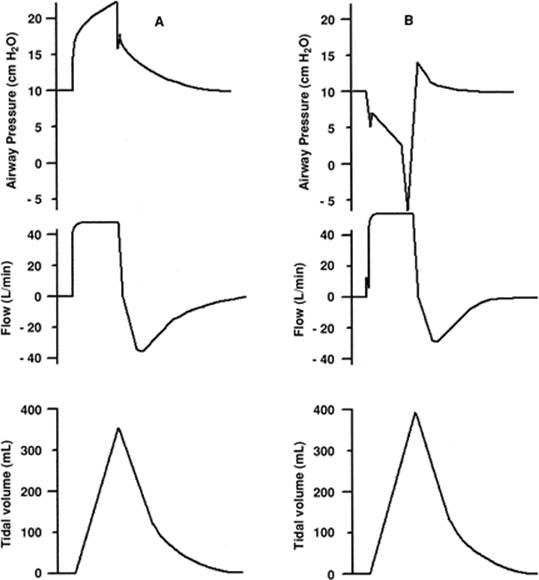
Figure 128.17. Flow and volume starvation during low tidal volume (VT) ventilation. A: An airway pressure (Paw), flow, and tidal volume (VT) curve for a heavily sedated or very relaxed patient receiving lung-protective low-VT ventilation. B: An airway pressure, flow, and VT curve for the same patient who is now awake, alert, and “fighting the ventilator.” Note that because both flow and VT are insufficient, Paw remains below baseline pressure throughout the entire inspiratory phase of the mechanical breath; distortions of this magnitude are frequently encountered if patients are allowed to breathe spontaneously when using lung-protective low-VT ventilation. |
When applying IMV, the operator preselects the desired ventilator rate, VT, VI, and flow pattern; in this aspect, it does not differ from CMV. With IMV, however, the patient breathes as often as desired between sequential positive pressure breaths. In theory, a designed and adjusted IMV system provides an unrestricted gas flow equal to or greater than the patient's peak VI demand; these conditions minimize WOB. Early IMV systems were “homemade” (58,59), leading some to opine that reported failures due to poor system design, not were to IMV, per se (60).
Clinical Applications
Most clinicians set an IMV rate sufficient to complement the patient's own spontaneous breathing and still maintain an acceptable alveolar ventilation, PaCO2, and pH. Mandated breathing rates of 4 to 6 breaths per minute were popular because they provided an adequate VA in the event of apnea. When patients with pre-existing COPD were managed with IMV and compared to others managed with patient-triggered ventilation, IMV offered better control of PaCO2 and pH (61,62). When IMV is combined with CPAP, the cardiopulmonary effects are improved compared to CMV or A/C modes of ventilation; as a result, IMV makes it possible to maintain higher mean expiratory positive pressures with fewer deleterious effects on venous return and cardiac output (63,64).
Potential Problems
IMV and CMV share many similarities, such as preset VT, VI, and flow waveform. Furthermore, with both modes, all mandated breaths are time triggered, unresponsive to any patient effort. During IMV, however, the patient breathes freely, as desired. It follows that, occasionally, a time-triggered breath might be delivered at or near end-inhalation for a spontaneous breath (breath-stacking); if the stacked volumes were large enough, they would predispose to elevated PIP, mean Paw, and cardiovascular embarrassment; without any compelling evidence validating this hypothesis, many clinicians nevertheless completely avoided IMV.
The concept of providing an unimpeded continuous gas flow equal to or exceeding the patient's peak VI introduced an unexpected consequence to developing safe and effective IMV systems: finding a humidifier capable of the task. Poulton and Downs (65) studied the issue and reported that with the exception of the Bird humidifier, the others tested either imposed significant flow resistance—which would certainly affect patient WOB—or failed to provide sufficient humidity at the high flow rates IMV often required.
Breathing spontaneously requires patient WOB; the amount of work required, however, depends on a number of physiologic and external apparatus variables such as CRS, Raw, effort required to trigger breaths (if needed), available flow to that demanded, ET size, exhalation valve performance, and the magnitude and duration of the pressure drop experienced during inhalation. Downs (60) and others (66) suggested that properly adjusted continuous-flow IMV systems minimized the apparatus portion of WOB; several studies comparing continuous-flow to demand-flow valves corroborated this theory (67,68,69). Nevertheless, continuous-flow IMV systems were never popular—they were bulky, noisy, and difficult to adequately humidify; required frequent readjustment; and wasted massive amounts of gas. Clinicians therefore prevailed on manufacturers to refine and improve their demand valves or demand-flow systems. Gradually, demand-flow system performance improved; by 1985, Katz et al. (70) reported comparing seven demand-flow CPAP systems against a continuous-flow system (at 60 L/minute) and reported that some demand-flow systems performed as well or better than the continuous-flow system.
Synchronized Intermittent Mandatory Ventilation
Operational Principles
Clinical concerns about the potential for breath-stacking stimulated the development of synchronized intermittent mandatory ventilation (SIMV), which allowed patient-triggered mandated breaths. That is, like the A/C mode of ventilation, SIMV used two trigger variables, usually pressure and time; if the patient failed to trigger, an IMV breath was time triggered when the rate clock reached zero. Operators established SIMV by setting patient rate, VT, VI, flow waveform, and trigger sensitivity. Otherwise, as with IMV, the patient was free to breathe spontaneously as desired.
Clinical Applications
Proponents believed SIMV would eliminate breath-stacking, promote patient–ventilator synchrony, and minimize cardiovascular effects. These benefits were not all easily substantiated. Shapiro et al. (71) reported that mean intrapleural pressure was substantially lower with SIMV than with IMV in normal volunteers. Hasten et al. (72) compared SIMV and IMV in 25 critically ill patients; they found that although PIP was higher, blood pressure, cardiac output, stroke index, central venous pressure, and pulmonary artery pressure did not differ significantly. In a similar study, Heenan et al. (73) studied anesthetized, near-drowned dogs ventilated with IMV or SIMV. Again, no differences were noted with respect to cardiac output, stroke volume, intrapleural pressure, and intrapulmonary shunt. Mean airway pressure and PIP were significantly elevated with IMV, and some breath-stacking occurred, but the authors noted no adverse effects from these differences. Based on these data, SIMV seems to offer little clinical advantage compared to IMV with CPAP. There is a logical explanation for these findings, however: spontaneously breathing critically ill patients seldom inspire large spontaneous VT from CPAP systems. In fact, the high-rate/low-VT breathing pattern is extremely common; indeed, a high breathing frequency (f) to VT or f/VT ratios correlates well with extubation success (74). So, IMV breath-stacking, when it does occur, is unlikely to result in dangerously high spontaneous VT, PIP, or cardiovascular interference.
Modern ventilators all incorporate SIMV, and in the United States, SIMV with pressure support ventilation (PSV) is now the preferred ventilatory mode (75). When combined with PSV, synchronization is an absolute must. Unlike assisted or unassisted spontaneous breaths taken from a CPAP system, PSV breaths are frequently large—as large as or larger than the mandated VT; during SIMV with PSV, if a mandatory breath stacks on to relatively large PSV breath, a very large and dangerous VT would result.
Potential Problems
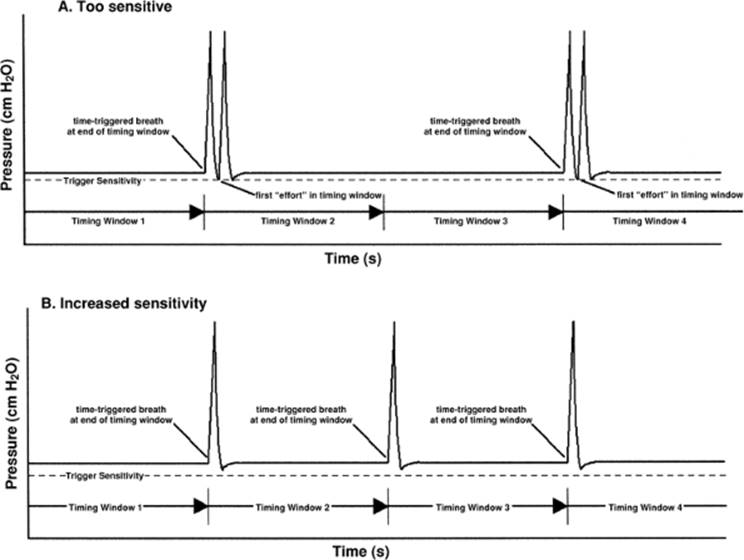
The two trigger variables used with SIMV cannot be programmed to function as flawlessly as during A/C ventilation. For instance, if the SIMV rate is 8 breaths per minute, but the patient is breathing spontaneously at a rate varying between 30 and 40 breaths per minute, exactly which of the 30 to 40 breaths should be selected for synchronization? If every fifth breath is selected, and the breath rate is 40 breaths per minute, the patient gets exactly 8 mandated breaths per minute; but what happens if the spontaneous rate suddenly drops to 30 breaths per minute? To overcome this dilemma, ventilator logic divides 60 seconds by the preset SIMV rate—in this case 60/8 = 7.5 seconds—and then opens a new timing window every 7.5 seconds. The ventilator is programmed to synchronize to the first patient effort in each timing window. If the patient makes no effort, the breath is delivered at the end of the window; this results in the desired SIMV rate—at least most of the time. Problems still occur, however. During apnea, a bizarre pattern often results. Since the patient fails to make an effort, a mandated breath occurs at the very end of a timing window; the next successive time window opens immediately, even before the just-delivered mandated breath can be exhaled. Exhalation therefore proceeds well into the next timing window. If at the end of this exhalation, Paw falls a few cm H2O below baseline pressure, as often happens, the ventilator often mistakes this pressure drop for the first patient effort in the timing window and—delivers a second successive SIMV breath, a phenomenon often referred to as autotriggering. The strange behavior does not end there. Since the ventilator has already “synchronized” to the first breath in the present timing window, and because the patient is apneic, it will not trigger again until the next successive timing window expires. A breathing pattern consisting of two consecutive mandated breaths, followed by 15 seconds without a mandated breath, followed by two consecutive mandated breaths repeats over and over (Fig. 128.18). Despite the bizarre appearance, the patient actually receives the eight mandated breaths per minute, just not in the pattern expected. Autotriggering is easily rectified by increasing trigger sensitivity to a point just below the pressure drop noted at end-exhalation. There is a caveat to this solution, however. Increasing trigger sensitivity makes triggering more difficult. Therefore, the operator must be sure to readjust the sensitivity as soon as spontaneous breathing activity resumes.
Pressure Support Ventilation
Operational Principles
Pressure support ventilation likely developed as a method to counteract the additional WOB imposed by early, poorly designed demand valves and demand-flow systems (28).
As demand systems improved, the WOB imposed by the breathing apparatus approached zero; still, patients often struggled to overcome the WOB imposed by the ET (29,30). Furthermore, increased Raw and/or reduced CRS increased patient physiologic WOB, often significantly (76). There were plenty of reasons to continue using PSV.
|
|
|
Figure 128.18. Synchronized intermittent mandatory ventilation (SIMV) and autotriggering during apnea. A: Too sensitive. An airway pressure curve demonstrating how trigger sensitivity set for normal breathing may be too sensitive during apnea. SIMV modes are programmed to synchronize to the first patient effort in each timing window. When no effort occurs, as during apnea, the ventilator must time trigger at the end of the timing window. If sensitivity is set too low (1–2 cm H2O), exhalation from the previous breath may appear as the first effort in the next timing window and autotrigger a breath. This scenario results in a bizarre breathing pattern: two breaths in succession, followed by a very long pause and two breaths in succession; the pattern then repeats. Interestingly, this pattern delivers the preset breathing rate, but not in the sequence expected. B: Increased sensitivity. An airway pressure curve of the same apneic patient, except that trigger sensitivity is increased to a pressure lower than that occurring during exhalation; this eliminates autotriggering and results in a more uniform pattern of ventilation. |
Pressure support is an assisted spontaneous breathing mode; it can be used alone or in conjunction with SIMV. It is patient triggered, pressure controlled, and is generally flow cycled (at 25%–50% of peak VI). Patients receiving PSV control their own breathing rate and exert some control over VT, peak VI, and TI. Originally, operators preset only the desired PSV level in cm H2O above the baseline pressure. PSV, however, generates very high initial VI; on occasion, the flow was too high for patient comfort (77). This shortcoming was corrected in the latest generation of ventilators by adding a “rise time” control. Clinicians use this control to adjust peak VI up or down to meet patient needs.
Clinical Application
Pressure support has replaced CPAP as the spontaneous breathing mode used during SIMV. PSV helps to reduce WOB by partially unloading the respiratory muscles. Approaches to the use of PSV vary; some advocate just enough PSV to zero-out any additional WOB imposed by the breathing apparatus and ET (25,27,29,78), whereas others try to neutralize both the imposed WOB and some of the physiologic WOB—enough to provide comfort and avoid fatigue. With backup modes for safety, some use PSV as a stand-alone (79,80).
Potential Problems
Despite its promise, PSV may have created more problems than it solved. If set too low, the patient continues to struggle and may fatigue; set too high, the patient does essentially no work and is predisposed to disuse atrophy of the respiratory muscles. Confounding matters are two unresolved problems: first, no one has developed a noninvasive, easy-to-use, reliable method for determining the proper PSV level; and second, patient demands vary considerably, and a single PSV level cannot possibly meet every conceivable patient demand level. Studies suggest that if PSV levels are managed around the clock, patients spend significantly less time receiving ventilatory support (81).
Pressure-controlled Ventilation
Operational Principles
As outlined in the classification section, in today's ICU, virtually all mechanical breaths are either volume or pressure controlled. Pressure-controlled breaths can be used for CMV, A/C, mandated SIMV breaths, as well as for pressure-controlled inverse-ratio ventilation (PC-IRV). Operators set the desired ventilator rate, TI, target pressure (above baseline), and, for A/C or SIMV, trigger sensitivity. After a PCV breath is triggered, flow and pressure rise rapidly to the preset pressure; on reaching pressure, flow decelerates as needed to maintain that pressure until the preset TI elapses. For patient-triggered modes, the same rise time control used for PSV adjusts the initial flow rate and pressure rise in PCV; on occasion, an appropriate adjustment of the rise time control significantly enhances patient comfort. For those acutely ill with ARDS, PC-IRV is sometimes applied. Using PC-IRV, however, requires sedation and sometimes neuromuscular blockade; awake and alert patients seldom tolerate the extended TIintervals—with I:E ratios up to 4:1—used during PC-IRV without “fighting” the ventilator.
Clinical Applications
Clinicians opt for PCV instead of VCV for three reasons or some combination thereof: (i) to provide higher initial and average VI for patients breathing spontaneously during mechanical breaths; (ii) to control PIP and limit the possibility of VILI; and/or (iii) to use PC-IRV. Although several studies report improvements in oxygenation at lower PIP using PC-IRV with infants (82,83), its use in adults (84,85) remains limited. Clearly, PC-IRV elevates mean Paw, which in turn raises FRC. Proponents of PC-IRV, however, claimed similar improvements in oxygenation to those seen using VCV but at much lower CPAP or PEEP levels. Using PCV as a method to control PIP and minimize the risk of VILI is an interesting approach. However, if the culprit in VILI is the end-inspiratory lung volume and not the PIP, then the approach is terribly flawed. That is, during PCV, the patient is free to interact with the ventilator. If the patient inhales deeply during any pressure-controlled breath, the resultant spontaneous VT may be quite large. Thus, while PCV may control Paw precisely, it fails to limit VT to a safe level. Along the same lines, using PCV to provide higher peak and average VI makes sense only if the attending clinician is comfortable with the potential for a large range in spontaneous VT.
Potential Problems
The defining characteristics of PCV are high peak VI, decelerating flow waveform, and no control over VT. At one extreme, PCV continues to control pressure even if the ET occludes and VT drops to zero; at the other extreme, a vigorous patient effort often produces very large spontaneous VT, especially when compared to the VT delivered with no effort. Clinicians using PCV must carefully set high and low VTand minute ventilation alarms to avoid these problems, as well as keep a close eye on ventilator graphics, if available. Often, these problems are visually apparent well before adverse responses.
For a time, PC-IRV was popular; this was, in part, due to claims that the mode increased oxygenation and reduced PIP without using high PEEP or CPAP. In retrospect, these authors were probably mistaken. Two editorials questioned these claims by suggesting that the benefits seen with PC-IRV were due to PEEP—that is, undetected auto-PEEP (86,87). Auto-PEEP results from incomplete exhalation; gas volume trapped in the lungs from the proceeding breath exerts an elastic pressure similar to PEEP or CPAP—thus the name auto-PEEP. Gas trapping results for two primary reasons: incomplete time for exhalation or premature airway collapse. Inverse ratios, as used in PC-IRV, reduce exhalation time, often significantly; hence PC-IRV predisposes to air trapping or auto-PEEP. Furthermore. during normal exhalation, auto-PEEP exists only in the lungs, not in the breathing circuit, making it difficult to detect; for this reason, some have even called it occult-PEEP (88). Auto-PEEP can, however, be estimated at the bedside, if one suspects its existence (88). A patient's total PEEP must take into consideration auto-PEEP:
![]()
Once this concept was understood, clinicians began routinely monitoring for auto-PEEP. Of note, interest in PC-IRV waned almost concomitantly, providing strong circumstantial evidence that auto-PEEP was indeed responsible, in part, for PC-IRV's initial success in adults. Today's mechanical ventilators measure auto-PEEP “on request,” assuming the patient makes no effort to breathe during the measurement.
Spontaneous Breathing
CPAP and Spontaneous PEEP
Operational Principles
Given the improvements in oxygenation, VA/Q, CRS, and WOB attributed to using PEEP or CPAP during mechanical ventilation (14,15,16,68,89), it seems logical to use them as stand-alone modes. With CPAP, both inspiratory and expiratory pressures remain positive. As a practical matter, the inspiratory pressures are lower than expiratory during CPAP. This occurs for three reasons: (i) during inspiration, the removal of gas from the continuous flow by the patient causes pressure to fall; (ii) triggering a demand CPAP system generally requires that pressure fall; (iii) the CPAP system cannot meet the patient's inspiratory flow demands. By definition, spontaneous PEEP requires that the patient reduce Paw to zero or less during the inspiratory phase; Paw returns to the PEEP level during exhalation. Spontaneous PEEP differs from CPAP in that the large pressure fluctuations during inspiration impose a significantly greater WOB on the patient (90) (Fig. 128.19). When tolerated, however, the same large pressure swings improve venous return and cardiac output (91). Conversely, CPAP reduces patient WOB, but at the expense of cardiac output.
|
|
|
Figure 128.19. Work imposed by spontaneous continuous positive airway pressure (CPAP) or positive end-expiratory pressure (PEEP) breathing systems. The inspiratory work of breathing (WOBI) encountered by patients breathing spontaneously is affected by the type of breathing system. Additional workloads imposed on spontaneously breathing patients are determined by measuring the area under the curve obtained by plotting airway pressure (Paw) versus volume (VT) loops taken at the proximal airway (i.e., at the endotracheal tube opening). End-expiratory pressure is 10 cm H2O, while the simulated patient effort is identical for both systems. The additional WOBI (cross-hatched areas) is computed from the area within the Paw/VT loop while Paw remains below the starting point (10 cm H2O). With the CPAP system, Paw initially falls to 7 cm H2O (during triggering) but quickly returns to 9 cm H2O for the remainder of inspiration; with the spontaneous PEEP system, the same patient effort initially reduces Paw to -2 cm H2O, but it quickly returns to 0 cm H2O. The computed WOBI for the CPAP system is approximately 0.1 joules (J) and for the PEEP system 0.48 J, an increase of 480%. The expiratory work of breathing (WOBE) is generally a nonfactor; the energy required to exhale is provided by the energy released as patients' highly elastic lungs, which were stretched during inflation, recoil to their resting position (like releasing a just-inflated party balloon). |
Years ago, most CPAP and PEEP devices were “homemade”—there were no commercially available systems. Modern ventilators easily provide either spontaneous PEEP or CPAP and have obviated the need for homemade systems, particularly in the ICU setting. Using a ventilator to provide spontaneous PEEP or CPAP has distinct advantages; if the patient deteriorates, the ventilator is already on hand. Furthermore, modern ventilators often incorporate backup modes that automatically begin ventilating patients following any predefined. For example, a 15- to 60-second period of apnea.
The optimum level of PEEP or CPAP can be difficult to determine. For this reason, clinicians often start with a conservative level and then titrate based upon quantitative criteria such as serial blood gases (92,93), oximetry (94), computers (95), or even conjunctival oximetry (96).
Clinical Applications
The rationale for applying spontaneous PEEP or CPAP is the same, of whether they are used with or without mechanical ventilation: both techniques improve oxygenation, VA/Q, CRS, FRC, and WOB. Furthermore, CPAP/PEEP prevents airway collapse during exhalation and reduces the potential for low-volume lung injury.
Potential Problems
Both spontaneous PEEP and CPAP impose an additional workload on the patient's respiratory muscles. Of the two, there is no argument that spontaneous PEEP imposes a far greater workload. However, even a “perfect” CPAP system—one that allows little or no pressure deflection during inhalation—still does not eliminate the additional WOB imposed by the patient's ET. If an ET is too small, kinks, or becomes partially occluded, the patient's WOB may be intolerable, even with the best CPAP system.
Consider the following example:
Suppose a patient's ET imposes a flow resistance of 10 cm H2O/L/second, CPAP is set at 10 cm H2O, which drops to 8 cm H2O at midinspiration, and peak VI measures 60 L/minute; pressure at the carinal end of the ET at midinspiration is as follows:
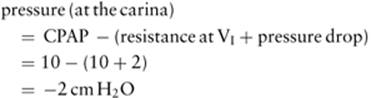
What is defined as CPAP in the breathing circuit is actually spontaneous PEEP at the carinal end of the ET. In this situation, maintaining CPAP at the carinal end of the ET requires an airway pressure of ≥20 cm H2O; in this situation, a PSV setting of 10 cm H2O would neutralize most of the WOB imposed by the ET. It also demonstrates why PSV has virtually replaced CPAP in the ICU setting.
Spontaneous CPAP, especially at high levels, may hyperinflate the lungs, elevate VD/VT, and depress cardiac output. Clinicians using CPAP must remain vigilant, for as patients improve so too does their CRS, thereby elevating the risk for these side effects.
Airway Pressure Release Ventilation
Operational Principles
Unlike conventional mechanical ventilation, airway pressure release ventilation (APRV) establishes an elevated baseline pressure—or CPAP level—ostensibly to restore FRC; tidal ventilation occurs by decreasing, or releasing, the CPAP. APRV allows unrestricted spontaneous breathing at all times, even during releases. Interestingly, with conventional ventilation, a higher breathing rate means a higher mean Paw, which, in turn, reduces venous return and cardiac output; with APRV, however, a higher breathing rate actually lowers the mean Paw. As a result, APRV has far less influence on cardiovascular parameters than a comparable level of CPAP.
During the process of initiating APRV, the operator presets the desired CPAP level, number of releases/minute (or breath rate), release time, and release pressure. Although it is possible to set VT during APRV, it is a difficult trial-and-error process. VT is limited by the CPAP level, release pressure, release time, and patient CRS. For example, suppose a patient's CPAP level is set at 10 cm H2O, CRS is 50 mL/cm H2O, and the release pressure is set to 0 cm H2O. The maximum VT for this patient is (assuming complete exhalation) as follows:
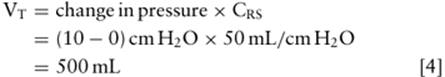
Release volume or VT also varies with release time; we get the maximum VT only if release time is long enough for the lungs to completely empty. On many occasions, however, oxygenation deteriorates when using a release pressure of zero. When this happens, raising the release pressure will restore oxygenation (97), but unless the CPAP level is raised concomitantly, VT will fall. When switching from conventional mechanical ventilation to APRV, some suggest an adequate VT results by setting CPAP at 1.5 to 2 times that required during conventional ventilation (98,99).
Clinical Applications
Proponents believe APRV should minimize barotrauma because PIP never surpasses the CPAP level and maximum lung volume never exceeds the restored FRC. In addition, APRV lowers physiologic VD and improves oxygenation (97,100,101). If these assertions are proven accurate, APRV might be used in place of conventional ventilation for virtually any and all patients.
A variant of APRV, called intermittent CPAP, has recently been used during general anesthesia. Bratzke et al. (102) studied surgical patients, exposing them to alternating trials of APRV and CMV. During APRV, patients required less ventilation to produce a PaCO2 comparable to that during CMV; this finding represents a significant reduction in VD and an improved efficiency of ventilation. They also reported that, compared to CMV, APRV improves the accuracy of using the end-tidal partial pressure of CO2 (PETCO2) as a monitor of PaCO2.
Potential Problems
There is a potential flaw in the potential for APRV to minimize barotrauma. That is, APRV as described and studied does not necessarily eliminate the risk for low-volume lung injury (4,5,6,7). If avoiding VILI requires that all tidal ventilation take place between the lower and upper inflection points, as some now believe (19), then APRV will fail to protect patients, especially if release pressures of 0 to 6 cm H2O are used as reported (97,100,101). On the other hand, given that the volumetric distance between the lower and upper inflection point is often small and that APRV maintains the same PaCO2 levels as CMV with less ventilation, APRV may well offer the best lung-protective ventilatory strategy available. This assumes, of course, that the CPAP level is set to a pressure below the upper inflection point and the release level to a pressure above the lower inflection point (19).
Special Techniques
Pressure-targeted Volume Ventilation
Operational Principles
For years, the Food and Drug Administration (FDA) resisted approving any sort of “smart” ventilator setting. Pressure-targeted volume ventilation, pressure-regulated volume control (PRVC), or volume ventilation plus represent a distinct departure from that stance; this mode is far more automated than any before it. To initiate the mode, the operator presets a ventilator rate, VT, TI, and trigger sensitivity (if patient triggering is desired). On connecting the patient, the ventilator performs up to three test breaths. Test breaths are, as a rule, square flow pattern, volume-controlled breaths with a short end-inspiratory pause. Assuming one of the test breaths is not disturbed by patient attempts to breathe, the ventilator determines the patient's CRS (Fig. 128.13 and Table 128.3). Once VT and CRS are known, the ventilator rearranges and solves equation 4:
Pressure change (target) = VT/CRS
Having determined the target pressure, the ventilator switches from the test breath protocol into what amounts to a smart PCV. For safety reasons, the ventilator begins PRVC using a pressure substantially below that calculated (above). The ventilator “watches” the exhaled VT and gradually, over the next five to ten mechanical breaths, ramps up its pressure until the exhaled VT equals that requested. At this point, the operator must thoughtfully set the ventilator's high Paw limit based on the current target pressure and the maximum Paw deemed safe for the patient. This setting is crucial because PRVC is not limited to the initial or starting target pressure. In fact, PRVC changes target pressure as often as required, within limits, to maintain an exhaled VT equal to that requested. If, for instance, patient CRSsuddenly deteriorates, VT also falls in direct proportion and concomitantly. The ventilator immediately detects the reduced exhaled VT and increases target pressure at a rate of 2 or 3 cm H2O per breath. Target pressure continues to increase with each breath until either exhaled VT is restored or target pressure reaches a value no greater than the high Paw limit minus 2 to 3 cm H2O. The same but opposite response occurs should CRS improve and VT increase; that is, target pressure is reduced by 2 or 3 cm H2O until the exhaled VT is re-established, but target pressure can go no lower than baseline pressure (PEEP or CPAP level, if applicable) plus 3 cm H2O.
Clinical Applications
In theory, PRVC combines the best aspects of both VCV and PCV: consistent VT, delivered at lower PIP with high initial peak VI. Some clinicians will consider using this mode for its ability to deliver the same VT at lower PIP. There is no doubt this strategy works to lower PIP, but the same VT produces the same ERP, regardless of how that volume is forced into the lungs (Fig. 128.14). This explains why, in two carefully controlled studies comparing PRVC to VCV, the researchers found significantly lower PIPs but were unable to detect any difference in outcome (103,104).
Others might consider using PRVC for its ability to provide high initial peak VI, reduce WOB, and better synchronize with spontaneously active patients. Kallet et al. (53) looked at this issue during lung-protective ventilation, and concluded that PCV and PRVC offer no advantage in reducing WOB when compared to VCV with a high preset VI.
Potential Problems
Conceptually, PRVC appears inherently safer than traditional PCV because it automatically maintains the preset VT. Nevertheless, if the operator does not carefully set the high Paw limit, PRVC may produce unexpected and dangerous changes. For instance, imagine a patient supported by PRVC with a VT of 500 mL and a target pressure of 25 cm H2O; the operator sets a high Paw limit of 50 cm H2O. Suppose this patient develops an acute tension pneumothorax and the affected lung collapses. The patient's apparent CRS would suddenly be reduced by one half or more. If the mode were traditional PCV, VT would be reduced to the same extent, thereby leaving the contralateral lung inflated by essentially the same VT as prior to the pneumothorax. In contrast, VT would also be initially reduced with PRVC, but almost immediately, PRVC would begin increasing the target pressure at 3 cm H2O per breath in an effort to re-establish the preset exhaled volume. If the desired VT was re-established by 47 cm H2O (high Paw limit minus 3 cm H2O), then the entire initial VT for both lungs is forced into the remaining good lung, risking hyperinflation and damage to this lung as well.
Proportional Assist Ventilation (PAV)
Operational Principles
As explained, PSV unloads potentially fatiguing workloads from spontaneously breathing patients. Unfortunately, it is difficult to determine the needed level of PSV, and PCV does not accommodate changes in patient breathing pattern. As a consequence, PSV either oversupports or undersupports the patient most of the time. Ideally, we need a variable support mode that automatically raises or lowers its response to maintain the same level of support, regardless of patient effort. Younes proposed such a mode, which he named proportional assist ventilation (PAV) (105,106). This mode relies on what is referred to as the equation of motion of the respiratory system, which states:
![]()
If CRS and Raw are known and the ventilator measures VT and VI instantaneously, as it provides them, the work required—measured as pressure—can easily be computed, regardless of effort level; recall that work is defined as the integral of Paw with respect to time. If the ventilator also knows the ET size and flow resistance, stored in ROM, the ventilator can compute nearly the total WOB, although this approach cannot determine the work needed to inflate the chest wall. Estimating patient WOB in real time, throughout each and every breath, allows the ventilator to unload any quantifiable amount or percentage of that WOB; in fact, most PAV systems are preset to unload a specific percentage of the total WOB provided by the ventilator. For instance, if PAV was preset for 50%, the ventilator would measure the work being performed and provide exactly half of it. By measuring VI and VT, many times within each breath, PAV provides 50% of the work generated, regardless of how much or little effort the patient expends.
Assuming PAV works as theorized, it should meet a patient's varying needs by proportionally altering its response, a feature PSV cannot match. Nevertheless, PAV brings us no closer to a quantifiable and reliable method for determining an appropriate level of support; that is, we do not know what percentage of the total WOB the patient can tolerate. Manufacturers recommend starting PAV at a high percentage and gradually tapering down as the patient improves; the statement simply states the obvious and applies equally well to PSV.
Clinical Applications
If PAV proves effective, clinicians should use it in any instance when they would previously have used PSV. So far, PAV remains unproven and controversial. Giannouli et al. (107) compared different levels of PSV and PAV; they reported that PAV seemed more synchronous, but the differences had no effect on gas exchange or spontaneous breathing rate. Hart et al. (108) compared PAV to PSV in patients with neuromuscular and chest wall deformity and concluded that both modes produced similar improvements. Finally, Passam et al. (109) compared different levels of PSV and PAV on breathing pattern, WOB, and gas exchange in mechanically ventilated, hypercapnic COPD patients. They concluded that in COPD, although both PAV and PSV produced similar improvements in blood gases, higher levels of PSV often resulted in spontaneous efforts that failed to trigger breaths, whereas under similar circumstances, PAV developed the “runaway” phenomenon. Runaway occurs when, during PAV, the ventilator begins to trigger on and cycle off at rates much higher than the patient's actual spontaneous breathing frequency. Finally, another group reported that PAV was not superior to PSV in unloading the respiratory muscles following artificially increased ventilatory demand (110). These failures have caused some to question whether PAV represents any improvement over PSV (111,112).
Potential Problems
Based on existing research, patients respond very differently PAV than PSV; yet, the end results so far appear similar. To date, we have over 20 years of clinical experience using PSV. It makes little sense switching to PAV without a compelling reason to do so, especially if PAV is going to affect patients differently and in ways we may not yet understand. One of those differences involves the previously mentioned runaway, which results when the pressure provided by PAV exceeds the patient's elastance (inverse of CRS) and Raw, and persists into the exhalation phase. The physiologic problems that might result during runaway PAV remain to be thoroughly understood and unexplained.
Transport Ventilation
Automatic or Manual Ventilation
Ventilation during transport is still often supported using a self-inflating bag (e.g., the Ambu device), a flow-inflating (Mapleson) system, or oxygen-powered breathing devices (Elder demand valve or similar device). This is indeed surprising in an era dominated by evidence-based medicine. The use of bags and valves, even in the most skilled hands, results in significant breath-to-breath differences in VT, respiratory rate, minute ventilation, PIP and, in some cases, inspired fraction of oxygen (FIO2). These differences, acting alone or in combination, may disrupt arterial blood gases at the end of even a short intrahospital transport (113,114,115,116). Furthermore, bags and valves may not deliver an effective level of PEEP/CPAP and can make spontaneous breathing difficult. A portable ventilator with the proper capabilities is clearly a better choice.
|
Table 128.4 Desirable Characteristics for Transport Ventilators |
||
|
Important Features for Transport Ventilation
Typical ICU-type mechanical ventilators are too large, cumbersome, and fragile to use for transports. Repairing a $30,000 ICU ventilator unintentionally tipped over or dropped during a rushed transport could easily cost as much or more than the purchase price of a new transport ventilator. Ruggedness is one of the more important, but often overlooked, characteristics desired in a transport ventilator (Table 128.4). Most practitioners opt for units that are electrically powered, with battery backup; nevertheless, an ideal unit would also work when powered only by compressed air or oxygen. Several hospitals in Hurricane Katrina's wake lost electric power for days following the storm. Absolutely nothing electric worked and batteries were all dead in a few hours; yet they had plenty of oxygen. Without properly equipped, pneumatically powered ventilators, however, these physicians and nurses simply could not adequately ventilate their sickest patients (39). Unfortunately, there are no currently manufactured transport or emergency ventilators that are powered either electrically or pneumatically. It seems only reasonable that disaster preparedness teams consider having at least a few pneumatic transport ventilators available; at present, with certain exceptions, this does not seem to be the case.
Spontaneous Breathing during Transport
Disaster preparedness for mass casualty scenarios or avian flu outbreaks has taken the country by storm. To meet the demand, many companies are either modifying existing ventilators for emergency use or are bringing new products to market. Currently, dozens of brands of transport and emergency ventilators are available; this makes the selection process truly difficult at best.
Perhaps a transport ventilator's spontaneous breathing capabilities provide us with a useful metric. Clearly, the act of spontaneous breathing reduces VD (51,52,117,118). True spontaneous breathing, however, dramatically improves virtually every parameter associated with VA/Q matching. Putensen et al. (117) compared APRV, which allows unrestricted spontaneous breathing, to PSV, which provides pressure assistance during each spontaneous breath. The APRV group demonstrated improved VA/Q matching, venous return, right ventricular end-diastolic filling, stroke index, PaO2, O2 delivery, and mixed venous oxygen content when compared to PSV. In addition, APRV reduced VD, intrapulmonary shunting, pulmonary vascular resistance, and O2 extraction when compared to PSV (117). Given the compelling strength of the data, it is surprising so few clinicians consider the idea of spontaneous breathing during transport. Perhaps this oversight developed because so few transport ventilators allow effortless spontaneous breathing. Some might argue that patients do not really need to breathe spontaneously during a 10-minute transport. On the other hand, heavy sedation, paralysis, and CMV really do not appear to be in the best interest of potential avian flu victims.
The vast majority of true emergency or transport ventilators simply do not facilitate spontaneous breathing. Making matters worse, many use optional PEEP valves that attach to the exhalation valve, and demand valves that trigger at subambient pressure; these greatly magnify patient WOB as compared to CPAP, often requiring a herculean effort to trigger and maintain flow during spontaneous breaths (Fig. 128.19). To circumvent these issues, clinicians take one of several approaches: heavily sedate or even paralyze patients they plan to transport, thus allowing the use of CMV; or moderately sedate patients, allowing them to use the A/C mode of ventilation with minimal patient interaction.
For those wishing to avoid sedatives and paralytic agents, the transport ventilator needed is one that allows unimpeded, extremely low WOB spontaneous breathing. The pNeuton ventilator (Airon Corporation) is pneumatic and claims spontaneous WOB comparable to that of an ICU ventilator; unfortunately, this claim has not been scientifically validated. Without scientific data, testing ventilators with actual breathing will often expose a system's strengths and weaknesses in terms of its spontaneous breathing claims. Considering the potential benefit to patients allowed to spontaneously breathe during transport, it is surprising there are so few scientific studies thoroughly examining WOB as it applies to transport ventilators. Furthermore, the studies done so far are now dated; that is, they do not include many of today's newer and more popular models. For example, one study found the LTV 1000 (Pulmonetics) consistently produced WOB values comparable to those of critical care ventilators (117). The LTV 1000 has two distinct drawbacks as a transport ventilator. First, it will not tolerate the many “crash landings” most transport ventilators must endure. Second, the LTV 1000 uses a very precise, high-speed turbine compressor. When used in a dehumidified, heated, and air-conditioned environment like a hospital, the LTV 1000 will likely work for many hours without incident. On the other hand, if the LTV 1000 is even briefly exposed to the heat and humidity often found outdoors and is then moved back indoors, a potential exists for condensation to develop on the turbine's bearings. If this occurs, the lifespan of the turbine can be dramatically shortened.
Side Effects and Complications
Spontaneous Breathing
An understanding of the effects of any form of positive airway pressure requires a working knowledge of the physiology that drives spontaneous breathing. Normal spontaneous inspiration at ambient pressure involves contraction of the diaphragm. As the diaphragm contracts, a pressure gradient develops between the pleural space and the mouth; in response, air rushes from the mouth into the lungs. During expiration, the diaphragm relaxes, the gradient reverses, and the gas leaves the lungs.
Hemodynamics
Return of venous blood to the heart is dependent on the pressure gradient between the peripheral vasculature and the right atrium. If mean pressure rises or right atrial pressure (RAP) falls, venous return increases. Conversely, a fall in mean pressure or a rise in RAP decreases venous return. Because output of the right ventricle is dependent on the venous return factors that alter mean pressure and RAP also affect cardiac output (119).
Intrapleural Pressure Changes
A decrease in intrapleural pressure during inhalation is associated with a similar decrease in RAP which enhances venous return. During exhalation, intrapleural pressure increases and venous return falls; these fluctuations are familiar to anyone who has viewed a recording of central venous pressure in a spontaneously breathing patient.
Ventricular Interdependence
Because the right and left ventricles are surrounded by the pericardium, volume changes in one chamber affect the other. An increase in right ventricular volume during inspiration pushes the interventricular septum toward the left (posteriorly), thereby increasing left ventricular pressure; this in turn reduces left ventricular filling and changes the spatial configuration and compliance of the left ventricle.
Left Ventricular Afterload
The decrease in intrapleural pressure is also transmitted to the left ventricle. At the peak of spontaneous inspiration (lowest intrapleural pressure), the left ventricular end-diastolic pressure is reduced correspondingly. In contrast, the pressure that must be developed by the ventricle to perfuse the systemic vessels outside the thoracic cavity remains the same. Because the ventricle is initiating contraction from a lower baseline pressure, however, the gradient of pressure that must be generated is increased.
The increment in necessary wall tension represents an increase of the left ventricular afterload and may be tolerated poorly by patients with ischemic heart disease and compromised ventricular function. Spontaneous breathing with PEEP, which requires greater decrements in airway pressure and pleural pressures for gas to flow, predisposes to this chain of events. Conversely, a properly functioning CPAP system, which requires minimal deflections in airway and intrapleural pressures, minimizes such changes.
Pulmonary Vascular Changes
Expansion of the lungs also affects hemodynamic function. Alveolar vessels are compressed and elongated while pressure and alveolar volume increase. Extra-alveolar vessels, however, are opened by traction of lung inflation, with a consequent decrease in their resistance. When the alveolar vessels are engorged, inspiration decreases net pulmonary blood volume, and pulmonary venous return to the left ventricle may rise. Conversely, when alveolar vessels contain less blood, spontaneous inspiration changes alveolar blood volume very little, but a net increase in pulmonary blood volume and a concomitant decrease in pulmonary venous flow to the left ventricle occurs.
Spontaneous PEEP and CPAP
Common hemodynamic alterations seen during spontaneous PEEP or CPAP involve five major areas:
1. Decreased venous return: Most studies confirm increased intrapleural pressures, secondary to the increased mean airway pressures used by these modalities. This reduces the mean pressure/RAP gradient, which in turn reduces venous return. The heart has less blood to pump and output falls.
2. Decreased right ventricular function: Acute respiratory failure and PEEP/CPAP may, in some circumstances, increase pulmonary vascular resistance. Conceivably, the right ventricle might fail under these conditions; yet, this is probably not a major direct cause of positive pressure–induced cardiovascular insufficiency.
3. Decreased left ventricular function: Left ventricular dysfunction can result from increased mean airway pressures, but the changes are most likely the result of right ventricular dilatation and encroachment. Some investigators question this hypothesis, however. Prewitt and Wood (120) suggest that in selected instances (for example, high PEEP), 50% of the reduction in cardiac output results from left ventricular failure. Clearly, the mechanisms are complex and incompletely understood.
4. Neural and humoral depression: In canine cross-circulation studies, PEEP applied to one dog's lungs resulted in a reduction in cardiac output in both animals (121). The nature and composition of the depressant substance or substances is unknown.
5. Reduction of endocardial blood flow: It has been suggested that an increased mean airway pressure may act to impede coronary arterial blood flow (122). Such a decrease has been demonstrated experimentally during the use of PEEP.
Most studies show that spontaneous PEEP does not affect circulatory function adversely, as long as patients are not hypovolemic. These observations, oddly, are diametrically opposed to those expected during normal breathing. This phenomenon is best explained by the fact that PEEP is not generally used on normal lungs; when it is, FRC is raised above normal, often significantly. With more volume in the lungs, even during exhalation, venous return may be compromised. When either PEEP or CPAP is used therapeutically, however, patients invariably have reduced compliance and a significantly reduced FRC. Collapsed and underventilated alveoli produce hypoxic vasoconstriction in the affected areas; this often markedly increases pulmonary vascular resistance and abnormal loading of the right ventricle. As end-expiratory pressure is raised, FRC increases back toward normal, and underventilated alveoli re-expand; this releases some of the hypoxic vasoconstriction, and unloading of the right ventricle may occur.
Sturgeon et al. (91) reported the effects of 15 cm H2O spontaneous CPAP, 15 cm H2O spontaneous PEEP, and zero pressure on a group of patients following coronary artery bypass grafting. When receiving spontaneous PEEP, this group's cardiac output was 1 L/minute more when compared to spontaneous PEEP or zero pressure. The authors suggested that the very large intrapleural pressure drops of >15 cm H2O—required to breathe from 15 cm H2O PEEP—resulted in a substantially greater venous return. Also, as pleural pressure increased back to the 15 cm H2O baseline during exhalation, the associated and likely pericardial compression may have aided ventricular ejection.
Large intrapleural pressure fluctuations are not always beneficial, and could easily overfill the right ventricle, resulting in an elevated left ventricular afterload. It is quite possible a worst case scenario could involve a patient with severe coronary artery disease and left ventricular failure, managed using a high level of spontaneous PEEP. The resultant increase in the left ventricular afterload on an already failing myocardium would predispose to a dramatic and potentially dangerous fall in systemic cardiac output, as well as acute pulmonary edema. Substituting a properly functioning spontaneous CPAP system with a minimal trigger sensitivity would, all other things being equal, unload the left ventricle by decreasing the preloading of the right ventricle.
Mechanical Ventilation
Hemodynamics
Falling Pressures
As a rule, any form of positive pressure breathing will reduce venous return and decrease right ventricular preload; with normal lungs, the effect is pronounced. Even modest increases in airway pressure will elevate the FRC well above normal; an increased intrapleural pressure from the overexpanded lungs presses the pericardium and compresses the heart. These conditions make interpreting filling pressures a challenge, as the central venous pressure (CVP) and pulmonary artery occlusion pressure may be elevated while ventricular stroke volumes are actually decreased.
Ventricular Function
As stated, the elevated airway pressures associated with positive pressure breathing increase the right ventricular afterload and, in turn, decrease venous inflow to the right heart. At the same time, transmural aortic pressure, left ventricular afterload, and end-systolic left ventricular volume fall. The reduced output volume is easily restored by intravascular volume expansion—enough to counteract some or all of airway pressure on venous return. If, after re-expansion of intravascular volume, the source of elevated airway pressure—i.e., ventilator or PEEP/CPAP system—is suddenly removed, a venous return surge that may be well beyond the initial baseline predisposes the patient to acute pulmonary edema (123); this complication is especially likely if the patient's left ventricle is compromised.
Robotham et al. (124) summarized the known and postulated effects of positive pressure inflation of the lungs on cardiopulmonary function; most of these have already been reviewed. They concluded that mechanical ventilation may act as a (relatively) noninvasive cardiac assist device and deserves further evaluation as such.
IMV/SIMV/CPAP
The hemodynamic effects of spontaneous breathing, with or without CPAP, and those secondary to positive pressure ventilation become complicated when combined, as during IMV/SIMV with CPAP. The cumulative effect likely depends on the relative contributions of spontaneous versus mandated breaths, as well as the absolute values of the inspiratory and expiratory pressures, VT, baseline cardiovascular status, intravascular volume, and so forth. Ventilator performance also plays an important role, especially during spontaneous breathing.
A difficult-to-trigger CPAP system, or a poorly designed and slow-to-respond demand-flow valve, often requires major inspiratory efforts by the patient. These factors were the primary reason many early trials of IMV failed; that is, patients were simply fatigued to the point of failure by work imposed by the system—not by the technique.
Barotrauma and Ventilator-Induced Lung Injury
For many years, the concept of pulmonary barotrauma was limited to extra-alveolar air leaks. It is now abundantly clear that human lungs can be damaged internally by the ventilator with or without air leaks; this type of damage is known as ventilator-associated lung injury (VALI) and is reviewed in depth elsewhere (see Chapter 138).
Extra-alveolar Air Leaks
All forms of mechanical ventilation, whether by virtue of positive or negative pressure, rhythmically drive air in and out of the lungs. As outlined, mechanical ventilation disrupts normal hemodynamics, alters VA/Q ratios, and occasionally damages the lungs. Pulmonary barotrauma (PBT) represents the classic form of VILI. Pulmonary barotrauma includes pneumothorax, pneumomediastinum, pneumopericardium, pneumoperitoneum, pneumoretroperitoneum, subcutaneous air, and air embolization—either venous or arterial. Interestingly, none of these conditions actually describe lung injury. Rather, each of these represents a form of extra-alveolar air; each occurs after the lung fabric is torn and an air leak follows. Air leaks occur following a tear in the fabric of lung parenchyma. If the tear involves the visceral pleura, a pneumothorax often results as the air quickly moves into the pleural space, which the pressure is negative relative to alveolar pressure most of the time. Tension pneumothorax is the most threatening variety of this problem and can obliterate cardiac output if not immediately decompressed. When an air leak occurs away from the pleura, the repeated stretching associated with positive pressure ventilation facilitates the dissection of air along the perivascular sheaths that parallel the airways. Eventually, the dissecting air reaches the pulmonary hilum, where it may invade the subcutaneous tissues of the neck or enter the mediastinum and beyond. Rarely, the rent exposes a vessel large enough for air to enter, and with sufficient air pressure changes (positive or negative), air may enter the circulation. Scuba divers who ascend too rapidly or hold their breath while surfacing can easily rupture their lungs. Because divers normally surface with their heads up, the air bubbles rise and may reach the brain. Cerebral air emboli can be fatal, particularly when the diver cannot be quickly recompressed in a hyperbaric chamber.
A common misconception—that PEEP and CPAP increase the incidence of barotrauma—persists even today. Yet, no increase in the incidence of barotrauma occurs when positive pressure ventilation and CPAP are compared with positive pressure alone (125,126).
Summary
Mechanical ventilators continue to evolve rapidly in complexity, design, and function. It is quite likely this brisk pace will persist for many years. As outlined, it also seems likely that controversies regarding how and when to use ventilators safely and effectively will not be conclusively resolved anytime soon. This set of circumstances means that those of us responsible for prescribing, operating, monitoring, or repairing ventilators must rise to the challenge of maintaining an up-to-date knowledge base. This is no easy task but one that will result in significant benefits for all parties involved.
References
1. Kolobow T, Moretti MP, Famagalli R, et al. Severe impairment of lung function induced by high peak airway pressure during mechanical ventilation. Am Rev Respir Dis. 1987;135:312.
2. Tsuno K, Prato P, Kolobow T. Acute lung injury from mechanical ventilation at moderately high airway pressures. J Appl Physiol. 1990;69:956.
3. Bowton DL, Kong DL. High tidal volume ventilation increases lung water in oleic acid-injured rabbit lungs. Crit Care Med. 1989;17:908.
4. Hernandez LA, Cohen PJ, May AL, et al. Mechanical ventilation increases microvascular permeability in oleic injured lungs. J Appl Physiol. 1990;69:2057.
5. Taskar V, Evander JJE, Robertson B, et al. Surfactant dysfunction makes lungs vulnerable to repetitive collapse and reexpansion. Am J Respir Crit Care Med. 1997;155:313.
6. Argiras EP, Blakeley CR, Dunnill MS, et al. High PEEP decreases hyaline membrane formation in surfactant deficient lungs. Br J Anaesth. 1987;59:1278.
7. Muscedere JG, Mullen JBM, Gan K, et al. Tidal ventilation at low airway pressures can augment lung injury. Am J Respir Crit Care Med. 1994;149:1327.
8. Martin C, Papazian L, Payan MJ, et al. Pulmonary fibrosis correlates with adult respiratory distress syndrome: a study in mechanically ventilated patients. Chest. 1995;107:196.
9. Fariday EE, Permutt S, Riley RL. Effect of ventilation on surface forces in excised dogs' lungs. J Appl Physiol. 1966;21:1453.
10. Brown ES, Johnson RP, Clements JA. Pulmonary surface tension. J Appl Physiol. 1959;14:717.
11. Fariday EE. Effect of ventilation on movement of surfactant in the airways. Respir Physiol. 1976;27:323.
12. Dreyfuss D, Saumon G. Should the lungs be rested or recruited? The Charybdis and Scylla of ventilator management. Am J Respir Crit Care Med. 1994;149:1066.
13. Lachmann B. Open up the lung and keep the lung open. Intensive Care Med. 1992;18:319.
14. va Kaam AH, Haitsma JJ, DeJaegere, et al. Open lung ventilation improves gas exchange and attenuates secondary lung injury in a piglet model of meconium aspiration. Crit Care Med. 2004;32(2):443.
15. Falke KJ, Pontoppidan H, Kumar A, et al. Ventilation with end-expiratory pressure in acute lung disease. J Clin Invest. 1972;51:2315.
16. Suter PM, Fairley HB, Isenberg MD. Optimum end-expiratory pressure in patients with acute pulmonary failure. N Engl J Med. 1975;292:284.
17. Matamis D, Lemaire F, Harf A, et al. Total respiratory pressure-volume curves in the adult respiratory distress syndrome. Chest. 1984;86:58.
18. Benito S, Lemaire F. Pulmonary pressure-volume relationship in acute respiratory distress syndrome in adults: role of positive end-expiratory pressure. J Crit Care. 1990;5:27.
19. Dreyfuss D, Saumon G. Ventilator-induced lung injury: lessons from experimental studies. Am J Resp Crit Care Med. 1998;157:294.
20. Fernandez E, Weiner P, Meltzer E, et al. Sustained improvement in gas exchange after negative pressure ventilation for 8 hours per day on 2 successive days in chronic airflow limitation. Am Rev Respir Dis. 1991;144(2):390.
21. Skarburkis M, Rivero A, Fitchett D, et al. Hemodynamic effects of continuous negative chest pressure ventilation in heart failure. Am Rev Respir Dis. 1990;141:938.
22. Marini JJ, Capps JS, Culver BH. The inspiratory work of breathing during assisted mechanical ventilation. Chest. 1985;87(5):612.
23. Banner MJ, Kirby RR, Gabrielli A, et al. Partially and totally unloading the respiratory muscles based upon real-time measurements of work of breathing. A clinical approach. Chest. 1994:106(6):1835.
24. French CJ, Bellomo R, Buckmaster J. Effect of ventilation equipment on imposed work of breathing. Crit Care Resuscitation. 2001;3(3):148.
25. Bersten AD, Rutten AJ, Verdig AE, et al. Additional work of breathing imposed by endotracheal tubes, breathing circuits, and intensive care ventilators. Crit Care Med. 1989;17(7):671.
26. Banner MJ, Euliano NR, Brennan V, et al. Power of breathing determined non-invasively using an artificial neural network in patients with respiratory failure. Crit Care Med. 2006;34:1052–1059.
27. Banner MJ, Kirby RR, Blanch PB, et al. Decreasing imposed work of breathing apparatus to zero using pressure support ventilation. Crit Care Med. 1993;21(9):1333.
28. Kacmarek RM. The role of pressure support ventilation in reducing work of breathing. Respir Care. 1988;33(2):99.
29. Fiastro JF, Habib MP, Quan SF. Pressure support compensation for inspiratory work due to endotracheal tubes and demand continuous positive airway pressure. Chest. 1988;93(3):499.
30. Myny D, Depuydt P, Colardyn F, et al. Ventilator-associated pneumonia in a tertiary care ICU: analysis of risk factors for acquisition and mortality. Acta Clin Belg. 2005;60(3):114.
31. Jubran A. Critical illness and mechanical ventilation: effects on the diaphragm. Respir Care. 2006;51(9):1054.
32. Branson RD, Chatburn RL. Technical description and classification of modes of ventilator operation. Respir Care. 1992;37(9):1026.
33. Blanch PB, Jones MR, Layon AJ, et al. Pressure-preset ventilation, I: physiologic and mechanical considerations. Chest. 1993;104(2):590.
34. Blanch PB, Jones MR, Layon AJ, et al. Pressure-preset ventilation, II: mechanics and safety. Chest. 1993;104(3):904.
35. Hopewell PC, Murray JF. Effects of continuous positive pressure ventilation in experimental pulmonary edema. J Appl Physio. 1976;40:568.
36. Luce JM, Huang TW, Robertson HT, et al. The effects of prophylactic expiratory positive airway pressure on the resolution of oleic acid-induced injury in dogs. Ann Surg. 1983;197:327.
37. Dreyfuss D, Saumon G. The role of tidal volume, FRC and end-inspiratory volume in the development of pulmonary edema following mechanical ventilation. Am Rev Respir Dis. 1993;148:1194.
38. Smith TC, Marini JJ. Impact of PEEP on lung mechanics and work of breathing in severe airflow obstruction. J Appl Physiol. 1988;65(4):1488.
39. de Boisblanc BP. Black Hawk, please come down: reflections on a hospital's struggle to survive in the wake of Hurricane Katrina. Am Rev Respir Crit Care Med. 2005;172(10):1239.
40. Fuleihan SF, Wilson RS, Pontoppidan H. Effect of mechanical ventilation with end-expiratory pause on blood gas exchange. Anesth Anal. 1976;55:122.
41. Banner MJ, Lampotang S. Clinical use of inspiratory and expiratory waveforms. In: Kacmarek RM, Stoller JK, eds. Current Respiratory Care. Philadelphia, PA: BC Decker; 1988:139.
42. Dammann JF, McAslan TC. Optimal flow pattern for mechanical ventilation of the lungs. Crit Care Med. 1977;5:128.
43. Hedenstierna G, Johansson H. Different flow patterns and their effect on gas distribution in a lung model. Acta Anaesthesiol Scand. 1973;17:190.
44. Jansson L, Jonson B. A theoretical study of flow patterns of ventilators. Scand J Respir Dis. 1972;55:237.
45. Al-Saady N, Bennett ED. Decelerating inspiratory flow waveform improves lung mechanics and gas exchange in patients on intermittent positive-pressure ventilation. Intensive Care Med. 1985;11:68.
46. Baker AB, Colliss JE, Cowie RW. Effects of varying inspiratory flow waveforms and time in intermittent positive-pressure ventilation, II: various physiologic variables. Br J Anaesth. 1977;49:1221.
47. Johansson H, Lofstrom JB. Effects on breathing mechanics and gas exchange of different inspiratory gas flow patterns during anesthesia. Acta Anaesthesiol Scand. 1975;19:8.
48. Dreyfuss D, Soler G, Basset C, et al. High inflation pressure pulmonary edema: respective effects of high airway pressure, high tidal volume, and positive end-expiratory pressure. Am Rev Respir Dis. 1988;137:1159.
49. Dreyfuss D, Saumon G. Barotrauma is volutrauma, but which volume is the one responsible? Intensive Care Med. 1992;18:139.
50. Froese AB, Bryan AC. Effects of anesthesia and paralysis on diaphragmatic mechanics in man. Anesthesiology. 1974;41:242.
51. Downs JB, Mitchell LA. Pulmonary effects of ventilatory pattern following cardiopulmonary bypass. Crit Care Med. 1976;4:295.
52. Murphy EJ, Downs JB. Ventilator induced ventilation-perfusion mismatching. Anesthesiology. 1976;45:A345.
53. Kallet RH, Campbell AR, Dicker RA, et al. Work of breathing during lung-protective ventilation in patients with acute lung injury and acute respiratory distress syndrome: a comparison between volume and pressure-regulated breathing modes. Respir Care. 2005;50(12):1623.
54. Kirby RR, Robison E, Schultz J. Continuous flow ventilation as an alternative to assisted or controlled ventilation in infants. Anesth Analg. 1972;51:871.
55. Kirby RR, Robison E, Shultz J. A new pediatric volume ventilator. Anesth Analg. 1971;50:533.
56. Munson ES, Eger EI 2nd. Controlled ventilation in the newborn. Anesthesiology. 1963;24:871.
57. Downs JB, Klein EF, Desautels D. Intermittent mandatory ventilation: a new approach to weaning patients from mechanical ventilators. Chest. 1973;64:331.
58. Desautels DA. PEEP and open IMV systems. Respir Care. 1977;22(11):1230.
59. Bruining HA. Two simple assemblies for the application of intermittent mandatory ventilation with positive end expiratory pressure. Intensive Care Med. 1984;10(1):33.
60. Downs JB. Inappropriate applications of IMV. Chest. 1980;78(6):897.
61. Groeger JS, Levinson MR, Carlon GC. Assist control versus synchronized intermittent mandatory ventilation during acute respiratory failure. Crit Care Med. 1989;17:607.
62. Kirby RR. Synchronized intermittent mandatory ventilation versus assist control: just the facts ma'am. Crit Care Med. 1989;17:706.
63. Kirby RR, Perry JC, Calderwood HW. Cardiorespiratory effects of high end-expiratory pressure. Anesthesiology. 1975;43:533.
64. Kirby RR, Downs JB, Civetta JM. High level positive end-expiratory pressure (PEEP) in acute respiratory insufficiency. Chest. 1975;67:156.
65. Poulton TJ, Downs JB. Humidification of rapidly flowing gas. Crit Care Med. 1981;9:59.
66. Op't Holt TB. Work of breathing and other aspects of patient interaction with PEEP devices and systems. Respir Care. 1988;33(6):444.
67. Op't Holt TB, Hall MW, Bass JB, et al. Comparisons of changes in airway pressure during continuous positive airway pressure (CPAP) between demand valve and continuous flow devices. Respir Care. 1982;27(10):1200.
68. Gibney RT, Wilson RS, Pontoppidan H. Comparison of work of breathing on high gas flow and demand valve continuous positive airway pressure systems. Chest. 1982;82(6):692.
69. Henry WC, West GA, Wilson RA. A comparison of the oxygen cost of breathing between a continuous-flow CPAP system and a demand-flow system. Respir Care. 1983;28(10):1273.
70. Katz JA, Kraemer RW, Gjerde GE. Inspiratory work and airway pressure with continuous positive airway pressure delivery systems. Chest. 1985;88(4):519.
71. Shapiro BA, Harrison RA, Walton JR. Intermittent demand ventilation (IDV): a new technique for supporting ventilation in critically ill patients. Respir Care. 1976;21:521.
72. Hasten RW, Downs JB, Heenan TJ. A comparison of synchronized and nonsynchronized intermittent mandatory ventilation. Respir Care. 1980;25:554.
73. Heenan TJ, Downs JB, Douglas ME. Intermittent mandatory ventilation: is synchronization important? Chest. 1980;77:598.
74. Yang KL, Tobin MJ. A prospective study of indexes predicting the outcome of trials of weaning from mechanical ventilation. N Eng J Med. 1991;324(21):1445.
75. Esteban A, Anzueto A, Alia I, et al. How is mechanical ventilation employed in the intensive care unit? An international utilization review. Am J Respir Crit Care Med. 2000;161:1450.
76. Brochard L, Harf A, Lorino H, et al. Inspiratory pressure support prevents diaphragmatic fatigue during weaning from mechanical ventilation. Am Rev Resp Dis. 1989;33:99.
77. MacIntyre NR, Ho L-I. Effects of initial flow rate and breath termination criteria on pressure support ventilation. Chest. 1991;99:134.
78. Bolder PM, Healy EJ, Bolder AR, et al. The extra work of breathing through adult endotracheal tubes. Anesth Analg. 1986;65:853.
79. MacIntyre NR. Weaning from mechanical ventilatory support: volume-assisting intermittent breaths versus pressure-assisting every breath. Respir Care. 1988;33:121.
80. MacIntyre NR. Pressure support ventilation. Prob Crit Care. 1990;4:225.
81. Kirton OC, DeHaven B, Hudson-Civetta J, et al. Re-engineering ventilatory support to decrease days and improve resource utilization. Ann Surg. 1996;224(3):396.
82. Reynolds EOR. Effect of alterations in mechanical ventilator settings on pulmonary gas exchange in hyaline membrane disease. Arch Dis Child. 1971;46:159.
83. Spahr RC, Klein AM, Brown DR, et al. Hyaline membrane disease: a controlled study of inspiratory to expiratory ratio and its management by ventilator. Am J Dis Child. 1980;134:373.
84. Tharatt RS, Allen RP, Albertson TE. Pressure controlled inverse ratio ventilation in severe adult respiratory failure. Chest. 1988;94:755.
85. Gurevitch MJ, Van Dyke J, Young ES, et al. Improved oxygenation and lower peak airway pressure in severe adult respiratory syndrome: treatment with inverse ratio ventilation. Chest. 1986;89:211.
86. Duncan SR, Rizk NW, Raffin TA. Inverse ratio ventilation. PEEP in disguise [Editorial]? Chest. 1989;92:390.
87. Kacmarek RM, Hess D. Pressure-controlled inverse-ratio ventilation: panacea or auto-PEEP [Editorial]? Respir Care. 1990;35(10):945.
88. Pepe P, Marini JJ. Occult positive end-expiratory pressure in mechanically ventilated patients with airflow obstruction: the auto-PEEP effect. Am Rev Respir Dis. 1982;126(1):166.
89. Katz JA, Marks JD. Inspiratory work with and without continuous positive airway pressure in patients with acute respiratory failure. Anesthesiology. 1985;63:598.
90. Gherini S, Peters RM, Virgilio RW. Mechanical work on the lung and work of breathing with positive end expiratory pressure and continuous positive airway pressure. Chest. 1979;76:251.
91. Sturgeon CL, Douglas ME, Downs JB, et al. PEEP and CPAP: cardiopulmonary effects during spontaneous ventilation. Anesth Analg. 1977;56:633.
92. Kirby RR, Downs JB, Civetta JM, et al. High level positive end-expiratory pressure (PEEP) in acute respiratory failure. Chest. 1975;67(2):156.
93. Civetta JM, Kirby RR. Criteria for optimum PEEP. Respir Care. 1977;22(11):1171.
94. Rasanen J, Downs JB, DeHaven B. Titration of continuous positive airway pressure by real-time oximetry. Chest. 1987;92(5):853.
95. Mrochen H. Optimum PEEP selection using a desk top computer. Int J Biomed Comput. 1982;13(4):303.
96. Kram HB, Appel PL, Fleming AW, et al. Determination of optimum positive end-expiratory pressure by means of conjunctival oximetry. Surgery. 1987;101(3):329.
97. Rasanen J, Cane R, Downs JB, et al. Airway pressure release ventilation in severe acute respiratory failure. Crit Care Me. 1989;17:S32.
98. Banner MJ, Kirby RR, Banner TE. Airway pressure release ventilation in patients with acute respiratory failure. Crit Care Med. 1989;17(4):S32.
99. Florete O, Banner MJ, Banner TE, et al. Airway pressure release ventilation in a patient with acute pulmonary injury. Chest. 1989;96:679.
100. Stock MC, Downs JB, Frolicher DA. Airway pressure release ventilation. Crit Care Med. 1987;15:462.
101. Garner W, Downs JB, Stock MC, et al. Airway pressure release ventilation: a human trial. Chest. 1988;94:779.
102. Bratzke E, Downs JB, Smith RA. Intermittent CPAP: a new mode of ventilation during general anesthesia. Anesthesiology. 1998;89:334.
103. D'Angio CT, Chess PR, Kovacs SJ, et al. Pressure-regulated volume control vs synchronized intermittent mandatory ventilation for very low birth weight infants: a randomized controlled trial. Acrh Pediatr Adolesc Med. 2005;159(9):868.
104. Guldager H, Nielsen SL, Carl P, et al. A comparison of volume control and pressure-regulated volume control in acute respiratory failure. Crit Care. 1997;1(2):75.
105. Younes M. Proportional assist ventilation, a new approach to ventilatory support. Theory. Am Rev Respir Dis. 1992;145(1):114.
106. Younes M, Puddy A, Roberts D, et al. Proportional assist ventilation. Results of an initial clinical trial. Am Rev Respir Dis. 1992;145(1):121.
107. Giannouli E, Webster K, Roberts D, et al. Response of ventilator-dependent patients to different levels of pressure support and proportional assist. Am J Respir Crit Care Med. 1999;159(6):1716.
108. Hart N, Hunt A, Polkey MI, et al. Comparison of proportional assist ventilation and pressure support ventilation in chronic respiratory failure due to neuromuscular and chest wall deformity. Thorax. 2002;57(11):979.
109. Passam F, Hoing S, Prinianakis G, et al. Effect of different levels of pressure support and proportional assist ventilation on breathing pattern, work of breathing, and gas exchange in mechanically ventilated hypercapnic COPD patients with acute respiratory failure. Respiration. 2003;70(4):355.
110. Varelmann D, Wrigge H, Zinserling J, et al. Proportional assist versus pressure support ventilation in patients with acute respiratory failure: cardiorespiratory responses to artificially increased ventilatory demand. Crit Care Med. 2005;33(9):2125.
111. Vitacca M. New things are not always better: proportional assist ventilation vs pressure support ventilation. Intensive Care Med. 2003;29(7):1038.
112. Appendini L. Proportional assist ventilation: back to the future? Respiration. 2003;70(4):345.
113. Gervais HW, Eberle B, Konietzke D, et al. Comparison of blood gases of ventilated patients during transport. Crit Care Med. 1987;15(8):761.
114. Braman SS, Dunn SM, Amico CA, et al. Complications of intrahospital transport in critically ill patients. Ann Int Med. 1987;107(4):469.
115. Hurst JM, Davis JR, Branson RD, et al. Comparison of blood gases during transport using two methods of ventilatory support. J Trauma. 1989;29(12):1637.
116. Nakamura T, Fujino Y, Uchiyama A, et al. Intrahospital transport of critically ill patients using ventilator with patient-triggering function. Chest. 2003;123(1):159.
117. Putensen C, Mutz NJ, Putensen-Himmer G, et al. Spontaneous breathing during ventilatory support improves ventilation-perfusion distribution in patients with acute respiratory distress syndrome. Am J Respir Crit Care Med. 1999;159(4):1241.
118. Austin PN, Campbell RS, Johannigman JA, et al. Work of breathing of seven portable ventilators. Resuscitation. 2001;49(2):159.
119. Pinsky MR. Cardiovascular effects of ventilatory support and withdrawal. Anesth Analg. 1994;79:567.
120. Prewitt RM, Wood LH. Effects of positive end-expiratory pressure on ventricular function in dogs. Am J Physiol. 1972;236:H534.
121. Patten MT, Liebman PR, Hechtman HB. Humorally medicated decrease in cardiac output associated with positive end-expiratory pressure. J Microvasc Res. 1977;13:137.
122. Laver MB. The pulmonary response to trauma and mechanical ventilation: its consequences on hemodynamic function. World J Surg. 1983;7:31.
123. Beach T, Millen E, Grenvik A. Hemodynamic response to discontinuation of mechanical ventilation. Crit Care Med. 1973;1:85.
124. Robotham JL, Cherry D, Mitzner W, et al. A reevaluation of the hemodynamic consequences of intermittent positive pressure ventilation. Crit Care Med. 1983;11:783.
125. Kumar A, Pontoppidan H, Falke KJ, et al. Pulmonary barotrauma during mechanical ventilation. Crit Care Med. 1973:1:181.
126. Kirby RR. Best PEEP: issues and choices in the selection and monitoring of PEEP levels. Respir Care. 1988;33:569.
Michael R. Pinsky
This work was supported in part by the NIH grants HL67181, HL07820, and HL073198.
Key Points
1. Spontaneous ventilation is exercise.
a. Failure to wean may connote cardiovascular insufficiency.
b. Weaning is a cardiovascular stress test.
c. Breathing loads both the heart and lungs.
2. Changes in lung volume alter autonomic tone, pulmonary vascular resistance, and at high lung volumes compress the heart in the cardiac fossa in a fashion analogous to cardiac tamponade.
a. Low lung volumes increase pulmonary vasomotor tone by stimulating hypoxic pulmonary vasoconstriction.
b. High lung volumes increase pulmonary vascular resistance by increasing transpulmonary pressure.
3. Spontaneous inspiration and spontaneous inspiratory efforts decrease intrathoracic pressure.
a. Increasing venous return
b. Increasing left ventricular afterload
4. Positive pressure ventilation increases intrathoracic pressure.
a. Decreasing venous return
b. The decrease in venous return is mitigated by the associated increase in intra-abdominal pressure
c. Decreasing left ventricular afterload
d. Abolishing negative swings in intrathoracic pressure selectively reduces left ventricular (LV) afterload without reducing venous return.
Overview
Perhaps the most obvious and least understood aspect of cardiopulmonary disease is the profound and intimate relation between cardiac and pulmonary dysfunction. Heart–lung interactions go in both directions. They include the effect of the circulation on ventilation wherein acute ventricular failure causes hypoxemia and ischemic respiratory failure; and the effect of ventilation on circulation where hyperinflation can induce tamponade and spontaneous inspiration acute heart failure. Although most references to heart–lung interactions usually refer to the effect of ventilation on the circulation, the opposite interactions also exist and are relevant to the bedside clinician.
Heart–lung interactions can be grouped into interactions that involve three basic concepts that usually coexist (1,2). First, spontaneous ventilation is exercise, requiring O2 and blood flow, thus placing demands on cardiac output, and producing CO2, adding additional ventilatory stress on CO2 excretion. Second, inspiration increases lung volume above resting end-expiratory volume. Thus, some of the hemodynamic effects of ventilation are due to changes in lung volume and chest wall expansion. Third, spontaneous inspiration decreases intrathoracic pressure (ITP) whereas positive pressure ventilation increases ITP. Thus the differences between spontaneous ventilation and positive pressure ventilation primarily reflect the differences in ITP swings and the energy necessary to produce them.
The Effects of Cardiovascular Dysfunction on ventilation
Cardiogenic shock can induce hydrostatic pulmonary edema, impairing acute hypoxic respiratory failure. Circulatory shock, by limiting blood flow to the respiratory muscles, can induce respiratory muscle failure and respiratory arrest. These points underscore a fundamental aspect of ventilation, namely that it is exercise, and like any form of exercise, it must place a certain metabolic demand on the cardiovascular system (3). If cardiovascular reserve is limited, this metabolic demand may exceed the heart's ability to deliver O2 to meet the increased metabolic activity associated with spontaneous ventilation. Thus, ventilator-dependent patients with cardiovascular insufficiency may not be able to wean from mechanical ventilation because the metabolic demand of spontaneous ventilation is too great. Since this increased stress occurs only during the weaning trial, such insufficiency may not be apparent prior to weaning attempts.
Under normal conditions, respiratory muscle blood flow is not the limiting factor determining maximal ventilatory effort even with marked respiratory efforts. Although ventilation normally requires less than 5% of total O2 consumption (3), if the work of breathing is increased, such as in pulmonary edema, pulmonary fibrosis, or bronchospasm, the work cost of breathing can increase to 25% of total O2consumption (3,4,5,6). If cardiac output is limited, then blood flow to all organs including the respiratory muscles may be compromised, inducing both tissue hypoperfusion and lactic acidosis (7,8,9,10). Under these severe heart failure conditions respiratory muscle failure may develop despite high central neuronal drive (11). Supporting spontaneous ventilation by the use of mechanical ventilation will reduce O2 consumption increasing SvO2 for a constant cardiac output and arterial O2 content. Thus, intubation and mechanical ventilation in patients in severe heart failure will not only decrease the work of breathing but increase the available O2 delivery to other vital organs, decreasing serum lactate levels. These cardiovascular benefits are not limited to intubated patients but can also be seen with the noninvasive continuous positive airway pressure (CPAP) ventilation mask (12).
Ventilator-dependent patients who fail to wean during spontaneous breathing trials often have impaired baseline cardiovascular performance that may not be apparent when they are on at least partial ventilatory support (13). However, such at-risk patients can develop overt signs of heart failure only during spontaneous breathing trials. The spontaneous ventilation-induced heart failure can present abruptly with the development of acute pulmonary edema (13,14), myocardial ischemia (15,16,17,18), tachycardia, and gut ischemia (19). Since breathing is exercise, all subjects will increase their cardiac outputs in response to a spontaneous breathing trial. However, those who subsequently fail to wean demonstrate a reduction in mixed venous O2, consistent with a failing cardiovascular response to an increased metabolic demand (20). Importantly, the increased work of breathing may come from the endotracheal tube flow resistance (21). Thus, some subjects who fail a spontaneous breathing trial may actually be able to breathe on their own if extubated. Weaning from mechanical ventilatory support is a cardiovascular stress test. In fact, numerous studies have documented weaning-associated ischemic electrocardiogram (ECG) changes and thallium cardiac blood flow ventilation-related signs of ischemia in both subjects with known coronary artery disease (15) and those with normal coronaries (17,18). Using this same logic in reverse, placing patients with severe heart failure and/or ischemia on mechanical ventilatory support by either intubation and ventilation (22) or noninvasive continuous positive airway pressure (23) often reverses myocardial ischemia.
Hemodynamic effects of ventilation and ventilatory maneuvers
Ventilation can profoundly alter cardiovascular function. The specific response will be dependent on myocardial contractile and preload reserve, circulating blood volume, blood flow distribution, autonomic tone, endocrinologic responses, lung volume, intrathoracic pressure (ITP), and the surrounding pressures for the remainder of the circulation (24,25).
To understand this issue better one must understand, at least in part, the relation between airway pressure (Paw) and ITP: the transpulmonary pressure. Paw is relatively easy to measure (26,27), whereas ITP is not. Positive pressure ventilation–induced increases in Paw do not necessarily equate to proportional increases in ITP. The primary determinants of the hemodynamic responses to ventilation are due to changes in ITP and lung volume (28), not Paw. The relation between Paw, ITP, pericardial pressure (Ppc) and lung volume varies with spontaneous ventilatory effort, as well as lung and chest wall compliance. Lung expansion during positive pressure inspiration pushes on the surrounding structures, distorting them and causing their surface pressures to increase, increasing both Ppl and Ppc (29). Only lung and thoracic compliance determine the relation between end-expiratory Paw and lung volume in the sedated and paralyzed patient. However, if a ventilated patient actively resists lung inflation or sustains expiratory muscle activity at end-inspiration, then end-inspiratory Paw will exceed resting Paw for that lung volume. Similarly, if the patient activity prevents full exhalation by expiratory breaking, then for the same end-expiratory Paw, lung volume may be higher than predicted from end-expiratory Paw values. At end-expiration, if the respiratory system is at rest, Paw equals alveolar pressure and lung volume is at functional residual capacity. If incomplete exhalation occurs, then alveolar pressure will exceed Paw. The difference between measured Paw and alveolar pressure is called intrinsic positive end-expiratory pressure (PEEP). Finally, if chest wall compliance decreases, as may occur with increased abdominal pressure, both Paw and ITP will increase for the same tidal breath.
Since the heart is fixed within a cardiac fossa and cannot be displaced in any direction, juxtacardiac Ppl will increase more than lateral chest wall or diaphragmatic Ppl during inspiration. Ppc is the outside pressure to LV intraluminal ventricular pressure determining LV filling. Ppc and ITP may not be similar nor increase by similar amounts with the application of positive Paw, if the pericardium acts as a limiting membrane (30,31). With pericardial restraint, as in tamponade, Ppc exceeds juxtacardiac Ppl (32). With progressive increases in PEEP, juxtacardiac Ppl will increase toward Ppc levels, whereas Ppc will initially remain constant. Once these two pressures equalize, further increases in PEEP by increasing lung volume will increase both juxtacardiac Ppl and Ppc in parallel. Thus, if pericardial volume restraint exists, as may occur with acute cor pulmonale or tamponade, then juxtacardiac Ppl will underestimate Ppc.
The presence of lung parenchymal disease, airflow obstruction, and extrapulmonary processes that directly alter chest wall-diaphragmatic contraction or intra-abdominal pressure may also alter these interactions. Static lung expansion occurs as Paw increases because the transpulmonary pressure (Paw relative to ITP) increases. If lung injury induces alveolar flooding or increased pulmonary parenchyma stiffness, then greater increases in Paw will be required to distend the lungs to a constant end-inspiratory volume (9,29,33). Thus, the primary determinants of the increase in Ppl and Ppc during positive pressure ventilation are lung volume change and chest wall compliance, not Paw change (34). Since acute lung injury (ALI) is often nonhomogeneous, with aerated areas of the lung displaying normal specific compliance, increases in Paw above approximately 30 cm H2O will overdistend these aerated lung units (35). Vascular structures that are distended will have a greater increase in their surrounding pressure than collapsible structures that do not distend (36). Despite this nonhomogeneous alveolar distention, if tidal volume is kept constant, then Ppl increases equally, independent of the mechanical properties of the lung (33,37,38). Thus, under constant tidal volume conditions, changes in peak and mean Paw will reflect changes in the mechanical properties of the lungs and patient coordination, but may not reflect changes in ITP. Thus, one cannot predict the amount of change in ITP or Ppc that will occur in a given patient as PEEP is varied. Accordingly, assuming some constant fraction of Paw transmission to the pleural surface as a means of calculating the effect of increasing Paw on ITP is inaccurate and potentially dangerous if used to assess transmural intrathoracic vascular pressures. However, if the patient has a pulmonary artery catheter in situ, then one can estimate end-expiratory ITP. The clinician has the ability to measure on-PEEP intrathoracic vascular pressures by calculating the airway pressure transmission index to the pleural space (39) or by briefly removing PEEP while these pressures are directly measured (38). The ratio of end-inspiratory to end-expiratory pulmonary artery diastolic pressure (reflecting ITP changes) to Paw (reflecting alveolar pressure changes) defines the pulmonary transmission index. If one assumes that lung compliance is linear over the given tidal volume, then the product of this transmission index and PEEP represents the end-expiratory ITP.
Hemodynamic effects of Changes in Lung Volume
Changing lung volume alters autonomic tone, pulmonary vascular resistance, and at high lung volumes, compresses the heart in the cardiac fossa, limiting absolute cardiac volumes analogous to cardiac tamponade. However, unlike tamponade where Ppc selectively increases in excess of Ppl, with hyperinflation both juxtacardiac Ppl and Ppc increase together.
Autonomic Tone
Cyclic changes in lung volume induce cyclic changes in autonomic inflow. The lungs are richly enervated with integrated somatic and autonomic fibers that originate, traverse through, and end in the thorax. These neuronal pathways mediate many homeostatic processes through the autonomic nervous system that alter both instantaneous cardiovascular function and steady-state cardiovascular status (40,41). Lung inflation to normal tidal volumes (<10 mL/kg) induces parasympathetic withdrawal, increasing heart rate. This inspiration-induced cardioacceleration is referred to as respiratory sinus arrhythmia (42). The presence of respiratory sinus arrhythmia connotes normal autonomic control (43) and is used in diabetics with peripheral neuropathy to assess peripheral dysautonomia (44). Inflation to larger tidal volumes (>15 mL/kg) decreases heart rate by a combination of both increased vagal tone (45) and sympathetic withdrawal. The sympathetic withdrawal also creates arterial vasodilation (40,46,47,48,49,50). This inflation–vasodilatation response induces expiration-associated reductions in LV contractility in healthy volunteers (51), and in ventilator-dependent patients with the initiation of high-frequency ventilation (40) or hyperinflation (48). Humeral factors, including compounds blocked by cyclo-oxygenase inhibition (52), released from pulmonary endothelial cells during lung inflation may also induce this depressor response (53,54,55). However, these interactions do not appear to grossly alter cardiovascular status (56). Although overdistention of aerated lung units in patients with acute lung injury (ALI) may induce such cardiovascular depression, unilateral lung hyperinflation (unilateral PEEP) does not appear to influence systemic hemodynamics (57). Thus, these cardiovascular effects are of uncertain clinical significance.
Ventilation also compresses the right atrium and through this mechanical effect alters control of intravascular fluid balance. Both positive pressure ventilation and sustained hyperinflation decrease right atrial stretch stimulating endocrinologic responses that induce fluid retention. Plasma norepinephrine, plasma renin activity (58,59), and atrial naturietic peptide (60) increase during positive pressure ventilation owing to right atrial collapse. Potentially, one of the benefits of the use of nasal CPAP in patients with congestive heart failure (CHF) is to decrease plasma atrial naturietic peptide activity in parallel with improvements in blood flow (61,62). Thus, some of the observed benefit of CPAP therapy in heart failure patients may be mediated through humoral mechanisms.
Pulmonary Vascular Resistance
Ventilation alters pulmonary vascular resistance, and thus pulmonary arterial pressure. Right ventricular (RV) ejection performance is markedly limited by increases in RV ejection pressure because the right ventricle has thin walls that cannot distribute increased wall stress. Sudden increases in pulmonary arterial pressure can induce cardiovascular collapse. This is the common cause of cardiovascular collapse, for example, with massive pulmonary embolism. The mechanisms inducing changes in pulmonary vascular resistance with changing lung volume are often complex, often conflicting, and include both humoral and mechanical interactions. Increasing lung volume occurs because transpulmonary pressure increases. For example, although obstructive inspiratory efforts, as occur during obstructive sleep apnea, are usually associated with increased RV afterload, the increased afterload is due primarily to either increased vasomotor tone (hypoxic pulmonary vasoconstriction) or backward LV failure and not lung volume–induced changes in pulmonary vascular resistance (63,64). RV afterload, like LV afterload, can be defined as the maximal RV systolic wall stress during contraction (65). Thus, it is a function of the maximal product of the RV free wall radius of curvature (a function of end-diastolic volume) and transmural pressure (a function of systolic RV pressure) during ejection (66). Systolic RV pressure equals transmural pulmonary artery pressure. Increases in transmural Ppa impede RV ejection (67), decreasing RV stroke volume (68) and inducing RV dilation, and passively impede venous return (52,54). If not relieved quickly, acute cor pulmonale rapidly develops (69). Furthermore, if RV dilation and RV pressure overload persist, RV free wall ischemia and infarction can develop (70). Importantly, rapid fluid challenges in the setting of acute cor pulmonale can precipitate profound cardiovascular collapse due to excessive RV dilation, RV ischemia, and compromised LV filling.
The pulmonary vasculature constricts if alveolar PO2 (PAO2) decreases to below 60 mm Hg (71). This process of hypoxic pulmonary vasoconstriction is mediated, in part, by variations in the synthesis and release of nitric oxide by endothelial nitric oxide synthase localized on pulmonary vascular endothelial cells and in part by an NAD/NADH voltage-dependent calcium channel in the pulmonary vasculature. Hypoxic pulmonary vasoconstriction, by reducing pulmonary blood flow to hypoxic lung regions, minimizes shunt blood flow. However, if generalized alveolar hypoxia occurs, then pulmonary vasomotor tone increases, increasing pulmonary vascular resistance and impeding RV ejection (65). Importantly, at low lung volumes, alveoli spontaneously collapse as a result of loss of interstitial traction and closure of the terminal airways. This collapse causes both absorption atelectasis and alveolar hypoxia. Patients with acute hypoxemic respiratory failure have small lung volumes and are prone to spontaneous alveolar collapse (72,73). Therefore, pulmonary vascular resistance is often increased in patients with acute hypoxemic respiratory failure due to small lung volumes and atelectasis (e.g., ALI).
Mechanical ventilation may reduce pulmonary vasomotor tone, reducing pulmonary artery pressure and RV afterload by any one of many related processes. First, hypoxic pulmonary vasoconstriction can be inhibited if O2-enriched inspired gas increases PaO2 (74,75,76,77) or if the mechanical breaths and PEEP, by recruiting collapsed alveolar units, increases PaO2 in those local alveoli (28,78,79,80). Second, mechanical ventilation often reverses respiratory acidosis by increasing alveolar ventilation, which itself stimulates pulmonary vasoconstriction (77). Finally, decreasing central sympathetic output by sedation during mechanical ventilation will also reduce vasomotor tone (81,82,83).
Increases in lung volume directly increase pulmonary vascular resistance by compressing the alveolar vessels (72,79,80). The actual mechanisms by which this occurs have not been completely resolved, but appear to reflect differential extraluminal pressure gradient–induced vascular compression. The pulmonary circulation can be conceptually viewed as existing in two distinct compartments based on the pressure outside the blood vessels, which will be either alveolar pressure (alveolar vessels) or extra-alveolar or ITP (extra-alveolar vessels) (79). The small pulmonary arterioles, venules, and alveolar capillaries sense alveolar pressure as their surrounding pressure while the large pulmonary arteries and veins, as well as the heart and intrathoracic great vessels of the systemic circulation, sense interstitial pressure or ITP as their surrounding pressure. Since alveolar pressure minus ITP is the transpulmonary pressure, and increasing lung volume requires transpulmonary pressure to rise, increases in lung volume augments the extraluminal pressure gradient from extra-alveolar vessels to alveolar vessels. Increases in lung volume progressively raise alveolar vessel resistance, becoming most noticeable above functional residual capacity (FRC) (75,84) (Fig. 127.1). Since the intraluminal pressure in the pulmonary arteries is generated by RV ejection relative to ITP, but the outside pressure of the alveolar vessels is alveolar pressure, if transpulmonary pressure exceeds intraluminal pulmonary arterial pressure, then the pulmonary vasculature will collapse where extra-alveolar vessels pass into alveolar loci, reducing the vasculature cross-sectional area and increasing pulmonary vascular resistance. Hyperinflation can create significant pulmonary hypertension and may precipitate acute RV failure (acute cor pulmonale) (85) and RV ischemia (70), especially in patients prone to hyperinflation (e.g., chronic obstructive pulmonary disease [COPD]). Thus, PEEP may increase pulmonary vascular resistance if it induces lung overdistention (86). Similarly, if lung volumes are reduced, increasing lung volume back to baseline levels by the use of PEEP decreases pulmonary vascular resistance by reversing hypoxic pulmonary vasoconstriction (87).
|
|
|
Figure 127.1. Schematic diagram of the relation between changes in lung volume and pulmonary vascular resistance, where the extra-alveolar and alveolar vascular components are separated. Note that pulmonary vascular resistance is minimal at resting lung volume or functional residual capacity (FRC). As lung volume increases toward total lung capacity (TLC) or decreases toward residual volume (RV), pulmonary vascular resistance also increases. However, the increase in resistance with hyperinflation is due to increased alveolar vascular resistance, whereas the increase in resistance with lung collapse is due to increased extra-alveolar vessel tone. |
Ventricular Interdependence
Although LV preload must eventually be altered by changes in RV output because the two ventricles are in series, changes in RV end-diastolic volume can also alter LV preload by altering LV diastolic compliance by the mechanism of ventricular interdependence (88). Ventricular interdependence functions through two separate processes. First, increasing RV end-diastolic volume will induce an intraventricular septal shift into the LV, decreasing LV diastolic compliance (89). Thus, for the same LV filling pressure, RV dilation will decrease LV end-diastolic volume and, therefore, cardiac output. Second, if pericardial restraint limits absolute biventricular filling, then RV dilation will increase Ppc without septal shift (2,90). This ventricular interaction is believed to be the major determinant of the phasic changes in arterial pulse pressure and stroke volume seen in tamponade, and is referred to as pulsus paradoxus. Pulsus paradoxus can be demonstrated during loaded spontaneous inspiration in normal subjects as an inspiration-associated decrease in pulse pressure. Pulse pressure is defined as systolic minus the diastolic blood pressure. If the pulse pressure change is greater than 10 mm Hg or 10% of the mean pulse pressure, then it is referred to as pulsus paradoxus (2). Maintaining a constant rate of venous return, either by volume resuscitation (91) or vasopressor infusion (27), will minimize hyperinflation-induced cardiac compression.
Hyperinflation-induced Cardiac Compression
As lung volume increases, the heart is compressed between the expanding lungs (92), raising juxtacardiac ITP. This compressive effect of the inflated lungs can be seen with either spontaneous (93) or positive pressure–induced hyperinflation (5,38,94,95,96). As described above, both Ppc and ITP are increased and no pericardial restraint exists. This decrease in apparent LV diastolic compliance (91) was previously misinterpreted as impaired LV contractility, because LV stroke work for a given LV end-diastolic pressure or pulmonary artery occlusion pressure is decreased (97,98). However, when such patients are fluid resuscitated to return LV end-diastolic volume to its original level, both LV stroke work and cardiac output also returned to their original levels (91,99) despite the continued application of PEEP (100).
Hemodynamic Effects of Changes in Intrathoracic Pressure
The heart within the thorax is a pressure chamber within a pressure chamber. Therefore, changes in ITP must affect the pressure gradients for both systemic venous return to the RV and systemic outflow from the LV, independent of the heart itself. Increases in ITP, by increasing right atrial pressure and decreasing transmural LV systolic pressure, will reduce the pressure gradients for venous return and LV ejection, decreasing intrathoracic blood volume. Conversely, decreases in ITP will augment venous return and impede LV ejection, increasing intrathoracic blood volume. Everything else below follows from these two simple truths.
Venous Return
Blood flows back from the systemic venous reservoirs into the right atrium through low-pressure, low-resistance venous conduits (101). Right atrial pressure is the back pressure for venous return. Ventilation alters both right atrial pressure and venous reservoir pressure. It is these changes in right atrial and venous capacitance vessel pressure that induce most of the observed cardiovascular effects of ventilation. Pressure in the upstream venous reservoirs is called mean systemic pressure, and is, itself, a function of blood volume, peripheral vasomotor tone, and the distribution of blood within the vasculature (102). Usually mean systemic pressure does not change rapidly during positive pressure ventilation, whereas right atrial pressure does owing to concomitant changes in ITP. Thus, variations in right atrial pressure represent the major factor determining the fluctuation in pressure gradient for systemic venous return during ventilation (103,104). The positive pressure inspiration increases in right atrial pressure decrease the pressure gradient for venous return, decreasing RV filling (68) and RV stroke volume (68,103,105,106,107,108,109,110,111,112,113). During normal spontaneous inspiration, the opposite occurs (2,27,68,69,107,110,114,115). The detrimental effect of positive pressure ventilation on cardiac output can be minimized by either fluid resuscitation to increase mean systemic pressure (27,105,116,117) or by keeping both mean ITP and swings in lung volume as low as possible. Accordingly, prolonging expiratory time, decreasing tidal volume, and avoiding PEEP all minimize this decrease in systemic venous return to the RV (4,24,103,107,108,109,110,111,118).
However, if positive pressure ventilation–induced increases in right atrial pressure always proportionally decreased venous return, then most mechanically ventilated patients would display profound cardiovascular insufficiency, especially at higher levels of PEEP. Fortunately, when lung volumes increase the diaphragm descend, compressing the abdominal compartment and increasing intra-abdominal pressure (119,120). Since a large proportion of venous blood exists in intra-abdominal vasculature, this venous blood is pressurized as well, increasing mean systemic pressure. Accordingly, the pressure gradient for venous return is often not reduced by PEEP (116). Inspiration-induced abdominal pressurization by diaphragmatic descent is probably the primary mechanism by which the decrease in venous return is minimized during positive pressure ventilation (121,122,123,124,125). However, laparotomy, by abolishing the inspiration-associated increases in intra-abdominal pressure, makes surgery patients especially sensitive to mechanical ventilation, requiring increased fluid resuscitation to sustain a constant cardiac output. This is one of the reasons why abdominal surgery patients often leave the operating room many liters positive.
Spontaneous inspiratory efforts usually increase venous return because of the combined decrease in right atrial pressure (2,26,108,109,110) and increase in intra-abdominal pressure (119,120). However, this augmentation of venous return is limited (126,127,128) because as ITP decreases below atmospheric pressure, central venous pressure also becomes subatmospheric, collapsing the great veins as they enter the thorax and creating a flow-limiting segment (101).
Ventricular Interdependence
Changes in RV volume induce reciprocal changes in LV diastolic compliance. Although decreasing RV volume during positive pressure inspiration increases LV diastolic compliance by decreasing RV filling, the hemodynamic impact of this effect is usually minimal (88,127,128,129,130,131,132) (Fig. 127.2).
However, with spontaneous inspiration RV volumes increase, causing an immediate reduction in LV diastolic compliance. This process is the primary cause for the inspiration-associated decrease in LV stroke volume and pulse pressure (87,89,132,133). If the pulse pressure change is greater than 10 mm Hg or 10% of the mean pulse pressure, then it is referred to as pulsus paradoxus (2). Since spontaneous inspiratory efforts can also occur during positive pressure ventilation, the use of ventilation-associated pulse pressure variation during positive pressure ventilation can reflect ventricular interdependence. Presently, positive pressure–induced changes in pulse pressure and LV stroke volume have been advocated to be a useful parameter of preload responsiveness (134). However, to assess volume responsiveness using pulse pressure variation, it is essential that no spontaneous inspiratory efforts be present.
|
|
|
Figure 127.2. Schematic diagram of the effect of increasing right ventricular (RV) volumes on the left ventricular (LV) diastolic pressure–volume (filling) relationship. Note that increasing RV volumes decrease LV diastolic compliance, such that a higher filling pressure is required to generate a constant end-diastolic volume. (Adapted from Taylor RR, Corell JW, Sonnenblick EH, et al. Dependence of ventricular distensibility on filling the opposite ventricle. Am J Physiol. 1967;213:711–718.) |
LV Afterload
Changes in ITP can directly and indirectly alter LV afterload by altering both LV end-diastolic volume and ejection pressure. LV ejection pressure can be estimated as arterial pressure relative to ITP. Since baroreceptor mechanisms located in the extrathoracic carotid body maintain arterial pressure constant relative to atmosphere, if arterial pressure were to remain constant as ITP increased, then transmural LV pressure and thus LV afterload would decrease. Similarly, if transmural arterial pressure were to remain constant as ITP decreased, then LV wall tension would increase (135). Thus, under steady-state conditions increases in ITP decrease LV afterload and decreases in ITP increase LV afterload (136,137). The spontaneous inspiration–associated decrease in ITP-induced increase in LV afterload is one of the major mechanisms thought to be operative in the wean-induced LV ischemia described in the first part of this chapter since increased LV afterload must increase myocardial O2 consumption (MVO2). Thus, spontaneous ventilation not only increases global O2 demand by its exercise component (3,4,5), but also increases MVO2.
Profoundly negative swings in ITP commonly occur during forced spontaneous inspiratory efforts in patients with bronchospasm and obstructive breathing. This condition may rapidly deteriorate into acute heart failure and pulmonary edema (63) as has been described for airway obstruction (asthma, upper airway obstruction, vocal cord paralysis). Stiff lungs (interstitial lung disease, pulmonary edema, and ALI) selectively increase LV afterload and may be the cause of their LV failure and pulmonary edema (1,49,63,64), especially if LV systolic function is already compromised (13,138). Clearly, weaning from mechanical ventilation is a selective LV stress test (135,139,140). Similarly, improved LV systolic function is observed in patients with severe LV failure placed on mechanical ventilation if the mechanical breaths abolish negative swings in ITP (140).
The observed improvement in LV function seen with positive-pressure ventilation in subjects with severe heart failure is self-limited because venous return also decreases limiting total blood flow. However, the effect of removing large negative swings of ITP on LV performance will also act to reduce LV afterload but will not be associated with a change in venous return because until ITP becomes positive, venous return remains constant. Thus, removing negative ITP swings on LV afterload will selectively reduce LV afterload in a fashion analogous to increasing ITP but without the effect on cardiac output (27,101,141,142,143,144). This concept has been validated to be a very important clinical approach for patients with obstructive sleep apnea. For example, the cardiovascular benefits of positive airway pressure in nonintubated patients can be seen with CPAP therapy (145,146). Even low levels of CPAP, if they inhibit airway obstruction, will be beneficial (147,148,149). Prolonged nighttime nasal CPAP can selectively improve respiratory muscle strength, as well as LV contractile function if the patients had pre-existent heart failure (150,151). These benefits are associated with reductions of serum catecholamine levels (152).
Using Heart–Lung Interactions to Diagnose Cardiovascular Insufficiency
Since the cardiovascular response to positive pressure breathing is determined by the baseline cardiovascular state, ventilation-associated changes in arterial pulse pressure and stroke volume should monitor dynamic changes in venous return and the responsiveness of the heart to these transient and cyclic changes in preload (153). Systolic pressure variations during positive pressure ventilation nicely describe both preload responsiveness if the systolic pressure decreases below an apneic baseline value and also predict heart failure with volume overload if the systolic pressure increases above apneic baseline values (154,155,156,157). However, it is often difficult to assess if the variation in systolic arterial pressure is primarily up or down in clinical settings. A more physiologic approach is to measure arterial pulse pressure and assess pulse pressure variation (134,158). This technique can be modified to assess stroke volume variation (159) and has profound clinical potential as newer monitoring devices allow for the bedside display of both pulse pressure and stroke volume variation. In subjects on controlled mechanical ventilation, a pulse pressure variation of >13% or a stroke volume variation of >10% accurately predict preload responsiveness. This novel and exciting application of heart–lung interactions has been validated in many studies and is presently being assessed in prospective clinical trials, Assuming that this practical application of heart–lung interactions becomes commonplace, then a basic understanding of the principals described in this chapter will be an essential part of the training of acute care physicians.
References
1. Bromberger-Barnea B. Mechanical effects of inspiration on heart functions: a review. Fed Proc. 1981;40:2172–2177.
2. Wise RA, Robotham JL, Summer WR. Effects of spontaneous ventilation on the circulation. Lung. 1981;159:175–192.
3. Roussos C, Macklem PT. The respiratory muscles. N Engl J Med. 1982;307:786–797.
4. Grenvik A. Respiratory, circulatory and metabolic effects of respiratory treatment. A clinical study in postoperative thoracic surgical patients. Acta Anaesth Scand. 1966;(19 Suppl):1–122.
5. Shuey CB, Pierce AK, Johnson RL. An evaluation of exercise tests in chronic obstructive lung disease. J Appl Physiol. 1969;27:256–261.
6. Stock MC, David DW, Manning JW, et al. Lung mechanics and oxygen consumption during spontaneous ventilation and severe heart failure. Chest. 1992;102:279–283.
7. Kawagoe Y, Permutt S, Fessler HE. Hyperinflation with intrinsic PEEP and respiratory muscle blood flow. J Appl Physiol. 1994;77:2440–2448.
8. Aubier M, Vires N, Sillye G, et al. Respiratory muscle contribution to lactic acidosis in low cardiac output. Am Rev Respir Dis. 1982;126:648–652.
9. Frazier SK, Stone KS, Schertel ER, et al. A comparison of hemodynamic changes during the transition from mechanical ventilation to T-piece, pressure support, and continuous positive airway pressure in canines. Biol Res Nurs. 2000;1:253–264.
10. Magder S, Erian R, Roussos C. Respiratory muscle blood flow in oleic acid-induced pulmonary edema. J Appl Physol. 1986;60:1849–1856.
11. Vires N, Sillye G, Rassidakis A, et al. Effect of mechanical ventilation on respiratory muscle blood flow during shock. Physiologist. 1980;23:1–8.
12. Baratz DM, Westbrook PR, Shah K, et al. Effects of nasal continuous positive airway pressure on cardiac output and oxygen delivery in patients with congestive heart failure. Chest. 1992;102:1397–1401.
13. Lemaire F, Teboul JL, Cinoti L, et al. Acute left ventricular dysfunction during unsuccessful weaning from mechanical ventilation. Anesthesiology. 1988;69:171–179.
14. Richard C, Teboul JL, Archambaud F, et al. Left ventricular dysfunction during weaning in patients with chronic obstructive pulmonary disease. Intensive Care Med. 1994;20:171–172.
15. Hurford WE, Lynch KE, Strauss HW, et al. Myocardial perfusion as assessed by thallium-201 scintigraphy during the discontinuation of mechanical ventilation in ventilator-dependent patients. Anesthesiology. 1991;74:1007–1016.
16. Abalos A, Leibowitz AB, Distefano D, et al. Myocardial ischemia during the weaning period. Am J Crit Care. 1992;1:32–36.
17. Chatila W, Ani S, Guaglianone D, et al. Cardiac ischemia during weaning from mechanical ventilation. Chest. 1996;109:1421–1422.
18. Srivastava S, Chatila W, Amoateng-Adjepong Y, et al. Myocardial ischemia and weaning failure in patients with coronary disease: an update. Crit Care Med. 1999;27:2109–2112.
19. Mohsenifar Z, Hay A, Hay J, et al. Gastric intramural pH as a predictor of success or failure in weaning patients from mechanical ventilation. Ann Intern Med. 1993;119:794–798.
20. Jabran A, Mathru M, Dries D, et al. Continuous recordings of mixed venous oxygen saturation during weaning from mechanical ventilation and the ramifications thereof. Am J Respir Crit Care Med. 1998;158:1763–1769.
21. Straus C, Lewis B, Isebey D, et al. Contribution of the endotracheal tube and the upper airway to breathing workload. Am J Respir Crit Care Med. 1998;157:23–30.
22. Rasanen J, Nikki P, Heikkila J. Acute myocardial infarction complicated by respiratory failure. The effects of mechanical ventilation. Chest. 1984;85:21–28.
23. Rasanen J, Vaisanen IT, Heikkila J, et al. Acute myocardial infarction complicated by left ventricular dysfunction and respiratory failure. The effects of continuous positive airway pressure. Chest. 1985;87:156–162.
24. Cournaud A, Motley HL, Werko L, et al. Physiologic studies of the effect of intermittent positive pressure breathing on cardiac output in man. Am J Physiol. 1948;152:162–174.
25. Tyberg JV, Grant DA, Kingma I, et al. Effects of positive intrathoracic pressure on pulmonary and systemic hemodynamics. Repsir Physiol. 2000;119:171–179.
26. Milic-Emili J, Mead J, Turner JM. Improved method for assessing the validity of the esophageal balloon technique. J Appl Physiol. 1964;19:207–211.
27. Braunwald E, Binion JT, Morgan WL, et al. Alterations in central blood volume and cardiac output induced by positive pressure breathing and counteracted by metaraminol (Aramine). Circ Res. 1957;5:670–675.
28. Whittenberger JL, McGregor M, Berglund E, et al. Influence of state of inflation of the lung on pulmonary vascular resistance. J Appl Physiol. 1960;15:878–882.
29. Novak RA, Matuschak GM, Pinsky MR. Effect of ventilatory frequency on regional pleural pressure. J Appl Physiol. 1988;65:1314–1323.43. Taha BH, Simon PM, Dempsey JA, et al.
30. Kingma I, Smiseth OA, Frais MA, et al. Left ventricular external constraint: relationship between pericardial, pleural and esophageal pressures during positive end-expiratory pressure and volume loading in dogs. Ann Biomed Eng. 1987;15:331–346.
31. Tsitlik JE, Halperin HR, Guerci AD, et al. Augmentation of pressure in a vessel indenting the surface of the lung. Ann Biomed Eng. 1987;15:259–284.
32. Pinsky MR, Guimond JG. The effects of positive end-expiratory pressure on heart-lung interactions. J Crit Care. 1991;6:1–11.
33. Romand JA, Shi W, Pinsky MR. Cardiopulmonary effects of positive pressure ventilation during acute lung injury. Chest. 1995;108:1041–1048.
34. O'Quinn RJ, Marini JJ, Culver BH, et al. Transmission of airway pressure to pleural pressure during lung edema and chest wall restriction. J Appl Physiol. 1985;59:1171–1177.
35. Gattinoni L, Mascheroni D, Torresin A, et al. Morphological response to positive end-expiratory pressure in acute respiratory failure. Intensive Care Med. 1986;12:137–142.
36. Globits S, Burghuber OC, Koller J, et al. Effect of lung transplantation on right and left ventricular volumes and function measured by magnetic resonance imaging. Am J Respir Crit Care Med. 1994;149:1000–1004.
37. Scharf SM, Ingram RH Jr. Effects of decreasing lung compliance with oleic acid on the cardiovascular response to PEEP. Am J Physiol. 1977;233:H635–H641.
38. Pinsky MR, Vincent JL, DeSmet JM. Estimating left ventricular filling pressure during positive end-expiratory pressure in humans. Am Rev Respir Dis. 1991;143:25–31.
39. Teboul JL, Pinsky MR, Mercat A, et al. Estimating cardiac filling pressure in mechanically ventilated patients with hyperinflation. Crit Care Med. 2000;28:3631–3636.
40. Glick G, Wechsler AS, Epstein DE. Reflex cardiovascular depression produced by stimulation of pulmonary stretch receptors in the dog. J Clin Invest. 1969;48:467–472.
41. Painal AS. Vagal sensory receptors and their reflex effects. Physiol Rev. 1973;53:59–88.
42. Anrep GV, Pascual W, Rossler R. Respiratory variations in the heart rate, I: the reflex mechanism of the respiratory arrhythmia. Proc R Soc Lond B Biol Sci. 1936;119:191–217.
43. Respiratory sinus arrhythmia in humans: an obligatory role for vagal feedback from the lungs. J Appl Physiol. 1995;78:638–645.
44. Bernardi L, Calciati A, Gratarola A, et al. Heart rate-respiration relationship: computerized method for early detection of cardiac autonomic damage in diabetic patients. Acta Cardiol. 1986;41:197–206.
45. Persson MG, Lonnqvist PA, Gustafsson LE. Positive end-expiratory pressure ventilation elicits increases in endogenously formed nitric oxide as detected in air exhaled by rabbits. Anesthesiology. 1995;82:969–974.
46. Cassidy SS, Eschenbacher WI, Johnson RL Jr. Reflex cardiovascular depression during unilateral lung hyperinflation in the dog. J Clin Invest. 1979;64:620–626.
47. Daly MB, Hazzledine JL, Ungar A. The reflex effects of alterations in lung volume on systemic vascular resistance in the dog. J Physiol (London). 1967;188:331–351.
48. Shepherd JT. The lungs as receptor sites for cardiovascular regulation. Circulation. 1981;63:1–10.
49. Stalcup SA, Mellins RB. Mechanical forces producing pulmonary edema in acute asthma. N Engl J Med. 1977;297:592–596.
50. Vatner SF, Rutherford JD. Control of the myocardial contractile state by carotid chemo- and baroreceptor and pulmonary inflation reflexes in conscious dogs. J Clin Invest. 1978;63:1593–1601.
51. Karlocai K, Jokkel G, Kollai M. Changes in left ventricular contractility with the phase of respiration. J Auton Nerv Syst. 1998;73:86–92.
52. Said SI, Kitamura S, Vreim C. Prostaglandins: release from the lung during mechanical ventilation at large tidal ventilation. J Clin Invest. 1972;51:83a.
53. Bedetti C, Del Basso P, Argiolas C, Carpi A. Arachidonic acid and pulmonary function in a heart-lung preparation of guinea-pig. Modulation by PCO2. Arch Int Pharmacodyn Ther. 1987;285:98–116.
54. Berend N, Christopher KL, Voelkel NF. Effect of positive end-expiratory pressure on functional residual capacity: role of prostaglandin production. Am Rev Respir Dis. 1982;126:641–647.
55. Pattern MY, Liebman PR, Hetchman HG. Humorally mediated decreases in cardiac output associated with positive end-expiratory pressure. Microvasc Res. 1977;13:137–144.
56. Berglund JE, Halden E, Jakobson S, et al. PEEP ventilation does not cause humorally mediated cardiac output depression in pigs. Intensive Care Med. 1994;20:360–364.
57. Fuhrman BP, Everitt J, Lock JE. Cardiopulmonary effects of unilateral airway pressure changes in intact infant lambs. J Appl Physiol. 1984;56:1439–1448.
58. Payen DM, Brun-Buisson CJL, Carli PA, et al. Hemodynamic, gas exchange, and hormonal consequences of LBPP during PEEP ventilation. J Appl Physiol. 1987;62:61–70.
59. Frage D, de la Coussaye JE, Beloucif S, et al. Interactions between hormonal modifications during PEEP-induced antidiuresis and antinatriuresis. Chest. 1995;107:1095–1100.
60. Frass M, Watschinger B, Traindl O, et al. Atrial natriuretic peptide release in response to different positive end-expiratory pressure levels. Crit Care Med. 1993;21:343–347.
61. Wilkins MA, Su XL, Palayew MD, et al. The effects of posture change and continuous positive airway pressure on cardiac natriuretic peptides in congestive heart failure. Chest. 1995;107:909–915.
62. Shirakami G, Magaribuchi T, Shingu K, et al. Positive end-expiratory pressure ventilation decreases plasma atrial and brain natriuretic peptide levels in humans. Anesth Analg. 1993;77:1116–1121.
63. Fletcher EC, Proctor M, Yu J, et al. Pulmonary edema develops after recurrent obstructive apneas. Am J Respir Crit Care Med. 1999;160:1688–1696.
64. Chen L, Shi Q, Scharf SM. Hemodynamic effects of periodic obstructive apneas in sedated pigs with congestive heart failure. J Appl Physiol. 2000;88:1051–1060.
65. Maughan WL, Shoukas AA, Sagawa K, et al. Instantaneous pressure-volume relationships of the canine right ventricle. Circ Res. 1979;44:309–315.
66. Sibbald WJ, Driedger AA. Right ventricular function in disease states: pathophysiologic considerations. Crit Care Med. 1983;11:339.
67. Piene H, Sund T. Does pulmonary impedance constitute the optimal load for the right ventricle? Am J Physiol. 1982;242:H154–H160.
68. Pinsky MR. Determinants of pulmonary arterial flow variation during respiration. J Appl Physiol. 1984;56:1237–1245.
69. Theres H, Binkau J, Laule M, et al. Phase-related changes in right ventricular cardiac output under volume-controlled mechanical ventilation with positive end-expiratory pressure. Crit Care Med. 1999;27:953–8.
70. Johnston WE, Vinten-Johansen J, Shugart HE, et al. Positive end-expiratory pressure potentates the severity of canine right ventricular ischemia-reperfusion injury. Am J Physiol. 1992;262:H168–H176.
71. Madden JA, Dawson CA, Harder DR. Hypoxia-induced activation in small isolated pulmonary arteries from the cat. J Appl Physiol. 1985;59:113–118.
72. Hakim TS, Michel RP, Chang HK. Effect of lung inflation on pulmonary vascular resistance by arterial and venous occlusion. J Appl Physiol. 1982;53:1110–1115.
73. Quebbeman EJ, Dawson CA. Influence of inflation and atelectasis on the hypoxic pressure response in isolated dog lung lobes. Cardiovas Res. 1976;10:672–677.
74. Brower RG, Gottlieb J, Wise RA, et al. Locus of hypoxic vasoconstriction in isolated ferret lungs. J Appl Physiol. 1987;63:58–65.
75. Hakim TS, Michel RP, Minami H, et al. Site of pulmonary hypoxic vasoconstriction studied with arterial and venous occlusion. J Appl Physiol. 1983;54:1278–1302.
76. Marshall BE, Marshall C. A model for hypoxic constriction of the pulmonary circulation. J Appl Physiol. 1988;64:68–77.
77. Marshall BE, Marshall C. Continuity of response to hypoxic pulmonary vasoconstriction. J Appl Physiol. 1980;49:189–196.
78. Dawson CA, Grimm DJ, Linehan JH. Lung inflation and longitudinal distribution of pulmonary vascular resistance during hypoxia. J Appl Physiol. 1979;47:532–536.
79. Howell JBL, Permutt S, Proctor DF, et al. Effect of inflation of the lung on different parts of the pulmonary vascular bed. J Appl Physiol. 1961;16:71–76.
80. West JB, Dollery CT, Naimark A. Distribution of blood flow in isolated lung; relation to vascular and alveolar pressures. J Appl Physiol. 1964;19:713–724.
81. Fuhrman BP, Everitt J, Lock JE. Cardiopulmonary effects of unilateral airway pressure changes in intact infant lambs. J Appl Physiol. 1984;56:1439–1448.
82. Fuhrman BP, Smith-Wright DL, Kulik TJ, et al. Effects of static and fluctuating airway pressure on the intact, immature pulmonary circulation. J Appl Physiol. 1986;60:114–122.
83. Thorvalson J, Ilebekk A, Kiil F. Determinants of pulmonary blood volume. Effects of acute changes in airway pressure. Acta Physiol Scand. 1985;125:471–479.
84. Lopez-Muniz R, Stephens NL, Bromberger-Barnea B, et al. Critical closure of pulmonary vessels analyzed in terms of Starling resistor model. J Appl Physiol. 1968;24:625–635.
85. Block AJ, Boyson PG, Wynne JW. The origins of cor pulmonale, a hypothesis. Chest. 1979;75:109–114.
86. Vieillard-Baron A, Loubieres Y, Schmitt JM, et al. Cyclic changes in right ventricular output impedance during mechanical ventilation. J Appl Physiol. 1999;87:1644–1650.
87. Canada E, Benumnof JL, Tousdale FR. Pulmonary vascular resistance correlated in intact normal and abnormal canine lungs. Crit Care Med. 1982;10:719–723.
88. Taylor RR, Corell JW, Sonnenblick EH, et al. Dependence of ventricular distensibility on filling the opposite ventricle. Am J Physiol. 1967;213:711–718.
89. Brinker JA, Weiss I, Lappe DL, et al. Leftward septal displacement during right ventricular loading in man. Circulation. 1980;61:626–633.
90. Takata M, Harasawa Y, Beloucif S, et al. Coupled vs. uncoupled pericardial restraint: effects on cardiac chamber interactions. J Appl Physiol. 1997;83:1799–1813.
91. Marini JJ, Culver BN, Butler J. Mechanical effect of lung distention with positive pressure on cardiac function. Am Rev Respir Dis. 1980;124:382–386.
92. Butler J. The heart is in good hands. Circulation. 1983;67:1163–1168.
93. Cassidy SS, Wead WB, Seibert GB, et al. Changes in left ventricular geometry during spontaneous breathing. J Appl Physiol. 1987;63:803–811.
94. Hoffman EA, Ritman EL. Heart-lung interaction: effect on regional lung air content and total heart volume. Ann Biomed Eng. 1987;15:241–257.
95. Olson LE, Hoffman EA. Heart-lung interactions determined by electron beam X-ray CT in laterally recumbent rabbits. J Appl Physiol. 1995;78:417–427.
96. Jayaweera AR, Ehrlich W. Changes of phasic pleural pressure in awake dogs during exercise: potential effects on cardiac output. Ann Biomed Eng. 1987;15:311–318.
97. Cassidy SS, Robertson CH, Pierce AK, et al. Cardiovascular effects of positive end-expiratory pressure in dogs. J Appl Physiol. 1978;4:743–749.
98. Conway CM. Hemodynamic effects of pulmonary ventilation. Br J Anaesth. 1975;47:761–766.
99. Jardin F, Farcot JC, Boisante L. Influence of positive end-expiratory pressure on left ventricular performance. N Engl J Med. 1981;304:387–392.
100. Berglund JE, Halden E, Jakobson S, et al. Echocardiographic analysis of cardiac function during high PEEP ventilation. Intensive Care Med. 1994;20:174–180.
101. Guyton AC, Lindsey AW, Abernathy B, et al. Venous return at various right atrial pressures and the normal venous return curve. Am J Physiol. 1957;189:609–615.
102. Goldberg HS, Rabson J. Control of cardiac output by systemic vessels: circulatory adjustments of acute and chronic respiratory failure and the effects of therapeutic interventions. Am J Cardiol. 1981;47:696.
103. Pinsky MR. Instantaneous venous return curves in an intact canine preparation. J Appl Physiol. 1984;56:765–771.
104. Kilburn KH. Cardiorespiratory effects of large pneumothorax in conscious and anesthetized dogs. J Appl Physiol. 1963;18:279–283.
105. Chevalier PA, Weber KC, Engle JC, et al. Direct measurement of right and left heart outputs in Valsalva-like maneuver in dogs. Proc Soc Exper Biol Med. 1972;139:1429–1437.
106. Guntheroth WC, Gould R, Butler J, et al. Pulsatile flow in pulmonary artery, capillary and vein in the dog. Cardiovascular Res. 1974;8:330–337.
107. Guntheroth WG, Morgan BC, Mullins GL. Effect of respiration on venous return and stroke volume in cardiac tamponade. Mechanism of pulsus paradoxus. Circ Res. 1967;20:381–390.
108. Guyton AC. Effect of cardiac output by respiration, opening the chest, and cardiac tamponade. In: Circulatory Physiology: Cardiac Output and Its Regulation. Philadelphia, PA: WB Saunders; 1963:378–386.
109. Holt JP. The effect of positive and negative intrathoracic pressure on cardiac output and venous return in the dog. Am J Physiol. 1944;142:594–603.
110. Morgan BC, Abel FL, Mullins GL, et al. Flow patterns in cavae, pulmonary artery, pulmonary vein and aorta in intact dogs. Am J Physiol. 1966;210: 903–909.
111. Morgan BC, Martin WE, Hornbein TF, et al. Hemodynamic effects of intermittent positive pressure respiration. Anesthesiology. 1960;27:584–590.
112. Scharf SM, Brown R, Saunders N, et al. Hemodynamic effects of positive pressure inflation. J Appl Physiol. 1980;49:124–131.
113. Jardin F, Vieillard-Baron A. Right ventricular function and positive-pressure ventilation in clinical practice: from hemodynamic subsets to respirator settings. Intensive Care Med. 2003;29:1426–1434.
114. Scharf SM, Brown R, Saunders N, et al. Effects of normal and loaded spontaneous inspiration on cardiovascular function. J Appl Physiol. 1979;47:582–590.
115. Groeneveld AB, Berendsen RR, Schneider AJ, et al. Effect of the mechanical ventilatory cycle on thermodilution right ventricular volumes and cardiac output. J Appl Physiol. 2000;89:89–96.
116. Van den Berg P, Jansen JRC, Pinsky MR. The effect of positive-pressure inspiration on venous return in volume loaded post-operative cardiac surgical patients. J Appl Physiol. 2002;92:1223–1231.
117. Magder S, Georgiadis G, Cheong T. Respiratory variation in right atrial pressure predict the response to fluid challenge. J Crit Care. 1992;7:76–85.
118. Harken AH, Brennan MF, Smith N, et al. The hemodynamic response to positive end-expiratory ventilation in hypovolemic patients. Surgery. 1974;76:786–793.
119. Fessler HE, Brower RD, Wise RA, et al. Effects of positive end-expiratory pressure on the canine venous return curve. Am Rev Respir Dis. 1992;146:4–10.
120. Takata M, Robotham JL. Effects of inspiratory diaphragmatic descent on inferior vena caval venous return. J Appl Physiol. 1992;72:597–607.
121. Matuschak GM, Pinsky MR, Rogers RM. Effects of positive end-expiratory pressure on hepatic blood flow and hepatic performance. J Appl Physiol. 1987;62:1377–1383.
122. Chihara E, Hasimoto S, Kinoshita T, et al. Elevated mean systemic filling pressure due to intermittent positive-pressure ventilation. Am J Physiol. 1992;262:H1116–H1121.
123. Takata M, Wise RA, Robotham JL. Effects of abdominal pressure on venous return: abdominal vascular zone conditions. J Appl Physiol. 1990;69:1961–1972.
124. Barnes GE, Laine GA, Giam PY, et al. Cardiovascular responses to elevation of intra-abdominal hydrostatic pressure. Am J Physiol. 1985;248:R208–R213.
125. Lichtwarck-Aschoff M, Zeravik J, Pfeiffer UJ. Intrathoracic blood volume accurately reflects circulatory volume status in critically ill patients with mechanical ventilation. Intensive Care Med. 1992;18:142–145.
126. Brecher GA, Hubay CA. Pulmonary blood flow and venous return during spontaneous respiration. Circ Res. 1955;3:210–214.
127. Terada N, Takeuchi T. Postural changes in venous pressure gradients in anesthetized monkeys. Am J Physiol. 1993;264:H21–H25.
128. Scharf S, Tow DE, Miller MJ, et al. Influence of posture and abdominal pressure on the hemodynamic effects of Mueller's maneuver. J Crit Care. 1989;4:26–34.
129. Rankin JS, Olsen CO, Arentzen CE, et al. The effects of airway pressure on cardiac function in intact dogs and man. Circulation. 1982;66:108–120.
130. Robotham JL, Rabson J, Permutt S, et al. Left ventricular hemodynamics during respiration. J Appl Physiol. 1979;47:1275–1303.
131. Ruskin J, Bache RJ, Rembert JC, et al. Pressure-flow studies in man: effect of respiration on left ventricular stroke volume. Circulation. 1973;48:79–85.
132. Olsen CO, Tyson GS, Maier GW, et al. Dynamic ventricular interaction in the conscious dog. Circ Res. 1983;52:85–104.
133. Janicki JS, Weber KT. The pericardium and ventricular interaction, distensibility and function. Am J Physiol. 1980;238:H494–H503.
134. Michard F, Boussat S, Chemla D, et al. Relation between respiratory changes in arterial pulse pressure and fluid responsiveness in septic patients with acute circulatory failure. Am J Respir Crit Care Med. 2000;162:134–138.
135. Beyar R, Goldstein Y. Model studies of the effects of the thoracic pressure on the circulation. Ann Biomed Eng. 1987;15:373–383.
136. Buda AJ, Pinsky MR, Ingels NB, et al. Effect of intrathoracic pressure on left ventricular performance. N Engl J Med. 1979;301:453–459.
137. Pinsky MR, Summer WR, Wise RA, et al. Augmentation of cardiac function by elevation of intrathoracic pressure. J Appl Physiol. 1983;54:950–955.
138. Beach T, Millen E, Grenvik A. Hemodynamic response to discontinuance of mechanical ventilation. Crit Care Med. 1973;1:85–90.
139. Cassidy SA, Wead WB, Seibert GB, et al. Geometric left-ventricular responses to interactions between the lung and left ventricle: positive pressure breathing. Ann Biomed Eng. 1987;15:285–295.
140. Scharf SM, Brown R, Warner KG, et al. Intrathoracic pressure and left ventricular configuration with respiratory maneuvers. J Appl Physiol. 1989;66:481–491.
141. Sharpey-Schaffer EP. Effects of Valsalva maneuver on the normal and failing circulation. Br Med J. 1955;1:693–699.
142. Khilnani S, Graver LM, Balaban K, et al. Effects of inspiratory loading on left ventricular myocardial blood flow and metabolism. J Appl Physiol. 1992;72:1488–1492.
143. Garpestad E, Parker JA, Katayzama H, et al. Decrease in ventricular stroke volume at apnea termination is independent of oxygen desaturation. J Appl Physiol. 1994;77:1602–1608.
144. Sibbald WH, Calvin J, Driedger AA. Right and left ventricular preload, and diastolic ventricular compliance: implications of therapy in critically ill patients. In: Critical Care State of the Art. Fullerton, CA: Society of Critical Care; 1982:Vol. 3.
145. De Hoyos A, Liu PP, Benard DC, et al. Haemodynamic effects of continuous positive airway pressure in humans with normal and impaired left ventricular function. Clin Sci (Lond). 1995;88:173–178.
146. Naughton MT, Rahman MA, Hara K, et al. Effect of continuous positive airway pressure on intrathoracic and left ventricular transmural pressures in patients with congestive heart failure. Circulation. 1995;91:1725–1731.
147. Joet-Philip FF, Paganelli FF, Dutau HL, et al. Hemodynamic effects of bi-level nasal positive airway pressure ventilation in patients with heart failure. Respiration. 1999;66:136–143.
148. Lin M, Yang Y-F, Chiang H-T, et al. Reappraisal of continuous positive airway pressure therapy in acute cardiogenic pulmonary edema. Chest. 1995;107:1379–1386.
149. Buckle P, Millar T, Kryger M. The effect of short-term nasal CPAP on Cheyne-Stokes respiration in congestive heart failure. Chest. 1992;102:31–35.
150. Granton JT, Naughton MT, Benard DC, et al. CPAP improves inspiratory muscle strength in patients with heart failure and central sleep apnea. Am J Respir Crit Care Med. 1996;153:277–282.
151. Kaneko Y, Floras JS, Usui K, et al. Cardiovascular effects of continuous positive airway pressure in patients with heart failure and obstructive sleep apnea. N Engl J Med. 2003;348:1233–1241.
152. Naughton MT, Benard DC, Liu PP, et al. Effects of nasal CPAP on sympathetic activity in patients with heart failure and central sleep apnea. Am J Respir Crit Care Med. 1995;152:473–479.
153. Denault AY, Gasior TA, Gorcsan J 3rd, et al. Determinants of aortic pressure variation during positive-pressure ventilation in man. Chest. 1999;116:176–86.
154. Abel JG, Salerno TA, Panos A, et al. Cardiovascular effects of positive pressure ventilation in humans. Ann Thorac Surg. 1987;43:36–43.
155. Baeaussier M, Coriat P, Perel A, et al. Determinants of systolic pressure variation in patients ventilated after vascular surgery. J Cardiothorac Vasc Anesth. 1995;9:547–551.
156. Coriat P, Vrillon M, Perel A, et al. A comparison of systolic blood pressure variations and echocardiographic estimates of end-diastolic left ventricular size in patients after aortic surgery. Anesth Analg. 1994;78:46–53.
157. Szold A, Pizov R, Segal E, Perel A. The effect of tidal volume and intravascular volume state on systolic pressure variation in ventilated dogs. Intensive Care Med. 1989;15:368–371.
158. Michard F, Boussat S, Chemla D, et al. Relation between respiratory changes in arterial pulse pressure and fluid responsiveness in septic patients with acute circulatory failure. Am J Respir Crit Care Med. 2000;162(1):134–138.
159. Monnet X, Rienzo M, Osman D, et al. Esophageal Doppler monitoring predicts fluid responsiveness in critically ill ventilated patients. Intensive Care Med. 2005;31(9):1195–1201.