Franco Laghi
Although often life-saving, mechanical ventilation can be associated with life-threatening complications (1). Accordingly, it is essential to safely discontinue mechanical ventilation at the earliest possible time. The process of discontinuing mechanical ventilation is known as weaning. Unfortunately, different investigators and clinicians mean different things with this word. For some, weaning is the gradual reduction in ventilator support when patients are recovering from respiratory failure but are clearly not ready yet for spontaneous respiration. For others, weaning is the act of disconnecting patients from the ventilator, and for yet others, weaning constitutes both discontinuation from mechanical ventilation and extubation.
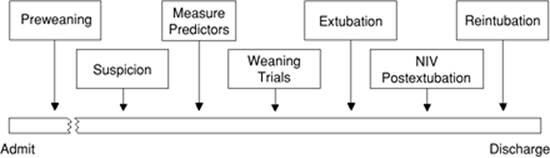
A framework of seven stages of weaning has been recently proposed (Fig. 132.1) (2). Stage 1 is preweaning, when patients are too ill to be considered ready for weaning—e.g., patients requiring high levels of oxygen (O2) and positive end-expiratory pressure (PEEP). All ventilated patients begin at stage 1. In some large series, 13% to 26% of patients never go beyond stage 1 (3,4,5). During stage 1, measurement of weaning predictors is inappropriate and potentially dangerous.
Stage 2 is the period of diagnostic triggering. This is the time when a physician begins to consider that the patient might be ready to come off the ventilator. Failure to engage in this period of diagnostic triggering may be the greatest impediment to prompt weaning (2). In more than 75% of patients who are ventilated for a week—or longer—the ventilator can be successfully discontinued the same day weaning predictors are measured (6,7). This observation raises the possibility that, in many patients, discontinuation of mechanical ventilation could have occurred a day or so earlier if physicians had considered earlier that the patient might have been ready to come off the ventilator.
Stage 3 is the time to obtain physiologic measurements that serve as predictors (weaning predictors) and to interpret them in the context of each patient's unique clinical condition. During stage 4 (weaning trial), ventilatory support is either gradually decreased over hours or days (e.g., gradual reduction in pressure support), or it is removed abruptly and completely (T-tube trial). In stage 5, patients who succeed the weaning trial are extubated. Patients who do not succeed the weaning trial are returned to ventilator support. Stages 6 and 7 apply to patients who do poorly after extubation. Stage 6 is continuation of ventilator support with noninvasive ventilation. Stage 7 is reintubation, usually accompanied by the reinstitution of mechanical ventilation (2).
This chapter will first review the pathophysiology of weaning failure, and then the clinical use of predictors of weaning outcome and techniques of weaning will be examined. Finally, extubation failure will be discussed. Areas of active research and controversial topics will be highlighted throughout the chapter.
Pathophysiology of Weaning Failure
Various disease states, alone or in combination, may cause weaning failure. From a pathophysiologic standpoint, it is useful to consider these disease states in terms of those characterized by a failure of the lungs as a gas exchange unit, and those characterized by a failure of the ventilatory pump. In a third group of patients, psychological factors may contribute to weaning failure.
Impaired Gas Exchange
Conditions characterized by failure of the lungs as a gas exchange unit include those associated with ventilation–perfusion mismatching and (less often) conditions associated with increased shunt (8). The typical consequence of impaired gas exchange is development of hypoxemia—or hypoxemia due to intrapulmonary pathologies (8). Impaired gas exchange is a common finding among patients considered for a trial of weaning. For example, the mean arterial-to-inspired oxygen ratio (PaO2/FIO2) in more than 600 patients enrolled in weaning studies of the Spanish Lung Failure Collaborative Group ranged from 200 to 335 mm Hg (7,9).
The ratio of dead space to tidal volume—an approximation of impaired gas exchange due to lung units with abnormally high ventilation–perfusion ratios—is normally about 0.30 at rest and less during exercise (10). In patients requiring prolonged mechanical ventilation, the ratio can increase to 0.74 or more (11). Patients can compensate for such an increase in dead space by increasing minute ventilation by as much as 2.5 times. Such an increase in minute ventilation poses a minor challenge when respiratory mechanics and respiratory muscles are normal; for example, hypercapnia is uncommon with pulmonary vascular disease (12). Likewise, in the presence of large shunts, increases in minute ventilation can be sufficient to prevent hypercapnia (13). Accordingly, an increase in dead space ventilation or shunt should not be considered the primary mechanisms responsible for weaning failure, unless there is a concurrent abnormality in the mechanical load of the respiratory muscles or in their contractile performance (8,12), or there are concurrent abnormalities in the control of breathing. For example, increases in dead space ventilation may develop during weaning trials as the result of rapid shallow breathing and dynamic hyperinflation (14,15). Finally, an increase in carbon dioxide production can probably only be a contributory factor and not a sole cause of weaning failure (16).
|
|
|
Figure 132.1. Seven stages of weaning. Stage 1 is preweaning, a stage that some patients never get beyond. Stage 2 is the period of diagnostic triggering, the time when a physician begins to think that the patient might be ready to come off the ventilator. Stage 3 is the time of measuring and interpreting weaning predictors. Stage 4 is the time of decreasing ventilator support (abruptly or gradually). Stage 5 is either extubation (of a weaning success patient) or reinstitution of mechanical ventilation (in a weaning failure patient). Stage 6 is use of noninvasive ventilation (NIV) after extubation. Stage 7 is reintubation. Failure to appreciate stage 2 probably leads to the greatest delays in weaning. (From Tobin MJ, Jubran A. Weaning from mechanical ventilation. In: Tobin MJ, ed. Principles and Practice of Mechanical Ventilation. New York, NY: McGraw-Hill; 2006:1185, with permission.) |
Impaired Ventilatory Pump
Impairment of the ventilatory pump can occur in conditions characterized by decreased respiratory drive, abnormal respiratory mechanics, diminished respiratory muscle performance, and impaired cardiovascular performance.
Decreased Respiratory Drive
Specific conditions such as central alveolar hypoventilation secondary to neurologic lesions (trauma, infections, infarction) can contribute to, or cause, weaning failure. In most weaning failure patients, however, estimations of respiratory drive indicate that drive is increased, and not decreased (17,18,19,20).
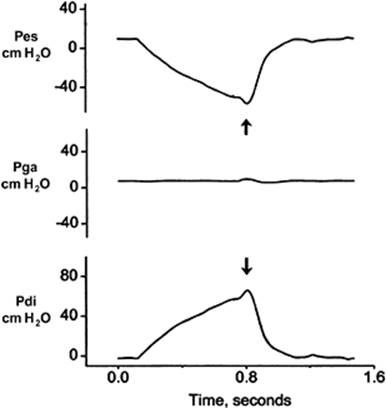
Purro et al. (21) measured airway occlusion pressure at 100 ms (P0.1) during trials of spontaneous respiration in patients who had been mechanically ventilated for more than 3 weeks. All of the weaning failures—all of whom ended up being long-term ventilator dependent—had greater P0.1 values than weaning successes. The high values of P0.1 suggest an enhanced neuromuscular* inspiratory drive (22,23,24,25). The high neuromuscular inspiratory drive, however, was poorly transformed into ventilatory output—the tidal volumes were lower in weaning failure patients than in weaning success patients—and it was associated with increased respiratory rate (21). It has been suggested that, by stimulating pulmonary or bronchial receptors (stretch or irritant), the increased mechanical load on the respiratory muscles could cause such a rapid and shallow breathing pattern (26). An elevated neuromuscular inspiratory drive in weaning failure patients does not necessarily translate into full respiratory muscle recruitment (Fig. 132.2).
In some patients, however, a decrease in drive relative to the ventilatory demands may still contribute to weaning failure. Jubran and Tobin (14) observed that 2 of 17 (12%) weaning failure patients developed acute hypercapnia during a trial of spontaneous respiration. Lung mechanics and the pressure output of the respiratory muscles of these weaning failure patients were within the range of the weaning success patients, suggesting that about 10% of patients who develop hypercapnia during a failed weaning trial may do so primarily because of (relative) respiratory center depression. Whether sleep deprivation decreases respiratory drive remains controversial (27,28).
|
|
|
Figure 132.2. Continuous recordings of esophageal pressure (Pes), gastric pressure (Pga), and transdiaphragmatic pressure (Pdi) during airway occlusion in a patient after an unsuccessful trial of spontaneous breathing. Phrenic nerve stimulation (arrow) during the maximal inspiratory effort resulted in a detectable superimposed twitch. The presence of a superimposed twitch during a maximal effort indicates that voluntary activation of the diaphragm was incomplete. (From Laghi F, Cattapan SE, Jubran A, et al. Is weaning failure caused by low-frequency fatigue of the diaphragm? Am J Respir Crit Care Med. 2003;167:120, with permission.) |
Increased Mechanical Load
Patients who fail a weaning trial usually experience an increased mechanical load (14,15,21,29,30,31,32). The patients typically have a 30% to 50% greater inspiratory resistance (14,15,32), 100% greater dynamic elastance (14,21), and 100% to 200% greater intrinsic PEEP (14,21,32) than do similar patients who are not in acute respiratory failure. Inspiratory effort is almost equally divided in offsetting intrinsic PEEP, elastic recoil, and inspiratory resistance (14,31). Abnormal mechanics arise from bronchoconstriction, bronchial edema, pulmonary edema (14), and lung inflammation (29,30). Rapid shallow breathing can aggravate the abnormalities in lung elastance, intrinsic PEEP, and carbon dioxide clearance (14,15). Expiratory muscle recruitment can also increase intrinsic PEEP (33) and breathing effort (32,34,35). Of interest, before the onset of a trial of spontaneous respiration (i.e., T-tube trial), Jubran and Tobin (36) reported that lung resistance, static elastance, and intrinsic PEEP (during passive ventilation) are equivalent in weaning failure and weaning success patients. The difference indicates that one or more factors associated with the act of spontaneous breathing is responsible for the marked difference between failure and success patients during a weaning trial (2).
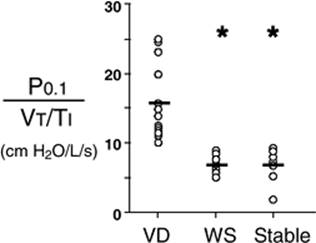
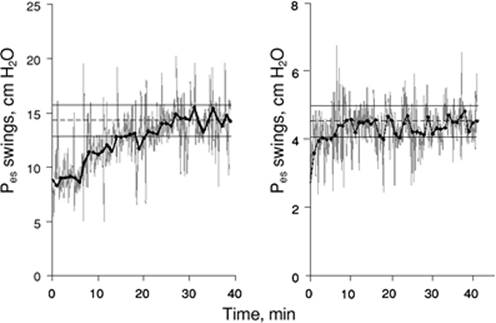
Several lines of evidence support the likelihood that increased mechanical load contributes to weaning failure. First, during spontaneous respiration, mechanical load is greater in weaning failure patients than in weaning success patients (14,21,37). Second, among six patients who required mechanical ventilation for 6 to 70 days, progression to successful weaning was associated with improvement in work of breathing per liter of minute ventilation (38); values of work of breathing per liter of minute ventilation are a function of compliance, resistance, tidal volume, and minute ventilation (38). Third, in weaning failure patients, the mean inspiratory flow—or tidal volume to inspiratory time ratio—produced for a given level of neuromuscular inspiratory drive (P0.1 to mean inspiratory flow ratio or effective inspiratory impedance) (22,39) is higher than in patients who are successfully weaned (Fig. 132.3) (21,37). The higher effective inspiratory impedance results entirely from a greater neuromuscular drive (21,37) and not from a reduced mean inspiratory flow (21). Given that, despite a greater neuromuscular drive (21,37) the mean inspiratory flow in weaning successes and weaning failures did not differ (21), indicates that for any given change in drive, the flow resistance and compliance characteristics of the respiratory system in weaning failure patients limits the capacity of neuromuscular drive to produce the otherwise expected changes in ventilation. Fourth, effective inspiratory impedance correlates with inspiratory pressure output (21). This correlation indicates a worse load-capacity balance in weaning failure patients than in weaning success patients (21).
|
|
|
Figure 132.3. Effective inspiratory impedance (P0.1/VT/TI) during periods of unassisted breathing in long-term ventilator-dependent (VD) patients with chronic obstructive pulmonary disease (COPD) (n= 12), in patients with COPD who were successfully weaned (WS) from mechanical ventilation after a period of prolonged ventilation (n = 8), and in stable patients with COPD (n = 9). Effective inspiratory impedance was less in weaning successes and in stable patients than in patients who were ventilator dependent. Asterisks, p <0.05, VD versus WS and Stable; horizontal bars, average values. (Modified from Purro A, Appendini L, De Gaetano A, et al. Physiologic determinants of ventilator dependence in long-term mechanically ventilated patients. Am J Respir Crit Care Med. 2000;161:1115.) |
Inadequate Performance of the Respiratory Muscles
Respiratory muscle weakness and respiratory muscle fatigue can decrease the capacity of these muscles to generate and sustain tension. Direct quantification of respiratory muscle tension is clinically impossible. Therefore, measurements of pressure produced by respiratory muscle contractions are used as an indirect means to determine whether inadequate performance of the respiratory muscles is responsible for weaning failure.
Respiratory Muscle Weakness
Detection of respiratory muscle weakness in critically ill patients
Measurements of airway pressure during maximal voluntary inspiratory efforts are used to evaluate global inspiratory muscle strength (40). In healthy subjects, maximum inspiratory airway pressure is usually more negative than -80 cm H2O (40). In mechanically ventilated patients recovering from an episode or acute respiratory failure, maximum inspiratory airway pressure can range from less negative than -20 cm H2O to about -100 cm H2O (5,14,21). Values of maximal airway pressure during voluntary maneuvers depend greatly on a level of motivation and comprehension of the maneuver, often not obtainable in critically ill patients. Thus, it is not surprising that, in patients requiring short-term mechanical ventilation, measurements of maximum inspiratory airway pressure commonly do not differentiate between weaning successes and weaning failure patients (5,32,38,41,42,43).
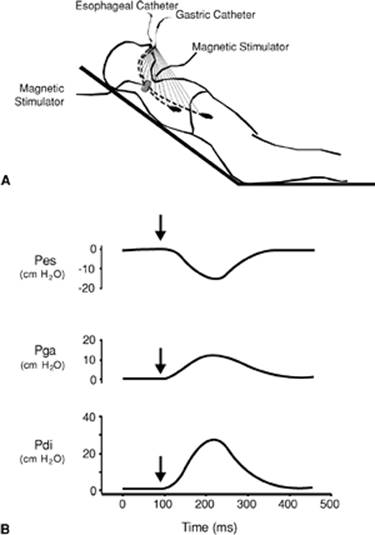
In contrast to the voluntary nature of maximal voluntary inspiratory efforts, transdiaphragmatic pressures elicited by single stimulations of the phrenic nerves—or twitch pressure—are independent of patients' motivation and eliminate the influence of the central nervous system (40). Activation can be achieved with either an electrical stimulator (44) or a magnetic stimulator (44), though the latter is easier to use in a mechanically ventilated patient (Fig. 132.4) (32,45,46).
|
|
|
Figure 132.4. Twitch pressure recordings following magnetic stimulation of the phrenic nerves. A: An esophageal and a gastric balloon catheter are passed trough the nares. Magnetic stimulation of the phrenic nerves elicits diaphragmatic contraction. B: Continuous recordings of esophageal (Pes) and gastric pressures (Pga) and transdiaphragmatic pressure (Pdi), calculated by subtracting Pes from Pga. Phrenic nerve stimulation (arrows) results in contraction of the diaphragm with consequent fall in intrathoracic pressure (negative deflection of Pes) and rise in intra-abdominal pressure (positive deflection of Pga). These swings in pressure are responsible for transdiaphragmatic twitch pressure. The smaller the transdiaphragmatic twitch pressure, the smaller the force generating capacity of the diaphragm. (From Laghi F. Hypoventilation and respiratory muscle dysfunction. In: Parillo JE, Dellinger RP, eds. Critical Care Medicine: Principles of Diagnosis and Management in the Adult. St. Louis, MO: Mosby; 3rd ed.; 2008:829, with permission.) |
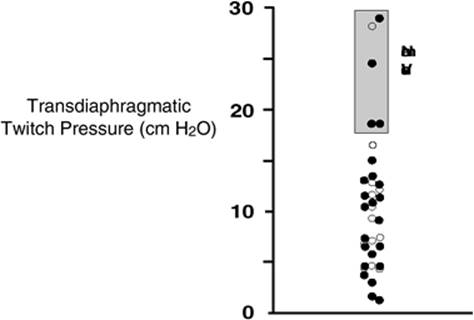
In healthy volunteers, magnetic stimulation elicits twitch pressures that average 31 to 39 cm H2O (40). In patients with severe chronic obstructive pulmonary disease (COPD), twitch pressures average 19 to 20 cm H2O (47,48). The value of transdiaphragmatic twitch pressure in patients recovering from an episode of acute respiratory failure is about half of that recorded in ambulatory patients with severe COPD (Fig. 132.5) (32,45,46). This marked reduction in twitch pressure (45,46) indicates the presence of respiratory muscle weakness in most of these patients. Respiratory muscle weakness in critically ill patients can result from pre-existing conditions or from new onset conditions.
Weakness due to pre-existing conditions
Pre-existing conditions that can cause respiratory muscle weakness include disorders such as neuromuscular diseases, malnutrition, endocrine disorders, and hyperinflation. The existence of pre-existing conditions can be clinically recognized before instituting mechanical ventilation, when ventilator support is being delivered or when the patient fails a weaning trial.
Neuromuscular Disorders
According to the level of anatomic involvement, neuromuscular disorders can be grouped in those involving the central nervous system (e.g., multiple sclerosis, amyotrophic lateral sclerosis), motor neuron (e.g., spinal cord compression, postpolio syndrome, amyotrophic lateral sclerosis), peripheral nerves (e.g., Guillain-Barré syndrome), neuromuscular junction (e.g., botulism, myasthenia gravis), and peripheral muscles (e.g., inflammatory myopathies, myotonic dystrophy, Duchenne muscular dystrophy) (23).
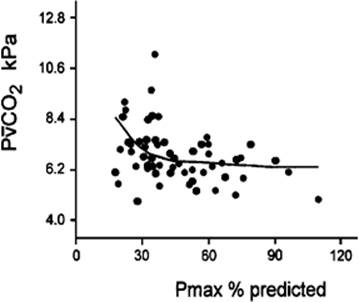
Hypercapnic respiratory failure usually occurs when respiratory muscle strength falls to 39% of the predicted normal value (49). However, Gibson et al. (50) described several patients with neuromuscular disease who had a normal partial pressure of CO2 despite decreases in respiratory muscle strength to less than 20% of predicted. Conversely, some patients with only moderate respiratory muscle weakness displayed hypercapnia (Fig. 132.6) (50). In other words, reductions in muscle strength do not consistently predict the degree of alveolar hypoventilation in this setting.
Hyperinflation
Hyperinflation is a common pre-existing problem in patients with obstructive lung diseases such as COPD (23), cystic fibrosis (51), bronchiolitis (52), and lymphangioleiomyomatosis (23). The severity of pre-existing hyperinflation commonly worsens in patients experiencing an exacerbation of COPD (15). Hyperinflation can also occur de novo in patients with pneumonia, acute respiratory distress syndrome, and chest trauma (15,53). Indirect evidence of hyperinflation has been reported in patients who fail a weaning trial (14,15,17,33,54,55).
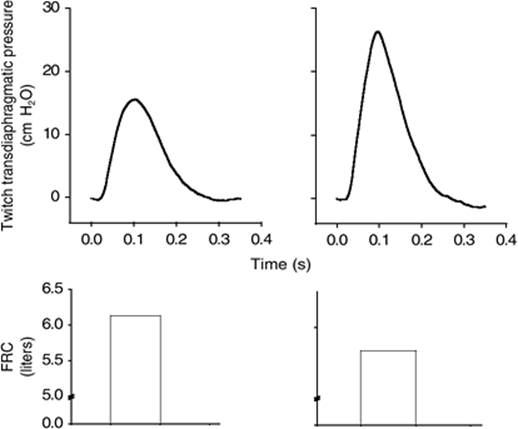
Hyperinflation has several adverse effects on inspiratory muscle function: the inspiratory muscles operate at an unfavorable position of the length-tension relationship (Fig. 132.7) (56); flattening of the diaphragm decreases the size of the zone of apposition with the result that diaphragmatic contraction causes less effective rib cage expansion (23). Hyperinflation also has an adverse effect on the elastic recoil of the thoracic cage (23). This means that the inspiratory muscles must work not only against the elastic recoil of the lungs but also against that of the thoracic cage. The functional consequences of dynamic hyperinflation are probably the main causes of ventilatory failure in patients with COPD (57). Impairment of inspiratory muscle function as a consequence of hyperinflation, however, is less likely in patients with acute respiratory distress syndrome because these patients breathe at a low lung volume despite dynamic hyperinflation (53,58).
Malnutrition
Malnutrition is highly prevalent among critically ill patients requiring mechanical ventilation (59,60) and is associated with poor prognosis (60). Malnutrition decreases muscle mass and respiratory muscle strength both in humans (61,62) and laboratory animals (63,64,65).
In patients with COPD, inspiratory muscle strength is about 30% less in poorly nourished patients than in well-nourished patients with equivalent airway obstruction (66). Similarly, malnourished patients with anorexia nervosa can present with inspiratory muscle strength reduced to 35% to 50% of predicted (62), impaired respiratory muscle endurance (67), impaired hypercapnic ventilatory response (67), and, occasionally, with hypercapnia at rest (62). In malnourished patients, inspiratory weakness (62,66,67), fatigability (66), and dyspnea (66) are partially reversible with nutritional support. The process is slow and, in laboratory animals, can take months of refeeding for muscle mass to return to normal values (68). To date, it remains unclear whether malnutrition by itself can cause sufficient respiratory muscle weakness to cause weaning failure. It is more likely for malnutrition to be a contributory factor and not a sole cause of weaning failure.
|
|
|
Figure 132.5. Transdiaphragmatic twitch pressure recorded in mechanically ventilated patients recovering from an episode of acute respiratory failure. Box represents range of transdiaphragmatic twitch pressures recorded in ambulatory patients with severe chronic obstructive pulmonary disease (COPD). Most mechanically ventilated patients had evidence of diaphragmatic weakness. (Data from Cattapan SE, Laghi F, Tobin MJ. Can diaphragmatic contractility be assessed by airway twitch pressure in mechanically ventilated patients? Thorax. 2003;58:58 [open circles]; and from Watson AC, Hughes PD, Louise HM, et al. Measurement of twitch transdiaphragmatic, esophageal, and endotracheal tube pressure with bilateral anterolateral magnetic phrenic nerve stimulation in patients in the intensive care unit. Crit Care Med. 2001;29:1325 [closed circles], with permission.) (Modified from Laghi F. Assessment of respiratory output in mechanically ventilated patients. Respir Care Clin N Am. 2005;11:173.) |
|
|
|
Figure 132.6. Relationship between muscle strength and mixed venous partial pressure of CO2 (PvCO2) in patients with respiratory muscle weakness due to myotonic dystrophy and a variety of nonmyotonic muscle diseases. Respiratory muscle strength is the arithmetic sum of maximum static inspiratory and expiratory mouth pressures (Pmax = PImax + PEmax). As respiratory muscle weakness became more severe PvCO2 increased, although considerable variability was observed among patients. (Modified from Gibson GJ, Gilmartin JJ, Veale D, et al: Respiratory muscle function in neuromuscular disease. In Jones NL, Killian KJ, editors: Breathlessness. The Campbell Symposium. Hamilton, Ontario, 1992. Boehringer-Ingelheim) |
Endocrine Disturbances
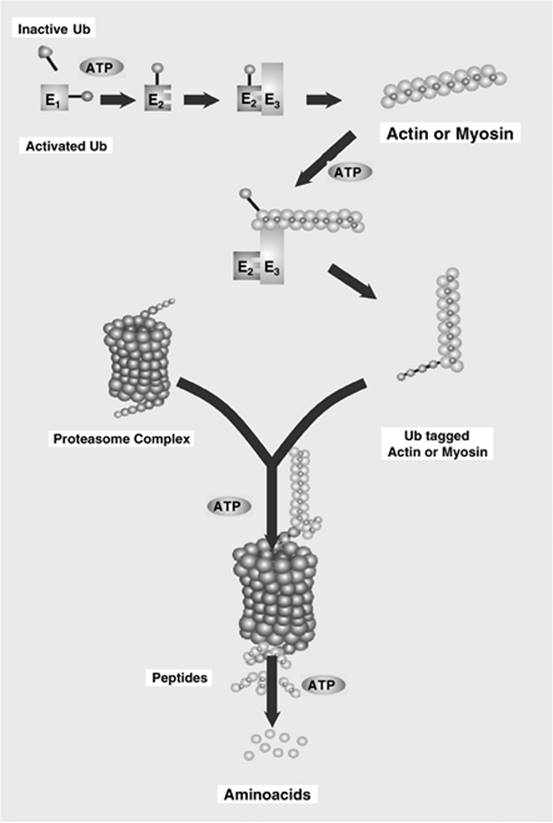
Endocrine disturbances, such as hypothyroidism (69), hyperthyroidism (70,71,72,73), and acromegaly (74), can adversely affect respiratory muscle function. Proteolysis of myofibrillar proteins by the ubiquitin/proteasome proteolytic system (75) (Fig. 132.8) is probably responsible for respiratory muscle catabolism and weakness of hyperthyroidism (70). This mechanism is implicated in the muscle wasting associated with acidosis, renal failure, denervation, cancer, diabetes, AIDS, trauma, and burns (75). In contrast to other endocrine disturbances, respiratory muscle weakness is unusual in patients with Cushing syndrome (76).
Weakness due to new-onset conditions
New-onset respiratory muscle weakness in critically ill patients may result from conditions that are unique to these patients and that include ventilator-associated respiratory muscle dysfunction, sepsis-associated myopathy, and intensive care unit (ICU) acquired paresis. New-onset respiratory muscle weakness may also result from conditions that are not unique to critically ill patients and that include acid-base disorders, electrolyte disturbances, decreased oxygen delivery, or medications. Respiratory muscle weakness due to conditions that are unique to critically ill patients are often associated with alterations in respiratory muscle structure, whereas the others are not necessarily so associated. Recovery from respiratory muscle weakness, if it occurs at all, is slow when the weakness is caused by alterations in muscle structure. In contrast, recovery of respiratory muscle weakness in conditions that are not necessarily associated with alterations in muscle structure is usually rapid once the underlying triggering factor has been corrected.
|
|
|
Figure 132.7. Twitch transdiaphragmatic pressure elicited by phrenic nerve stimulation (top) and functional residual capacity (FRC) (bottom) in a patient with severe emphysema before (left) and after (right) lung volume reduction surgery. The increase in transdiaphragmatic pressure after surgery was in part due to a decrease in the operating lung volume as demonstrated by the decrease in functional residual capacity. (Data from Laghi F, Jubran A, Topeli A, et al. Effect of lung volume reduction surgery on neuromechanical coupling of the diaphragm. Am J Respir Crit Care Med. 1998;157:475.) |
Ventilator-Associated Respiratory Muscle Dysfunction
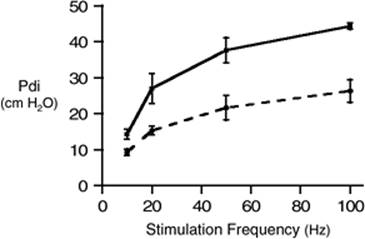
In laboratory animals, controlled mechanical ventilation delivered for 1 to 11 days can decrease diaphragmatic force generation by 20% to more than 50% (Fig. 132.9) (77,78,79,80,81,82,83) and it can cause similar decreases in diaphragmatic endurance (82). The reduction in force has been related to the extent of myofibril damage and mitochondrial swelling (rabbits) (79) and with a decrease in muscle fibers expressing type I myosin isoforms (rats) (Table 132.1) (78). Impaired membrane depolarization or impaired excitation/contraction coupling may contribute to ventilator-associated respiratory muscle dysfunction (81).
Several mechanisms, including structural injury (79,84,85), oxidative stress (86,87,88,89), muscle fiber remodeling (78,88,90), muscle atrophy (78,83,88,91,92)—with the attendant reduction in myofibril synthesis (93) and increased myofibril proteolysis (88,92)—appear to be responsible for ventilator-associated respiratory muscle dysfunction. Use of antioxidants may prevent the muscle damage that results from mechanical ventilation (86). For instance, in a study of more than 200 critically ill patients, 80% of whom required acute ventilator support, duration of mechanical ventilation was nearly 3 days shorter in those who completed a 10-day antioxidant supplementation protocol (vitamin E and vitamin C) than in those who completed a 10-day course of placebo (94). Similar results have been reported in critically ill surgical patients requiring mechanical ventilation (95). Whether the decrease in duration of mechanical ventilation in these studies was due, at least in part, to the (potential) positive effects of antioxidants on the respiratory muscles remains to be demonstrated.
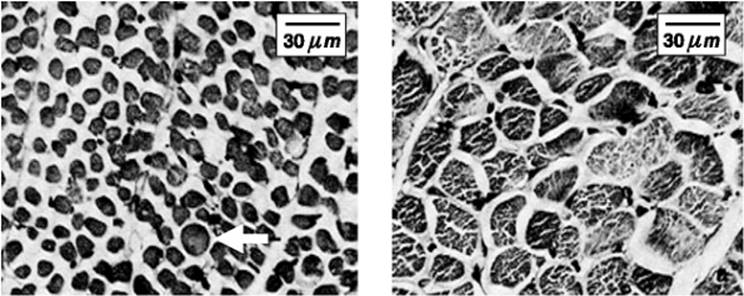
It is unclear if ventilator-associated respiratory muscle dysfunction occurs in humans. In a retrospective study of 13 infants who received uninterrupted ventilator assistance for at least 12 days before death, most diaphragmatic fibers appeared atrophic (Fig. 132.10) (96). The development of atrophy was suggested by a smaller diaphragmatic muscle mass in these infants than in 26 infants who died after receiving mechanical ventilation for 7 days or less (96). These data are supported by a recent preliminary report of Levine et al. (97) who compared costal diaphragm biopsies of six brain-dead organ donors maintained on controlled mechanical ventilation for 18 to 72 hours with those of nine patients ventilated for less than 2 hours during surgery (to remove solitary pulmonary nodules). In this preliminary report, prolonged controlled mechanical ventilation was associated with 40% atrophy of slow fibers and 36% atrophy of fast fibers (97). Atrophy was coupled with increased ubiquitin–proteasome proteolysis (Fig. 132.8) (92).
Considering that decreases in protein synthesis seem to contribute to ventilator-associated respiratory muscle dysfunction (92,93), it would seem biologically plausible that administration of anabolic factors, such as growth hormone, might be of benefit in ventilated patients. Unfortunately, when growth hormone has been administered to patients requiring prolonged mechanical ventilation, duration of mechanical ventilation was not decreased nor was muscle strength increased (98). Of concern was the report that recombinant growth hormone can increase mortality of critically ill patients (99).
Sepsis-Associated Myopathy
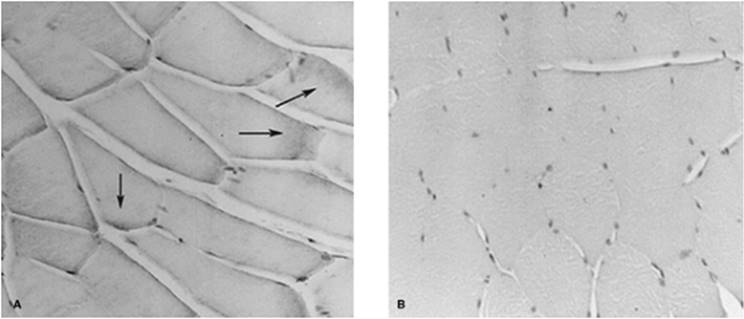
Sepsis, a common occurrence in critically ill patients, can produce ventilatory failure by causing respiratory muscle dysfunction and increased metabolic demands (100). Septic animals develop failure of neuromuscular transmission (due to increased sarcolemmal electric potential) (101,102,103) and failure of excitation/ contraction coupling (100,104). Mechanisms responsible for failure of excitation/contraction coupling include the cytotoxic effect of free radicals (105,106,107,108), ubiquitin/proteasome proteolysis (70,75,100,109,110,111), the cytotoxic effect of nitric oxide (Fig. 132.11) (102) and its metabolites (112,113), and a decrease in mitochondrial content with associated reduction in energy-rich phosphates (114).
|
|
|
Figure 132.8. Ubiquitin/proteasome degradation of contractile proteins. The first step in degradation of actin and myosin is activation of ubiquitin (Ub) by a first enzyme, E1, a process requiring ATP (adenosine triphosphate). Activated ubiquitin interacts with a second enzyme, E2, a carrier protein. Ub and E2 join a third enzyme, E3. E3 transfers activated Ub to actin and myosin. The cycle is repeated until a chain of Ub is bound to the contractile proteins. The chain of Ub binds to one end of a proteasome complex in a process requiring ATP. The Ub chain is subsequently removed (allowing reuse of Ub), and actin and myosin are unfolded and pushed into the core of the proteasome. Multiple enzymes within the core degrade actin and myosin into small peptides. The peptides are extruded from the proteasome and degraded to amino acids by peptidases in the cytoplasm. The ubiquitin/proteasome system degrades myofibrillar proteins only after they have been cleaved and released by other proteolytic pathways—i.e., the ubiquitin/proteasome pathway cannot degrade intact myofibrillar proteins. (From Laghi F, Tobin MJ. Disorders of the respiratory muscles. Am J Respir Crit Care Med. 2003;168:10, with permission.) |
To determine whether the inducible nitric oxide synthase pathway contributes to impaired skeletal muscle contractility in septic patients, Lanone et al. (115) obtained samples of the rectus abdominis in 16 septic patients and 21 control subjects. The muscles of the patients had lower contractile force and increases in inducible nitric oxide synthase expression (mRNA and protein) and activity. Immunohistochemical studies revealed the generation of peroxynitrite (a highly reactive oxidant formed by the reaction of nitric oxide with superoxide anion). Exposure of control muscles to the amount of peroxynitrite found in patients caused an irreversible decrease in force generation. These data suggest that one of the mechanisms by which sepsis decreases muscle force is through the production of nitric oxide and its toxic byproducts.
Intensive Care Unit Acquired Paresis
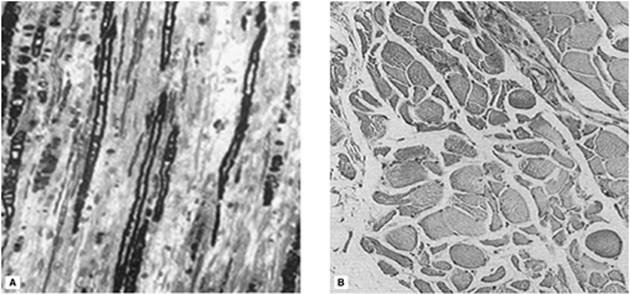
While cared for in the ICU, critically ill patients can develop muscle weakness and, occasionally, paralysis. Some of these patients have evidence for axonal degeneration and denervation atrophy (Fig. 132.12) (23). This constellation of findings is known as critical illness polyneuropathy (Table 132.2) (116). Sensory involvement is usually more limited than motor involvement (117). Critical illness polyneuropathy has been considered one of the manifestations of multiple organ failure syndrome (118). Sepsis and multiple organ failure, though, are not essential prerequisites for the development of critical illness polyneuropathy (119,120). Tight control of hyperglycemia may reduce the risk of polyneuropathy and the duration of mechanical ventilation (121). It has been speculated that the known neurotoxic effects of hyperglycemia play a role in the development of critical illness polyneuropathy, and that the anti-inflammatory and neuroprotective effects of insulin contribute to the protective effects of tight hyperglycemic control (118). The administration of corticosteroids has not been linked with an increased risk of developing critical illness polyneuropathy (122,123).
|
|
|
Figure 132.9. Transdiaphragmatic pressure (Pdi) response to phrenic nerve stimulation before (solid line) and after 11 days (dashed line) of mechanical ventilation. That the transdiaphragmatic pressure recorded after 11 days of mechanical ventilation shows a decrease response to all stimulation frequencies is suggestive of ventilator-associated diaphragmatic dysfunction. (Modified from Anzueto A, Peters JI, Tobin MJ, et al. Effects of prolonged controlled mechanical ventilation on diaphragmatic function in healthy adult baboons. Crit Care Med, 1997;25:1187.) |
In some ICU patients with muscle weakness or paralysis, rather than axonopathy, there is evidence of isolated myopathy (critical illness myopathy) (23). Patients developing isolated myopathy often have been treated with steroids and neuromuscular blocking agents (e.g., patients with status asthmaticus) (23). Muscle biopsies demonstrate a general decrease in myofibrillar protein content and a selective loss of thick filaments (myosin) within type I and type II fibers (Fig. 132.13). Although a decrease in thick-filament proteins may be important for prolonged weakness (124), this decrease is probably not the cause of the acute paralysis (125), particularly in patients with compound motor action potentials of low amplitude (126). Impaired muscle membrane excitability is probably more important during the acute stage (124,127). Subtypes of critical illness myopathy (128), including rhabdomyolysis and frank myonecrosis, have been occasionally reported (Fig. 132.14) (117,118,129,130). Experimental data in laboratory animals (131) and in critically ill patients (124,132,133) suggest that critical illness myopathy may result from several coexisting processes including a decrease in mRNA substrates for actin and myosin due to pretranslational defects (131), decrease in myosin mRNA (124), induction of myofiber-specific ubiquitin/proteasome pathways (132), and local immune activation (133).
In the last few years, it has become increasingly apparent that critical illness neuropathy and myopathy often coexist (120,122,127,130,132,133,134,135,136). It has become common to refer to patients who become weak while in the ICU, as a result of acquired neuropathy and/or myopathy (not associated with a known disorder), as simply having critical illness neuromyopathy or, more simply, ICU-acquired paresis (127,132,136). ICU-acquired paresis has been reported to be an independent risk factor of prolonged weaning (136,137) and to be associated with respiratory muscle weakness (138).
|
Table 132.1 Characteristics of Types of Muscle Fibers |
|||||||||||||||||||||||||||||||||||||||||||||||||||||||||||||||||||||||||||
|
|||||||||||||||||||||||||||||||||||||||||||||||||||||||||||||||||||||||||||
|
|
|||||||||||||||||||||||||||||||||||||||||||||||||||||||||||||||||||||||||||
|
Figure 132.10. Photomicrographs of transverse sections of diaphragm from an infant ventilated from birth until death at day 47 (left) and from an infant ventilated from birth until accidental death at day 3 (right). Prolonged mechanical ventilation was associated with reduction in myofiber cross-sectional area. (The arrow in the left panel indicates a developing myofiber also known as Wohlfart myofiber.) (Modified from Knisely AS, Leal SM, Singer DB. Abnormalities of diaphragmatic muscle in neonates with ventilated lungs. J Pediatr. 1988;113:1074.) |
|||||||||||||||||||||||||||||||||||||||||||||||||||||||||||||||||||||||||||
The functional outcome of ICU-acquired paresis is not uniform. Among long-term survivors of prolonged critical illness with an ICU stay of at least 4 weeks (117), neurophysiologic evidence of critical illness polyneuropathy has been recorded in 95% of patients up to 5 years following ICU discharge. Although all patients report extreme weakness after ICU and hospital discharge (117), 50% to 60% of them experience complete clinical recovery (ability to breathe spontaneously and to walk independently) over a period of 2 weeks to 6 months or longer (124,137,139). Yet, 10% to 30% experience severe persistent disability, and some patients continue to be paraparetic or paraplegic, or tetraparetic or tetraplegic (117,140). Other investigators report even worse outcome: only two of ten patients left the hospital in one study (130). Whether it is possible to prevent ICU-acquired paresis in patients recovering from severe acute illness and whether that would result in shorter duration of mechanical ventilation remains unknown.
|
|
|||||||||||||||||||||||||||||||||||||||||||||
|
Figure 132.11. A: A sample of gastrocnemius muscle obtained from an adult Sprague-Dawley rat injected 12 hours earlier with E. coli endotoxin (20 mg/kg). The section was stained with an antibody to inducible nitric oxide synthase. Positive staining (dark gray staining; arrows) is evident inside the fibers. B: A sample of gastrocnemius muscle obtained from a rat injected 12 hours earlier with normal saline. No positive staining is evident. (Photomicrographs provided by Dr. Sabah N. Hussain, Royal Victoria Hospital, Montreal, Canada.) (From Laghi F, Tobin MJ. Disorders of the respiratory muscles. Am J Respir Crit Care Med. 2003;168:10, with permission.) |
|||||||||||||||||||||||||||||||||||||||||||||
|
Table 132.2 Electromyographic findings |
|||||||||||||||||||||||||||||||||||||||||||||
|
|||||||||||||||||||||||||||||||||||||||||||||
|
|
|
Figure 132.12. Transverse section of a peripheral motor nerve (deep peroneal nerve, left) and of a skeletal muscle (intercostal, right) in patients who developed profound weakness following a prolonged hospital course characterized by sepsis, multiple organ failure syndrome, and inability to wean from mechanical ventilation. Left: The long thin dark structures are myelin sheaths that contain axons. The axons are degenerating and dying. And, following death, they disintegrate. The myelin surrounding the disintegrating axons collapses around the axonal debris to form ovoids of myelin, seen better on the lateral portions of the micrograph. Right: Amid muscle fibers that are normal in size and shape there are atrophic ones that appear small and that have developed contours with acute angles. These findings are consistent with denervation atrophy secondary to axonal degeneration—so-called critical illness polyneuropathy. (Modified from Zochodne DW, Bolton CF, Wells GA, et al. Critical illness polyneuropathy. A complication of sepsis and multiple organ failure. Brain. 1987;110:819.) |
|
|
|
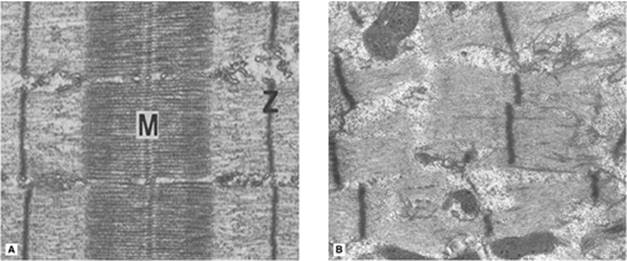
Figure 132.13. Electron micrographs of normal skeletal muscle (left) and skeletal muscle from a patient who received steroids and the neuromuscular blocking agent vecuronium during a hospitalization with status asthmaticus followed by flaccid quadriplegia (right). Compared with the normal structure, the patient developed extensive loss of thick (myosin) myofilaments and relative preservation of thin (actin) filaments. Muscle strength returned to normal 3 months after discontinuation of vecuronium. M, M-line formed by myosin filaments and M-line proteins; Z, Z-disk formed by a lattice of filaments that join the actin filaments of one sarcomere with the actin filaments of the adjacent sarcomere. (Modified from Eisenberg BR. In: Bradley WG, Gardner-Medwin D, Walton JN, eds. Recent Advances in Myology. Amsterdam, the Netherlands: Excerpta Med; 1975, with permission; and from Danon MJ, Carpenter S. Myopathy with thick filament (myosin) loss following prolonged paralysis with vecuronium during steroid treatment. Muscle Nerv. 1991;14:1131, with permission.) |
|
|
|
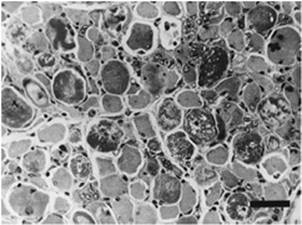
Figure 132.14. Transverse section of a peripheral skeletal muscle (rectus femoris) in a critically ill patient with necrotizing myopathy of the intensive care unit. Several muscle fibers demonstrate an obvious panfascicular destructive process. The destructive process is associated with myophagocytosis and small, regenerating muscle fibers that contain groups of vesicular nuclei and prominent nucleoli. Bar, 50 µm. (From Ramsay DA, Zochodne DW, Robertson DM, et al. A syndrome of acute severe muscle necrosis in intensive care unit patients. J Neuropathol Exp Neurol. 1993;52:387, with permission.) |
Acid-Base Disorders
Alkalosis, either metabolic or respiratory, does not affect skeletal muscle strength (141,142,143) and may improve endurance (141). Whether acidosis, either metabolic (144,145,146,147,148,149,150,151,152) or respiratory (142,143,145,153,154,155,156), impairs respiratory muscle function remains controversial.
Electrolyte Disturbances
Respiratory muscle function may be impaired by decreased levels of phosphate (157), calcium (158), magnesium (159), and potassium (160).
Medications
Weakness can result from medications that have a direct myotoxic effect, such as blockade of myocyte glycoprotein synthesis and electron transport caused by statins (inhibitors of the hydroxy-methylglutaryl coenzyme A reductase) used in patients with hyperlipidemia or nucleoside analogues used in patients with human immunodeficiency virus (161,162,163,164). Weakness can also result with neuromuscular blocking agents and aminoglycosides, which interfere with neuromuscular transmission (165,166).
In acutely ventilated patients, paralysis (including the respiratory muscles) can persist after discontinuation of neuromuscular blocking agents (166,167,168). Prolonged blockade is estimated to occur in 12% to 44% of patients receiving pancuronium or vecuronium for 1 or more days (166,167,168). Accumulation of metabolites of the neuromuscular blocking agents is responsible for the prolonged blockade (166). Risk factors for prolonged blockade include renal and/or hepatic failure (depending on the agent used), hypermagnesemia, metabolic acidosis, female gender, and the concomitant use of various antibiotics, including aminoglycosides and clindamycin (118,166).
Repetitive nerve stimulation demonstrates a decrement of the compound muscle action potential (Table 132.2). Recovery from prolonged neuromuscular blockade is usually reported to begin within 2 days of the last dose (166,167), which contrasts with the prolonged course of critical illness myopathy or neuropathy (124,139,140,169). It is thus unlikely, if not impossible, for prolonged neuromuscular blockade to cause long-term ventilator dependence (170,171). Dosing neuromuscular blocking agents with the assistance of a peripheral nerve stimulator (monitoring of train-of-four) (172) may be associated with faster recovery of neuromuscular function and spontaneous respiration (168). Treatment consists primarily of waiting for clearance of the neuromuscular blocking agents or their metabolites (118). Reversal of neuromuscular blockade with a cholinesterase has been used to establish a diagnosis. In the presence of high concentrations of neuromuscular blocking agents—or their metabolites—recovery is usually incomplete or transitory (118).
|
|
|
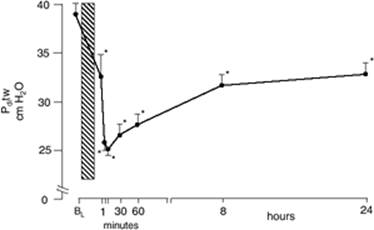
Figure 132.15. Induction of diaphragmatic fatigue (vertical box) produced a significant fall in transdiaphragmatic pressure (Pdi) elicited by twitch stimulation of phrenic nerves. Significant recovery of twitch pressure was noted in the first 8 hours after completion of the fatigue protocol; no further change was observed between 8 and 24 hours, and the 24-hour value was significantly lower than baseline. The delay in reaching the nadir of twitch transdiaphragmatic pressure probably results from twitch potentiation, induced by repeated contractions, which was present at the end of the protocol. Values are mean ± SE. *Significant difference compared with baseline value, p <0.01. (From Laghi F, D'Alfonso N, Tobin MJ. Pattern of recovery from diaphragmatic fatigue over 24 hours. J Appl Physiol. 1995;79:539, with permission.) |
Limitations in the current classification of respiratory muscle weakness
When studying respiratory muscle weakness leading to weaning failure, it is necessary to bear in mind the current limited understanding of these conditions. First, the distinction between pre-existing conditions and new-onset conditions can be arbitrary. Second, conditions that are pre-existing—malnutrition and hyperinflation—can worsen during the course of an unrelated critical illness. Third, the nosology is often unsatisfactory: consider the nebulous distinction between ICU-acquired paresis and sepsis-associated myopathy, or between ICU-acquired paresis and ventilator-associated respiratory muscle dysfunction. Fourth, conditions in which respiratory muscle weakness is associated with muscle damage can also display some degree of muscle atrophy: consider diaphragmatic atrophy in cases of ventilator-associated respiratory muscle dysfunction. Fifth, available diagnostic tools have limited specificity in differentiating the various conditions that may cause weakness in the ICU. Sixth, in any given patient, more than one mechanism may be responsible for respiratory muscle weakness. Last, respiratory muscle weakness can be combined with a depressed drive—for example, in the setting of hypercapnia-induced hypoventilation (23).
|
|
|
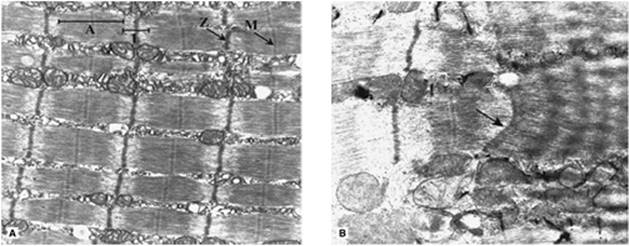
Figure 132.16. Electron micrographs of longitudinal sections from the costal diaphragm of a healthy control hamster (left) and a hamster exposed to 6 days of resistive loading (right). Left: Normal sarcomeres with distinct A-bands, I-bands, Z-bands, and M-lines that are aligned between adjacent myofibrils. Right: Load-induced damage recognizable by Z-band streaming (arrow) and disruption of sarcomeric structure (right section) with loss of distinct A-bands and I-bands. Z-band streaming is attributed to a loss of cytoskeletal protein elements such as desmin, alpha-actinin, and vimentin. Magnification for both micrographs: 16,500×. (Electron micrographs provided by Drs. David C. Walker and Darlene W. Reid, University of British Columbia, Vancouver, Canada.) (From Laghi F, Tobin MJ. Disorders of the respiratory muscles. Am J Respir Crit Care Med. 2003;168:10, with permission.) |
Respiratory Muscle Fatigue
Contractile fatigue occurs when a sufficiently large respiratory load is applied over a sufficiently long period (44,173,174,175). Contractile fatigue can be brief or prolonged (Fig. 132.15). Short-lasting fatigue results from accumulation of inorganic phosphate (176), failure of the membrane electrical potential to propagate beyond T tubes and, to a much lesser extent, intramuscular acidosis (177,178). Short-lasting fatigue appears to have a protective function because it can prevent injury to the sarcolemma caused by forceful muscle contractions (179). Long-lasting fatigue (174) is consistent with the development of, and recovery from, muscle injury (Fig. 132.16) (179,180). Several mechanisms may contribute to muscle injury. These include activation of calpain (a calcium-dependent nonlysosomal protease), increased muscle temperature, and excessive production of reactive oxygen species (23). Muscle injury can also be caused by eccentric contractions (contraction of a muscle while it is stretched by external forces) (23). Eccentric contractions can occur during ineffective inspiratory efforts, which have been associated with worse weaning outcome both in the acute (181) and chronic setting (182) and with ventilator dependence (21,182).
Whether critically ill patients develop short-lasting or long-lasting contractile fatigue of the respiratory muscles has not been clear. Patients who fail a trial of weaning from mechanical ventilation are at particular risk of developing fatigue because they experience marked increases in respiratory load (14,15,21). The addition of a new injury to the respiratory muscles (secondary to the development of contractile fatigue) might be the ultimate determinant of whether or not some patients are ever successfully weaned.
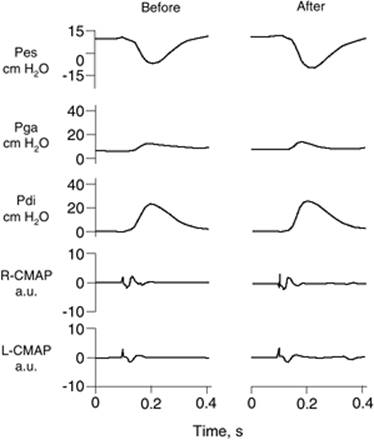
Laghi et al. (32) recently measured the contractile response of the diaphragm to phrenic nerve stimulation in nine patients who failed a weaning trial; seven patients who were successfully weaned served as control subjects. The weaning failure patients experienced a greater respiratory load. Moreover, the tension-time index of the diaphragm—an index of the ability of the diaphragm to sustain a given inspiratory load (183) calculated by multiplying two ratios: the respiratory duty cycle (inspiratory time divided by the time of a total respiratory cycle) and the mean inspiratory pressure per breath divided by maximum inspiratory pressure—was greater in the failure group than in the success group (p = 0.01). Nevertheless, not a single patient developed a decrease in transdiaphragmatic twitch pressure elicited by phrenic nerve stimulation (Fig. 132.17). The failure to develop fatigue is surprising because seven of the nine weaning failure patients had a tension-time index above 0.15 (the putative threshold for task failure and fatigue).
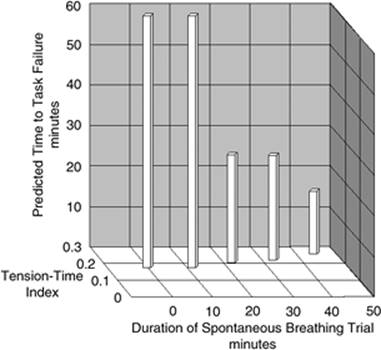
The increase in tension-time index over the course of the weaning trial (32) and predicted time to task failure (183) are shown in Figure 132.18. At the point that the physician reinstituted mechanical ventilation, patients were predicted to be an average of 13 minutes away from task failure. In other words, patients display clinical manifestations of severe respiratory distress for a substantial time before they develop fatigue. In an intensive care setting, these clinical signs will lead attendants to reinstitute mechanical ventilation before fatigue has time to develop.
|
|
|
Figure 132.17. Esophageal pressure (Pes), gastric pressure (Pga), transdiaphragmatic pressure (Pdi), and compound motor action potentials (CMAP) of the right and left hemidiaphragms after phrenic nerve stimulation before (left) and after (right) a failed trial of weaning. The end-expiratory value of Pes and the amplitude of the right and left CMAPs were the same before and after the trial, indicating that the stimulations were delivered at the same lung volume and that the stimulations achieved the same extent of diaphragmatic recruitment. The amplitude of twitch Pdi elicited by phrenic nerve stimulation was the same before and after weaning. A.u., arbitrary units. (From Laghi F, Cattapan SE, Jubran A, et al. Is weaning failure caused by low-frequency fatigue of the diaphragm? Am J Respir Crit Care Med. 2003;167:120, with permission.) |
Impaired Cardiovascular Performance
Spontaneous respiratory efforts decrease intrathoracic pressure, and thus increase the pressure gradient for systemic venous return (184). In addition, decreases in intrathoracic pressure increase left ventricular afterload, causing additional stress on the left ventricle (184). In patients with coronary artery disease, the increased stress can alter myocardial perfusion and cause transient left ventricular dilation (185). The occurrence of myocardial ischemia during periods of spontaneous respiration has been associated with a greater risk of weaning failure (186) and greater risk of ventilator dependence (187). Increases in transmural pulmonary artery occlusion pressure during spontaneous respiration (188) may be the central mechanism responsible for ventilator dependence in patients with myocardial ischemia (187) and in patients with impaired left ventricular function (189). Mechanisms by which increases in transmural pulmonary artery occlusion pressure could contribute to weaning failure include worsening pulmonary mechanics and decreased gas exchange.
|
|
|
Figure 132.18. The interrelationship between the duration of a spontaneous breathing trial, tension-time index of the diaphragm, and predicted time to task failure in nine patients who failed a trial of weaning from mechanical ventilation. The patients breathed spontaneously for an average of 44 minutes before a physician terminated the trial. At the start of the trial, tension-time index was 0.17, and the formula of Bellemare and Grassino (Bellemare F, Grassino A. Effect of pressure and timing of contraction on human diaphragm fatigue. J Appl Physiol. 1982;53:1190) predicted that patients could sustain spontaneous breathing for another 59 minutes before developing task failure. As the trial progressed, tension-time index increased and predicted time to the development of task failure decreased. At the end of the trial, tension-time index reached 0.26; that patients were predicted to sustain spontaneous breathing for another 13 minutes before developing task failure clarifies why patients did not develop a decrease in diaphragmatic twitch pressure. In other words, physicians interrupted the trial based on clinical manifestations of respiratory distress before patients had sufficient time to develop contractile fatigue. (From Laghi F, Tobin MJ. Disorders of the respiratory muscles. Am J Respir Crit Care Med. 2003;168:10, with permission.) |
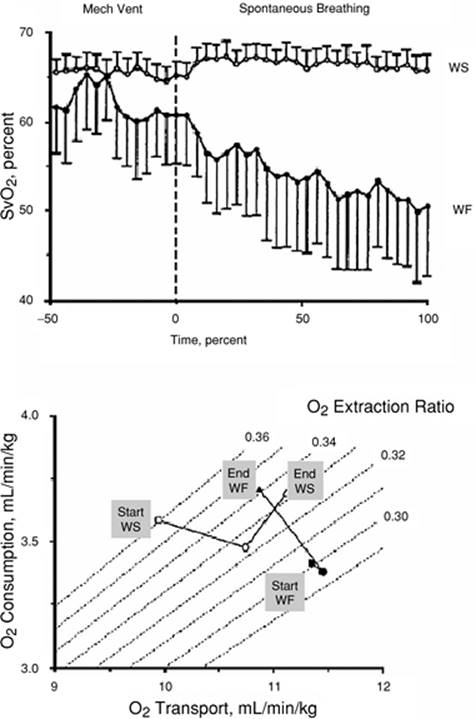
In the acute setting, oxygen consumption at the completion of a weaning trial is equivalent in weaning-success and weaning-failure patients (190). The manner in which the cardiovascular system meets oxygen demands, however, differs between the two groups. In weaning successes, oxygen transport increases, mainly resulting from an increase in cardiac index; in weaning failures, the increase in demand is met by an increase in oxygen extraction, resulting in a decrease in mixed venous oxygen saturation (Fig. 132.19). A decrease in mixed venous oxygen saturation is consistent with a failing cardiovascular response to an increased metabolic demand (184).
High variability in hemodynamic response during failure to wean has been reported by Zakynthinos et al. (41). It is unclear whether the absent interaction between weaning failure and oxygen consumption in some of the patients studied by Zakynthinos et al. (41) was due to depression of the respiratory centers, limited capacity to extract oxygen, or limited cardiac reserve (191).
To date, detailed studies on the impact of cardiac factors in determining weaning outcome have not been performed. So far, few case reports have shown that successful diuresis and weight loss may be associated with weaning success (188,192). Whether intravenous inotropic agents such as dobutamine should be used in difficult-to-wean patients remains controversial (184,193).
Psychological Factors
Patients who require mechanical ventilation are commonly affected by psychological problems such as anxiety, agitation, delirium, depression, apathy, and posttraumatic stress disorder (PTSD) (194,195,196,197,198). Half of patients receiving prolonged ventilation experience delirium (199). In these patients, delirium has been associated with greater likelihood of discharge to a nursing home or long-term care facility and with increased mortality at 1 year (199). As with the high prevalence of delirium, PTSD has also been reported to be very common in acutely and chronically ventilated patients (200,201,202). Duration of mechanical ventilation, use of sedative agents, and presence and severity of PTSD appear causally linked and may influence duration of mechanical ventilation and psychological function after discharge (195). Last, in a preliminary report of 100 patients requiring prolonged ventilation, Dilling et al. (197) recorded an association between anxiety at the time of a spontaneous breathing trial and weaning failure.
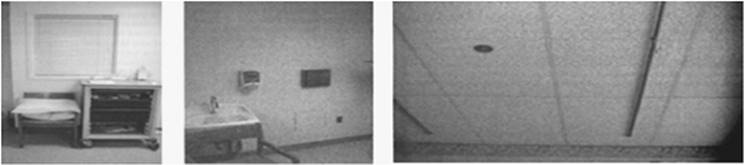
Possible mechanisms for psychological dysfunction in mechanically ventilated patients include respiratory discomfort, severity of illness, sleep deprivation, sensory deprivation (Fig. 132.20), and medication side effects (196,201,203,204,205). The delivery of mechanical ventilation itself can cause psychological dysfunction (195,196). Mechanical ventilation limits mobility, fosters isolation, impairs communication, and interferes with or blocks patient control of the act of breathing (195,206). Anxiety and depression can decrease motivation, interfere with performing simple tasks, and decrease self-esteem (195).
Aggressive treatment of depression may increase the likelihood of weaning (207,208). Biofeedback (209,210), improving the patients' environment, communication, and mobility (195,211), and specialized weaning centers (212) have been used to decrease psychological problems in ventilated patients.
Prediction of Weaning Outcome
Research on prediction of weaning outcome uses the tools of medical decision analysis (2). Therefore, before discussing weaning predictor tests, it is useful to review the principles of medical decision analysis.
Medical Decision Analysis
Diagnostic tests are designed to screen for a condition and to confirm the condition. The characteristics of screening tests and confirmatory tests differ, and only rarely will a single diagnostic test fulfill both functions (213).
|
|
|
Figure 132.19. Top: Mixed venous oxygen saturation (SvO2) during mechanical ventilation and a trial of spontaneous breathing in 11 weaning success (WS) patients (open symbols) and in 8 weaning failure (WF) patients (closed symbols). During mechanical ventilation, SvO2 was similar in the two groups (p = 0.28). Between the onset (dashed line) and the end of the trial, SvO2 decreased in the failure group (p <0.01) whereas it remained unchanged in the success group (p = 0.48). Over the course of the trial, SvO2 was lower in the failure group than in the success group (p < 0.02). Bars, SE, standard error. Bottom: Oxygen transport, oxygen consumption, and isopleths of oxygen extraction ratio in the success (WS, open symbols) and failure (WF, closed symbols) groups during mechanical ventilation (squares) and at the onset (circles) and end (triangles) of a spontaneous breathing trial. See text for details. (Modified from Jubran A, Mathru M, Dries D, et al. Continuous recordings of mixed venous oxygen saturation during weaning from mechanical ventilation and the ramifications thereof. Am J Respir Crit Care Med. 1998;158:1763.) |
|
|
|
Figure 132.20. The environment where ventilated patients are being cared for can promote sensory deprivation through the lack of windows with a view (left), bare walls (middle), and tedious ceiling (right). (From Martin UJ, Criner GJ. Psychological problems in the ventilated patient. In: Tobin MJ, ed. Principles and Practice of Mechanical Ventilation. 2nd ed. New York, NY: McGraw-Hill; 2006:1142, with permission.) |
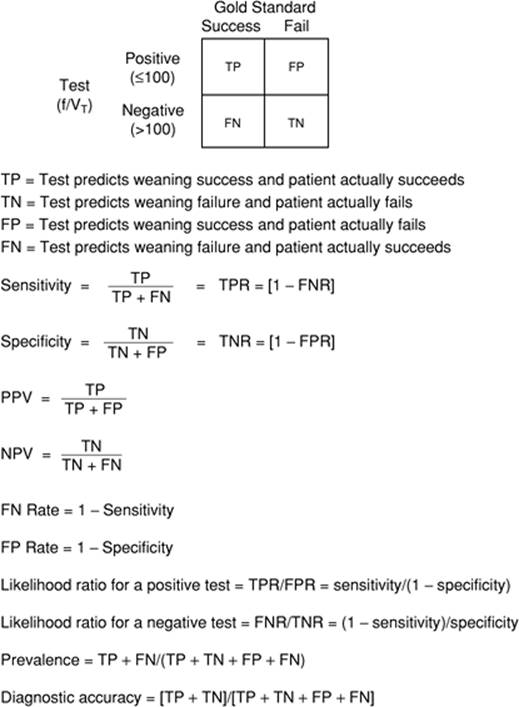
The primary goal of weaning predictor tests is screening (2). A good weaning predictor test, like any good screening test, should miss no patient who has the condition under consideration, i.e., to be ready for a weaning trial. This means that a good weaning predictor test must have a low rate of false-negative results—high sensitivity (Fig. 132.21) (2,213). A high rate of false-positive results (low specificity) is acceptable (2,213).
The process of weaning entails measurement of weaning predictors, a trial of weaning, and a trial of extubation (Fig. 132.1) (2). Each step in this sequence is a diagnostic test. Measurements of weaning predictors (screening tests) are used to diagnose readiness for a weaning trial. The trial of weaning (confirmatory test of the screening tests) itself is used to screen for readiness to extubate. Extubation (confirmatory test of the weaning trial) is used to diagnose/screen for readiness to maintain spontaneous respiration. To apply diagnostic tests (screening or confirmatory) in sequence introduces critical confounders in the interpretation of studies designed to assess the reliability of a (pre-existing) predictor test. These confounders are as follows: spectrum bias (213,214), test-referral bias (213,214), and base-rate fallacy (214,215). In the case of weaning, spectrum bias arises when the study population in a new investigation contains more (or fewer) sick patients than the population in which the diagnostic test was first developed (213,214). Test-referral bias arises when the results of the weaning predictor test being assessed are used to choose patients for a reference-standard test, i.e., passing a weaning trial that leads to extubation (213,214). Base-rate fallacy occurs when physicians fail to take into account the pretest probability of the disorder (214,215).
|
|
|
Figure 132.21. A 1 × 2 tabular display of the characteristics of diagnostic tests. The vertical columns represent the results of the gold standard test. The horizontal rows represent the results of the index test. Readings of f/Vt ≤100 are classified as positive test results and readings of >100 are classified as negative test results. The relationship of these binary results to the outcome of a T-tube weaning trial forms a decision matrix that has four possible combinations. (From Tobin MJ, Jubran A. Weaning from mechanical ventilation. In: Tobin MJ, ed. Principles and Practice of Mechanical Ventilation. New York, NY: McGraw-Hill; 2006:1185, with permission.) |
Pretest probability is a physician's estimate of the likelihood of a particular condition (weaning outcome) before a diagnostic test is undertaken (2). Posttest probability (typically expressed as positive predictive or negative predictive value) is the new likelihood after the test results are obtained (Fig. 132.21). A good diagnostic test achieves a marked increase (or decrease) in the posttest probability (over pretest probability). For every test in every medical subspecialty, the magnitude of change between pretest probability and postest probability is determined by Bayes' theorem (214). Three factors alone determine the magnitude of the pretest to posttest change: sensitivity, specificity, and pretest probability. It is commonly assumed that sensitivity and specificity remain constant for a test. In truth, test-referral bias, a common occurrence in studies of weaning tests, leads to major changes in sensitivity and specificity (213). Likewise, major changes in pretest probability arise as a consequence of spectrum bias (213). All of these factors need to be carefully considered when reading a study that evaluates the reliability of a weaning predictor test.
Weaning Predictor Tests
Several weaning predictor tests have been proposed and studied over the years. These tests include measurements of breathing pattern, pulmonary gas exchange, muscle strength, and neuromuscular drive. Their goal is to safely speed up the weaning process (2).
Respiratory Frequency to Tidal Volume Ratio (f /VT)
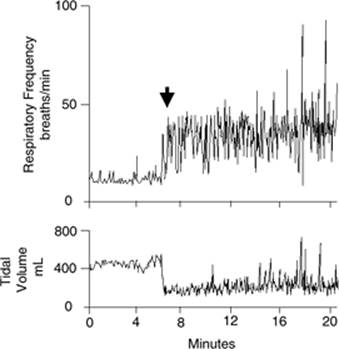
The ratio of respiratory frequency to tidal volume (f/VT)† is measured during 1 minute of spontaneous breathing (5) (Fig. 132.22). Measurements of f/VT in the presence of pressure support or continuous positive airway pressure (CPAP) will result in inaccurate predictions of weaning outcome (2). The higher the f/VT ratio, the more severe the rapid, shallow breathing and the greater the likelihood of unsuccessful weaning. An f/VT ratio of 100 best discriminates between successful and unsuccessful attempts at weaning (5).
The initial evaluation of f/VT was reported in 1991 (5). Since then, this test has been evaluated in more than 25 studies. Reported sensitivity ranges from 0.35 to 1.00 (214). Specificity ranges from 0.00 to 0.89 (214). At first glance, this wide scatter suggests that f/VT is an unreliable predictor of weaning outcome. Many of the investigators, however, ignored the possibility of test-referral bias and spectrum bias (2). These problems were compounded by an Evidence-Based Medicine Task Force of the American College of Chest Physicians (ACCP), who recently undertook a meta-analysis of the studies (216).
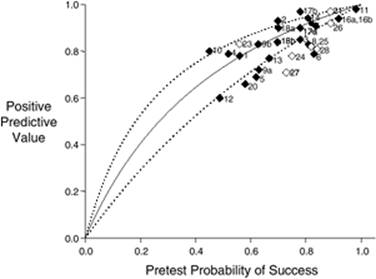
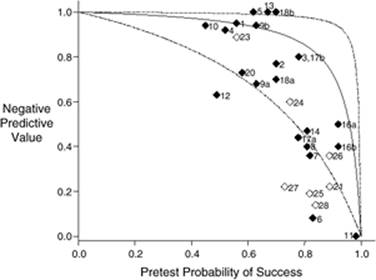
The Task Force calculated pooled likelihood ratios for f/VT and judged the summated values to signify that f/VT was not a reliable predictor of weaning success (216,217). The studies included in the meta-analysis, however, exhibited significant heterogeneity in pretest probability of successful outcome (214). Such marked heterogeneity prohibits the undertaking of a reliable meta-analysis (218,219). When data from the studies (included in the meta-analysis) were entered into a Bayesian model with pretest probability as the operating point, the reported positive predictive values were significantly correlated with the values predicted by the original report (5) on f/VT, r = 0.86 (p <0.0001); likewise, reported negative predictive values were correlated with the values predicted, r = 0.82 (p < 0.0001) (Figs. 132.23 and 132.24) (214).
|
|
|
Figure 132.22. A time-series, breath-by-breath plot of respiratory frequency and tidal volume in a patient who failed a weaning trial. The arrow indicates the point of resuming spontaneous breathing. Rapid, shallow breathing developed almost immediately after discontinuation of the ventilator. (From Tobin MJ, Perez W, Guenther SM, et al. The pattern of breathing during successful and unsuccessful trials of weaning from mechanical ventilation. Am Rev Respir Dis. 1986;132:1111, with permission.) |
The primary task of a weaning predictor test is screening, which requires a high sensitivity (2,213). The average sensitivity in all of the studies on f/VT was 0.89, and 85% of the studies reveal sensitivities above 0.90 (214). This sensitivity compares well with commonly used diagnostic tests: creatine phosphokinase and troponin T for the diagnosis of acute myocardial infarction, sensitivity of 0.94 (2) and 0.98 (220), respectively; chest radiograph for lung cancer, 0.60 (2); stress electrocardiogram (ECG) for myocardial ischemia, 0.61 for women and 0.72 for men (221); and sensitivity to diagnose endocarditis of <0.60 to 0.70 with transthoracic echocardiography and between 0.75 and 0.95 with transesophageal echocardiography (222). The sensitivity of a spontaneous breathing trial is unknown.
Since screening is the primary purpose of a weaning predictor test, it is important that the test be performed early in a patient's ventilator course. Figures 132.23 and 132.24, however, reveal that pretest probability of weaning success was 75% or higher in more than half the studies of weaning predictor tests. In other words, most physicians are postponing (inappropriately) the undertaking of weaning predictor tests. A simple way for a physician to assess his or her own timeliness in initiating weaning is to estimate the number of times he or she obtained positive results on weaning predictor tests over the preceding 6 months. If a physician working in a typical medical ICU estimates that he or she obtained positive results 70% or more of the time, they should consider that they are being too slow in initiating weaning (2).
Pulmonary Gas Exchange
Mechanical ventilation is virtually never discontinued in a patient who has severe hypoxemia, such as arterial oxygen tension (PaO2) less than 55 mm Hg with inspired oxygen fraction (FiO2) greater than 0.40. Arterial-to-inspired oxygen ratio (PaO2/FiO2), alveolar-arterial oxygen tension gradient, and arterial/alveolar oxygen tension ratio (PaO2/PaO2) are indices derived from arterial blood gas measurements proposed as predictors of weaning outcome. Of these indices only PaO2/PaO2 has been prospectively evaluated, and it has performed poorly as a predictor of weaning outcome (5). The study (5) was marred by test-referral bias—i.e., patients with severe hypoxia were excluded from the study population. Therefore, it is not possible to conclude that the poor performance of PaO2/PaO2 means that indices derived from arterial blood gas measurements are of no value in predicting weaning outcome. While threshold values of the efficiency of indices derived from arterial blood gas measurements cannot be recommended for weaning prediction, weaning attempts are not recommended in patients with borderline hypoxemia.
|
|
|
Figure 132.23. Positive-predictive value (post-test probability of successful outcome) for f/VT plotted against pre-test probability of successful outcome. Studies included in the ACCP Task Force's meta-analysis (Meade M, Guyatt G, Cook D, et al. Predicting success in weaning from mechanical ventilation. Chest, 2001;120(6 Suppl):400S) are indicated by closed symbols; studies undertaken after publication of the Task Force's report are indicated by open symbols. The curve is based on the sensitivity, specificity originally reported by Yang and Tobin (Yang KL, Tobin MJ. A prospective study of indexes predicting the outcome of trials of weaning from mechanical ventilation. N Engl J Med 1991;324:1445) and Bayes' formula for 0.01-unit increments in pre-test probability between 0.00 and 1.00. The lines represent the upper and lower 95% confidence intervals for the predicted relationship of the positive predictive values against pre-test probability. The observed positive-predictive value in a study is plotted against the pre-test probability of weaning success (prevalence of successful outcome). Studies #5, #6, #11, #18a, #18b, and #24 include measurements of f/VT obtained during pressure support. Studies #14 and #21 include measurements obtained in pediatric patients. Studies #7, #18a, #18b, and #28 used f/VT threshold values <65. (Modified from: Tobin MJ, Jubran A. Variable performance of weaning-predictor tests: role of Bayes' theorem and spectrum and test-referral bias. Intensive Care Med. 2006;32:2002). |
Minute Ventilation
A minute ventilation of less than 10 L/minute was a classic index used to predict a successful weaning outcome (223). When prospectively assessed, however, minute ventilation has a high rate of false-negative and false-positive results and cannot be recommended as a predictor of weaning outcome (2).
|
|
|
Figure 132.24. Negative-predictive value (post-test probability of unsuccessful outcome) for f/VT. Studies included in the ACCP Task Force's meta-analysis (Meade M, Guyatt G, Cook D, et al. Predicting success in weaning from mechanical ventilation. Chest, 2001;120(6 Suppl):400S) are indicated by closed symbols; studies undertaken after publication of the Task Force's report are indicated by open symbols. The curve, its 95% confidence intervals, and placement of a study on the plot are described in the legend to Figure 132.23. The observed negative-predictive value in a study is plotted against the pre-test probability of weaning success (prevalence of successful outcome). Note study #11, which has a negative-predictive value of 0.00 and specificity of 0.00. These values suggest that f/VT is an unreliable test (and this will also be the natural conclusion reached by a meta-analysis of likelihood ratio). Instead, a negative-predictive value of 0.00 and specificity of 0.00 are the values predicted for the pre-test probability of weaning success of 98.2% reported in study #11. (Modified from: Tobin MJ, Jubran A. Variable performance of weaning-predictor tests: role of Bayes' theorem and spectrum and test-referral bias. Intensive Care Med. 2006;32:2002). |
Maximum Inspiratory Pressure
The use of maximum inspiratory pressure as a weaning predictor stems from a study by Sahn and Lakshminarayan (223). They found that all patients with a maximum inspiratory pressure value more negative than -30 cm H2O were successfully weaned, whereas all patients with a maximum inspiratory pressure less negative than -20 cm H2O failed a weaning trial. In most successive investigations, these threshold values have shown poor sensitivity and specificity (5,32,38,41,42,43).
Vital Capacity
The normal vital capacity is usually between 65 and 75 mL/kg, and a value of 10 mL/kg or more has been suggested to predict a successful weaning outcome (2). In a study of ten patients with Guillain-Barré syndrome, Chevrolet and Deleamont (224) reported that vital capacity was helpful in guiding the weaning process. Patients with a vital capacity of less than 7 mL/kg were unable to tolerate as few as 15 minutes of spontaneous breathing. As vital capacity increased to more than 15 mL/kg with recovery from the illness, patients were safely extubated. Apart from unique circumstances, such as patients with Guillain-Barré syndrome, vital capacity is rarely used as a weaning predictor, and it is often unreliable (2).
Airway Occlusion Pressure
Several investigators have evaluated the usefulness of P0.1 as a predictor of weaning outcome (2). In these studies, P0.1 values above 3.4 to 6.0 cm H2O discriminated between weaning success and weaning failures (2). However, other investigators have found P0.1 to be quite inaccurate (19). One mechanism that could contribute to the poor performance of P0.1 is the limited reproducibility of the measurement. The within-individual coefficient of variation of P0.1 is about 50% (225,226), and the interindividual coefficient of variation is as high as 60% (227).
Gastric Tonometry
The gastrointestinal mucosa becomes ischemic early with the development of either hemodynamic compromise or a redistribution of blood flow. One factor that leads to blood flow redistribution is an increase in respiratory muscle effort. Gastric tonometry is based on the principle that the carbon dioxide tension (PCO2) of the fluid in the gastric lumen equilibrates with the PCO2 of the mucosal layer, and that the recording of PCO2 in gastric fluid provides a reliable estimate of the pH of the gut mucosa (228). The assumption that PCO2 in the gastric lumen is similar to that in the tissues of the gastric wall, however, may not be true, especially in patients who experience an uneven distribution of gastric blood flow (2).
The accuracy of gastric tonometry as a predictor of weaning outcome has been investigated in five studies (229,230,231,232,233). These five studies differ in methodology, and they also reveal different patterns of abnormality for intramucosal pH and PCO2 in patients undergoing weaning trials. Some investigators found that the measurements discriminated between the weaning-success and weaning-failure patients during mechanical ventilation (229,233), whereas others did not (230,231,232). If the ventilator was set at a level to achieve satisfactory muscle rest, it is difficult to see why gastric intramucosal pH should differ between the groups before the onset of spontaneous breathing. The studies reveal different levels of accuracy in predicting weaning outcome. The reported accuracy represents an overestimate because none of the investigators divided their data sets into training and validation subsets. Several investigators comment that the technique is simple. Yet it involves inserting a special intragastric tonometer, obtaining a radiograph to confirm location, the administration of histamine2-receptor blockers, withholding enteral feeding, waiting a sufficient period of time for satisfactory equilibration, and withdrawing and analyzing a saline sample and an arterial blood gas (2).
Weaning Trials
When a screening test is positive—for example, a low f/VT—the clinician proceeds to a confirmatory test (213), for example, pressure support of 6 to 8 cm H2O or spontaneous respiration through a T tube. The goal of a positive result on a confirmatory test—no respiratory distress at the conclusion of the pressure support trial or T-tube trial—is to rule in a condition, in this case, a high likelihood that a patient will tolerate a trial of extubation (213). An ideal confirmatory test has a very low rate of false-positive results; that is, a high specificity (213). Unfortunately, the specificity of a spontaneous breathing trial is not known. Indeed, its specificity will never be known, because its determination would require an unethical experiment: extubating all patients who fail a weaning trial and counting how many require reintubation (2).
The major weaning techniques used include T-tube trial, pressure support ventilation, intermittent mandatory ventilation, or some combination of these three. Recently, noninvasive positive pressure ventilation has been used to facilitate extubation in selected patients.
Intermittent Mandatory Ventilation (IMV)
For many years, IMV was the most popular method of weaning from mechanical ventilation (234). With IMV weaning, the ventilator's mandatory rate is reduced in steps of one to three breaths per minute, and an arterial blood gas is obtained about 30 minutes after each rate change (235). Unfortunately, titrating the ventilator's mandatory rate according with the results of arterial blood gases can produce a false sense of security. As little as 2 to 3 IMV breaths per minute can achieve acceptable blood gases, but these values provide no information regarding the patient's work of breathing (2). At IMV rates of 14 breaths per minute or less, the patient's work of breathing may be excessive (236,237) both during the IMV breaths (ventilator-assisted breaths) and the intervening spontaneous breaths. The fact that, as the IMV rate is decreased, inspiratory work increases progressively not only for the spontaneous breaths, but also for the assisted breaths, is largely due to the inability of the respiratory center to adapt its output rapidly to intermittent support (237). By providing inadequate respiratory muscle rest, IMV is likely to delay, rather than facilitate, discontinuation of mechanical ventilation in difficult-to-wean patients (7). In easy-to-wean patients (patients who are successfully weaned at the first weaning attempt such as uncomplicated postoperative patients), weaning with IMV probably does not prolong the duration of mechanical ventilation (238).
Pressure Support
When pressure support is used for weaning, the level of pressure is reduced gradually and titrated on the basis of the patient's respiratory frequency (239). When the patient tolerates a minimal level of pressure support, he or she is extubated. What exactly constitutes a “minimal level of pressure support” has never been defined (240). For example, pressure support of 6 to 8 cm H2O is widely used to compensate for the resistance imposed by the endotracheal tube and ventilator circuit (241). It is reasoned that a patient who can breathe comfortably at this level of pressure support will be able to tolerate extubation. However, if the upper airway is swollen because an endotracheal tube has been in place for several days, the work produced by breathing through the swollen airway is about the same as that caused by breathing through an endotracheal tube (241). Accordingly, any amount of pressure support may overcompensate for the resistance imposed by the endotracheal tube and ventilator circuit, and may give misleading information about the likelihood that a patient can tolerate extubation.
Recently, in a prospective, multicenter, randomized trial, Lellouche et al. (242) reported their experience with pressure support weaning using a computer-driven, closed-loop, knowledge-based algorithm. This algorithm included three basic functions. The first was an automatic gradual reduction in pressure support, with the goal of keeping the patient within a “comfort” zone (242). Comfort was defined as a respiratory rate ranging between 15 and 30 breaths/minute (up to 34 in patients with neurologic disease), a tidal volume above a minimum threshold (more than 250 mL if weight was less than 55 kg, and 300 mL otherwise), and end-tidal CO2 level less than 55 mm Hg (less than 65 mm Hg in patients with COPD). The computerized system assesses the patient every 2 to 4 minutes, and, if considered necessary, it makes changes in the ventilator's output. The second function was an automatic performance of trials of minimal low-pressure support, which the investigators named “spontaneous breathing trials.” The third was generation of an incentive message recommending separation from the ventilator when a spontaneous breathing trial was successfully passed. Of 1,014 eligible patients, 144 (14%) were included in the study—74 were randomized to the computer-driven weaning and 70 to physician-controlled weaning (T-tube trials, IMV trials, or trials of pressure support set at 7 to 12 cm H2O). Computer-driven weaning reduced the median duration of weaning (3 vs. 5 days; p = 0.01), duration of mechanical ventilation (7.5 vs. 12 days, p = 0.003), and ICU stay (12 vs. 15.5 days, p = 0.02) (Fig. 132.25). Computer-driven weaning was not different from physician-driven weaning in terms of reintubation rate (16% vs. 23%, p = 0.40), hospital length of stay (30 vs. 35 days, p = 0.22), ICU mortality (22% vs. 23%, p = 1.0), and hospital mortality (38% vs. 29%, p = 0.29). As the investigators indicate, the study has some limitations including randomization of a small fraction of eligible patients, inability to blind the investigators to treatment assignment, and unclear knowledge of which patients may be poor candidates for computerized weaning. To this list should be included no record of tidal volume (243). The latter point is of relevance considering that in a preliminary study, Shannon et al. (244) reported that in one of ten patients, tidal volume during closed-loop pressure support ventilation was greater than 10 mL/kg. In the same preliminary study, Shannon et al. (244) reported that in two additional patients, closed-loop pressure support ventilation did not provide sufficient ventilatory assistance to unload the respiratory muscles and avoid sternocleidomastoid muscle contractions (244). Finally, in the study of Lellouche et al. (242), it was estimated that only half of the patients assigned to usual care underwent spontaneous breathing trials despite passing weaning criteria. This may have skewed the results in favor of computer-driven weaning. Despite its limitations, the promising investigation of Lellouche et al. (242) highlights the need for much earlier screening in weaning.
|
|
|
Figure 132.25. Kaplan-Meier analysis of weaning time until successful extubation or death in patients undergoing usual weaning (n = 70) and in patients undergoing computer-driven weaning (CDW)—i.e., computer-driven closed-loop knowledge-based algorithm (n = 74). The probability of remaining on mechanical ventilation was less with computer-driven weaning than with usual weaning (log-rank test, p = 0.015). (From Lellouche F, Mancebo J, Jolliet P, et al. A multicenter randomized trial of computer-driven protocolized weaning from mechanical ventilation. Am J Respir Crit Care Med. 2006;174:894, with permission.) |
T-Tube Trials
The use of repeated T-tube trials several times a day is the oldest method for conducting a weaning trial (234). The patient receives an enriched supply of oxygen through a T-tube circuit. Initially 5 to 10 minutes in duration, T-tube trials are extended and repeated several times a day until the patient can sustain spontaneous ventilation for several hours. This approach has become unpopular because it requires considerable time on the part of the ICU staff.
Today, it is usual to limit a T-tube trial to once a day. Performing single daily T-tube trials is as effective as performing such trials several times a day (7) but much simpler. If the trial is successful, the patient is extubated. If the trial is unsuccessful, the patient is given at least 24 hours of respiratory muscle rest with full ventilator support before another trial is performed (2).
To assess whether the target duration of the single daily T-tube trials should be of 30 minutes or 120 minutes, Esteban et al. (9) conducted a prospective multicenter randomized trial of 526 patients who had received more than 48 hours of ventilation and who were considered ready for weaning. The rate of reintubation within 48 hours in patients randomized to trials lasting 30 minutes (14%) was equivalent to the rate of reintubation in patients randomized to trials lasting 120 minutes (13%). The two groups had similar ICU mortality rates and similar in-hospital mortality rates. The findings of this study suggest that, among patients with a high rate of weaning success (patients undergoing a first weaning attempt), a single daily T-tube trial with a target duration of 30 minutes is as effective in identifying patients who can be safely extubated as a single daily T-tube trial with target duration of 120 minutes. This study did not address the target duration of single daily T-tube trials in difficult-to-wean patients (patients who fail one or more weaning attempts).
Patients are judged to have failed a T-tube trial when they develop severe tachypnea, increased accessory muscle activity, diaphoresis, facial signs of respiratory distress, oxygen desaturation, tachycardia, arrhythmias, hypertension, or hypotension. The degree of change in these variables, however, varies from report to report. A standardized approach to patient monitoring during a T-tube trial does not exist. Indeed, there is no agreement as to whether the monitoring of any variable helps in deciding whether to continue a T-tube trial for an initially planned duration, prolong it, or curtail it (2).
Jubran et al. (245) investigated whether repeated measurements of esophageal pressure throughout a trial of spontaneous breathing might provide additional guidance over a single measurement obtained during the first minute of the trial. They quantified the change in esophageal pressure over the first 9 minutes of the trial using a multivariate adaptive regression spline procedure (Fig. 132.26). In a study of 60 patients (31 in the derivation data set and 29 in the prospective validation data set), an esophageal pressure trend index had a sensitivity of 0.91 and specificity of 0.89. Specifically, an esophageal pressure trend index reading of less than or equal to 0.44 was 8.2 times more likely to occur in weaning failure than in weaning success patients. These data suggest that, when available, the continuous monitoring of esophageal pressure swings during a T-tube trial may provide additional guidance in patient management over tests used for deciding when to initiate weaning.
|
|
|
Figure 132.26. Time-series plot of swings in esophageal pressure (Pes) in a weaning failure (left) and a weaning success patient (right) during a trial of spontaneous breathing. Black dots represent 1-minute averages. The solid line indicates the average value of Pes swings of the final minute of the trial. The dashed lines indicate ±10% of the final minute values of Pes swings. The time taken to reach ±10% of the final value for Pes swings was 14 minutes for the failure patient and 6 minutes for the success patient. (From Jubran A, Grant BJ, Laghi F, et al. Weaning prediction: esophageal pressure monitoring complements readiness testing. Am J Respir Crit Care Med. 2005;171:1252, with permission.) |
Noninvasive Ventilation in Weaning
Noninvasive positive pressure ventilation (NIPPV) has been used to facilitate extubation in intubated patients with COPD and acute hypercapnic respiratory failure.
Nava et al. (246) studied 50 patients with COPD who had been intubated due to acute hypercapnic respiratory failure and who had failed a T-tube trial after 36 to 48 hours of mechanical ventilation. Patients were randomized to either immediate extubation with noninvasive pressure support ventilation via a face mask, or continued pressure support ventilation via the endotracheal tube. In both groups, the pressure support level was decreased by 2 to 4 cm H2O per day as tolerated. In addition, all patients underwent trials of spontaneous breathing at least twice per day in an attempt to discontinue mechanical ventilation entirely. At the end of the trial, the investigators reported that noninvasive pressure support ventilation during weaning increased weaning rates at 60 days (88% vs. 68%), decreased the incidence of nosocomial pneumonia (0% vs. 28%), and significantly lowered 60-day mortality rates (8% vs. 28%). Noninvasive ventilation was generally well tolerated, although 14 of 25 patients developed nasal abrasions, and 2 developed gastric distention. By study design, patients were excluded if they had concomitant severe comorbidities—e.g., neurologic diseases, cancer, cardiogenic pulmonary edema, acute myocardial infarction, gastrointestinal bleeding, sepsis, trauma, diabetic ketoacidosis, coagulopathy, and other hematologic diseases. Postoperative patients were also excluded.
In a second trial, Girault et al. (247) studied 33 patients with either COPD, restrictive lung disease, or mixed obstructive-restrictive disease. Patients had been intubated due to acute-on-chronic respiratory failure and had failed a 2-hour T-piece trial after an average of 4.5 days of mechanical ventilation. Patients were randomized to either immediate extubation and noninvasive ventilation—either assist-control ventilation or pressure support ventilation—via a face mask, or continued pressure support ventilation via the endotracheal tube. The noninvasive ventilation group had a shorter period of intubation (5 ± 2 vs. 8 ± 4 days, p = 0.004), but there were no differences in hospital and ICU lengths of stay or in mortality. By study design, patients were excluded if they had a history of difficult intubation at the start of invasive mechanical ventilation or had a history of recent gastrointestinal surgery or ileus. Patients with swallowing disorders, ineffective cough, or persistence of bronchial congestion at the time of weaning were also excluded.
A third randomized trial on the usefulness of noninvasive ventilation as a weaning aid was conducted by Ferrer et al. (248). They enrolled 43 patients who had failed once-daily T-tube trials for three consecutive days; 44% of patients had COPD. Twenty-one patients were assigned to extubation, followed by immediate noninvasive ventilation (inspiratory positive airway pressure [IPAP], 10 to 20 cm H2O, and expiratory positive airway pressure [EPAP], 4 to 5 cm H2O); 22 patients were reconnected to the ventilator and underwent conventional weaning with daily T-tube trials. An interim analysis after half the planned number of patients had been studied revealed a superior outcome in the noninvasive ventilation arm, and the study was stopped. Features of the better outcome in the noninvasive ventilation group—as compared to conventional weaning—included a higher ICU survival, 20% versus 14%; shorter duration of invasive ventilation, 10 versus 20 days; shorter ICU stay, 14 versus 25 days; shorter hospital stay, 28 versus 41 days; less frequent tracheotomy, 2% versus 14%; lower incidence of nosocomial pneumonia, 5% versus 14%; and lower incidence of septic shock, 2% versus 9%.
The three preceding studies suggest that noninvasive ventilation may be beneficial if instituted at the point when certain patients, in particular those with COPD, have just failed their first (246,247) or third T-tube trial (248). At this point, however, it is premature to recommend the routine use of noninvasive ventilation as weaning mode in patients with hypercapnic respiratory failure. Nonetheless, if the success of noninvasive ventilation is replicated in other trials, noninvasive ventilation may become an important adjunct in the weaning of such patients. Insufficient data are available on the role of noninvasive ventilation in weaning from hypoxemic respiratory failure.
Comparison of Weaning Methods
When assessed in difficult-to-wean patients, weaning methods are not equally effective (234). For example, the period of weaning is as much as three times as long with IMV as with T-tube trials (7) or pressure support (6) trials. In a study involving patients with respiratory difficulties on weaning, T-tube trials halved the weaning time as compared with pressure support (7); in another study, the weaning time was similar with the two methods (6). In contrast to the poor performance of IMV in difficult-to-wean patients (6,7), weaning with IMV in patients who are not difficult to wean (patients who are successfully extubated at the first trial of weaning) and who require short-term mechanical ventilation (less than 72 hours) is probably as effective as weaning with T-tube trials (238).
Weaning by Protocol versus Usual Care
The use of human-driven protocols for weaning versus usual care has been compared in six randomized controlled trials (3,249,250,251,252,253). The reports of Namen et al. (249), Randolph et al. (250), and Krishnan et al. (251) show no advantage for a protocol approach. The reports of Kollef et al. (3), Marelich et al. (252), and Ely et al. (253) are viewed as evidence for the superiority of a protocol approach to weaning.
In the trial of Kollef et al. (3), however, no advantage for weaning by protocol was observed in three of the four study ICUs. In the fourth unit, where a significant advantage for a protocol approach to weaning was observed, patients assigned to usual care were significantly sicker than the patients assigned to protocol management in that ICU; this confounding factor markedly weakens (if not destroys) any assertion that protocol weaning was superior (2).
Marelich et al. (252) studied weaning by protocol in two ICUs and found no significant advantage in one. The study of Ely et al. (253) does not consist of a straightforward comparison of protocol versus nonprotocol care. All of the patients in the intervention arm were weaned by T-tube or flow-by trials, whereas no patient in the nonintervention arm was weaned by T-tube or flow-by trials. Seventy-six percent of the patients in the nonintervention arm were managed by IMV alone or in combination with pressure support. Even if at the time of weaning all patients in the nonintervention arm happened to be managed with pressure support alone (and, unfortunately, this information is not provided in the manuscript) (253), the fact remains that the weaning techniques used in the intervention group (T tube) and in the nonintervention group were not the same. With this fundamental difference in techniques, it is impossible to use data from this study to form a judgment about the efficacy of a protocol per se. Instead, if all patients in the nonintervention group were weaned with pressure support, the report of Ely et al. (253) can be viewed primarily as confirming the report of Esteban et al. (7)—that T-tube weaning may be superior to pressure support weaning, and, if patients in the nonintervention group were weaned with either IMV or pressure support, the report of Ely et al. (253) can be viewed primarily (for those patients weaned with IMV) as confirming the reports of Brochard et al. (6) and Esteban et al. (7)—that IMV slows weaning.
That the use of a protocol does not improve weaning outcome should not be surprising (2,254). One needs to make a distinction between the use of algorithms in research protocols and their subsequent application in everyday practice. The algorithm in a research protocol is specified with exacting precision (255). For example, if f/VT less than or equal to 100 is the nodal point for advancement to a T-tube trial, then patients with an f/VT of 100 will undergo the trial, whereas patients with a f/VT of 101 will return to mechanical ventilation for another 24 hours. An experienced clinician, however, would think it silly to comply with a protocol that decided an entire day of ventilator management on a one-unit difference in a single measurement of f/VT (or any other weaning predictor) (254). Instead, physicians customize the knowledge generated by research to the particulars of each patient. The careful application of physiologic principles is likely to outperform an inflexible application of a protocol.
Extubation
Decisions about weaning and extubation are commonly merged. Merging these two decisions, however, can cause patient mismanagement (256). When a patient tolerates a weaning trial without distress, a clinician feels reasonably confident that the patient will be able to sustain spontaneous ventilation after extubation. However, passing a weaning trial without distress is not the only consideration. The clinician also must consider whether the patient will be able to maintain a patent upper airway after extubation.
Removal of an endotracheal tube is typically performed under controlled conditions (256)—the patient has satisfactorily tolerated a weaning trial. Enteral feeding is temporally withheld for about 4 hours. When possible, the head of the bed should be at 30 to 90 degrees from the horizontal (257). The endotracheal tube, mouth, and upper airway are suctioned, paying attention to the collection of secretions above an inflated cuff, as inadequate clearing of secretions can result in postextubation laryngospasm (257). Some clinicians recommend keeping a suction catheter in place (aiming for the catheter to barely protrude from the distal end of the endotracheal tube) as the cuff is deflated; this step is taken in an attempt to capture any secretions sitting on top of an inflated cuff that may fall into the airway after deflating the cuff. Some clinicians inflate the lungs with an Ambu bag immediately before pulling out the endotracheal tube, hoping that the larger-than-usual ensuing exhalation will push secretions upward and outward (258). The cuff is then deflated, and the endotracheal tube is withdrawn. After removal of the endotracheal tube, the patient is given supplemental oxygen, titrated to oxygen saturation, being particularly cautious with a patient who is at risk of carbon dioxide retention. Patients may have impaired airway protection reflexes immediately after extubation (259,260), and aspiration can be silent—that is, aspiration can occur without coughing (261). If speech is impaired for more than 24 hours, indirect laryngoscopy should be undertaken to assess vocal cord function. Oral intake should be delayed in patients who have been intubated for a prolonged period (259,260).
In the hours following extubation, patients are carefully monitored for their ability to protect the upper airway and sustain ventilation. Most patients will display progressive improvement, allowing the discontinuation of supplemental oxygen and ultimate discharge from the ICU. Between 2% and 30% (232,242,262,263,264,265,266) of patients, however, experience respiratory distress in the postextubation period. Many, but not all, require reinsertion of the endotracheal tube and mechanical ventilation. These patients are commonly classified as extubation failures. In contrast to the relatively short time required to recognize that a patient is failing a weaning trial, the time course for the development of postextubation distress extends over a longer span. In the study of Epstein et al. (267), for example, 33% of reintubations occurred within the first 12 hours after extubation, and 42% occurred after 24 hours.
Causes of Postextubation Distress
The listed indications for reintubation vary considerably from study to study. Of these, postextubation upper airway obstruction has attracted the most attention.
Postextubation Upper Airway Obstruction
Upper airway obstruction is one of the most urgent and potentially lethal medical emergencies. Complete airway obstruction lasting for as little as 4 to 6 minutes can cause irreversible brain damage (13). The upper airway, which encompasses the passage between the nares and carina, can be obstructed by functional or anatomic causes. Among the first are vocal cord paralysis, paradoxical vocal cord motion, and laryngospasm (13,268,269). Among the second are trauma (including arytenoid dislocation) (270,271), burn, granulomas, infections, foreign bodies, tumors, tracheomalacia, compression by a hematoma in close proximity to the airway (272), and supraglottic, retroarytenoidal or subglottic edema (256,273,274). Edema can develop after only 6 hours of intubation (275). A thinner mucosa covering the cartilage of the vocal processes, less resistance to trauma, and smaller laryngeal diameter are probably responsible for the greater prevalence of laryngeal edema in female than male patients (276,277,278,279). Other risk factors associated with the development of laryngeal edema include traumatic intubation, excessive tube size, excessive tube mobility secondary to insufficient fixation, a patient fighting against the tube or trying to speak, excessive pressure in the cuff, too frequent or too aggressive tracheal suctioning, occurrence of infections or hypotension, and the presence of a nasogastric tube that predisposes to gastroesophageal reflux (273,278,280). It is also possible that a biochemical reaction between the tube material and the airway mucosa may cause laryngeal edema (273). Life-threatening obstruction, either functional or anatomic, can occur postoperatively in patients with redundant pharyngeal soft tissue—such as in sleep apnea—and loss of muscle tone related to the postanesthetic state (13).
Several investigators have reported that upper airway obstruction accounts for about 15% of patients requiring reintubation (9,267,281). When upper airway obstruction occurs, it typically becomes manifest within 3 to 12 hours after extubation (273,276,280). In the case of postextubation laryngeal edema, symptoms occur within 5 minutes postextubation in 47% of patients, within 6 to 30 minutes post extubation in 33% of patients, and after more than 30 minutes post extubation in 20% of patients (279). Symptoms rarely occur until 75% of the upper airway lumen has been obliterated (282,283). Occasionally, symptoms may not occur until the diameter of the airway is reduced to 5 mm (284).
Upper airway obstruction causes stridor only if the patient is capable of generating sufficient airflow; if airflow is insufficient, obstruction may cause hypercapnia, hypoxemia, or paradoxical breathing, but not stridor. Women are more susceptible to postextubation stridor than men (276,277,278). Among patients who develop stridor, 1% to 69% require reintubation (276,277,280,285). Many (276,278,280,285), but not all (277,278,279), investigators have noted that the rate of postextubation stridor increases in proportion to the duration of mechanical ventilation. Stridor usually occurs during inhalation in presence of extrathoracic airway obstruction and during exhalation in the presence of intrathoracic airway obstruction, and it can be biphasic with midtracheal stenosis (286,287).
The first warning of airway obstruction in an unconscious patient may be failure of a jaw-thrust maneuver to open the airway or the inability to ventilate with a bag-valve. In a conscious patient, respiratory distress, stridor, altered voice—such as aphonia or dysphonia—snoring, dysphagia, odynophagia, prominence of neck veins, and neck and facial swelling all may indicate impending airway obstruction (13). Patients may bring their hands to their neck, a sign of choking. Other signs include suprasternal and intercostal retractions, and reduced or absent air movement on auscultation. Wheezing may be present or absent. Thoracoabdominal paradox may be prominent. Sympathetic discharge is high, and patients are diaphoretic, tachycardic, and hypertensive. As asphyxia progresses, bradycardia, hypotension, and death ensue (13). Arterial blood gases are not particularly helpful, because they are not specific to airway patency (288). They may show little change until a patient is in extremis (288).
Other Causes of Postextubation Distress
Conditions other than upper airway obstruction that cause postextubation distress include respiratory failure, congestive heart failure, aspiration or excessive secretions, encephalopathy, and other conditions (267). The frequency of a particular cause differs among studies. For example, cardiac failure accounted for 23% of the cases of Epstein et al. (267), 7% of the cases of Esteban et al. (9), but none of the cases of Smina et al. (281) or De Bast et al. (273).
Consequences of Postextubation Distress
Mortality among patients who require reintubation is more than six times as high as mortality among patients who can tolerate extubation (9); the reason for the higher mortality is unknown. It might be related to the development of new problems after extubation. In support of this possibility is the observation of Epstein et al. (267) that mortality increases in proportion to the time between extubation and reintubation: mortality of 24%, 39%, 50%, and 69% in patients reintubated between 0 and 2, 13 and 24, 25 and 48, and 49 and 72 hours after extubation, respectively. A second explanation is that the need for reintubation reflects greater severity of the underlying illness (256). In only a minority of patients, mortality is due to complications associated with reinsertion of a new tube (256).
In the subgroup of patients in whom postextubation distress results specifically from upper airway obstruction, complications include, but are not limited to, anoxic brain injury, cardiopulmonary arrest, and death (289,290). Upper airway obstruction can be complicated by pulmonary edema (13), with an incidence of 11% in one adult series (291), or pulmonary hemorrhage (292). Increased venous return, with more negative intrathoracic pressure and catecholamine-induced venoconstriction, contributes to pulmonary edema, but it cannot be the sole mechanism; as intrathoracic pressure becomes more negative, venous return to the right ventricle becomes flow limited (293). Other factors contributing to pulmonary edema include decreased left ventricular preload (leftward shift of interventricular septum), increased left ventricular afterload (increased negative intrathoracic pressure and catecholamine-induced elevation of systemic vascular resistance), pulmonary vasoconstriction (hypoxemia and acidosis), and, possibly, stress failure of the alveolar-capillary membrane (292) (Fig. 132.27).
|
|
|
Figure 132.27. Mechanisms responsible for the development of pulmonary edema formation during acute airway obstruction. ITP, intrathoracic pressure; LV, left ventricle. (From Miro AM, Pinsky MR. Heart-lung interactions. In: Tobin MJ, ed. Principles and Practice of Mechanical Ventilation. 1st ed. New York, NY: McGraw-Hill; 1994:647, with permission.) |
Whether pulmonary edema develops during or after relief of upper airway obstruction may depend on whether the obstruction is fixed or variable (294). Fixed upper airway obstruction results in vigorous inspiratory efforts (Mueller maneuver), followed by vigorous expiratory efforts (Valsalva maneuver) (291,294). Exhalation against an obstructed airway raises intrathoracic and alveolar pressures. The positive expiratory pressure decreases pulmonary vascular filling and opposes the hydrostatic forces that favor transudation of fluid into the alveoli during inhalation (291). With a sudden relief of obstruction, positive expiratory pressure is lost; consequently, there is a massive transudation of fluid from the pulmonary interstitium into the alveoli, resulting in pulmonary edema over minutes to hours. In contrast to fixed obstruction, variable extrathoracic upper airway obstruction hinders inhalation, and exhalation is usually unaffected. In this situation, the hydrostatic forces that favor transudation of fluid into the alveoli during inhalation are unopposed, leading to edema before the obstruction is relieved (294).
Predictors of Postextubation Distress
Because reintubation causes serious complications in some patients, attempts are made to predict its likely occurrence. Several physiologic variables have been evaluated for their ability to predict this likelihood (Table 132.3). For some patients, the likelihood of reintubation is considered so high that a clinician may proceed to tracheotomy without first attempting extubation (256).
|
Table 132.3 Possible Predictors of Postextubation Distress |
|||||||
|
Ability to Sustain Spontaneous Respiration
A true-positive result of a T-tube trial is defined as a patient who tolerates the trial without distress, is then extubated, and does not require reintubation (256). The usual rate of reintubation is 15% to 20%—sometimes lower—but higher reintubation rates have been reported by some investigators: 24% (295), 25% (231), 27% (232), 29% (264,265). These false-positive test results—that is, patients who tolerate the T-tube trial but require reintubation after extubation—mean that the positive predictive value and specificity of passing a T-tube trial in predicting that a patient will not require reintubation is less than 100%. To measure the false-negative rate (Fig. 132.21) would require extubation of patients who fail a T-tube trial and counting how many do not require reintubation. For obvious ethical reasons, this number is not known. Given the natural caution of physicians, it can be confidently assumed that it is higher than 0% (256).
Weaning Predictor Tests
Several investigators have examined the ability of weaning predictor tests to predict the development of distress after extubation. The question posed is along these lines: “Does f/VT, or some other predictor test, measured before a T-tube trial, predict the likelihood of reintubation?” To answer this question with scientific validity, it is imperative to avoid test-referral bias. This can be avoided if the investigators take steps to ensure that clinicians do not perform a T-tube trial or are not taking the results of the T-tube trial into account when deciding whether to extubate the study patients. In other words, a decision to extubate the patient must be taken before the T-tube trial, and must proceed even if the patient exhibits significant distress during the trial, a strategy that raises ethical concerns.
Zeggwagh et al. (296) are the only group of investigators who assessed the ability of weaning predictor tests to forecast development of distress after extubation without performing a weaning trial (after the weaning predictors had been recorded). The investigators prospectively studied 101 patients at the point that their ICU physicians contemplated weaning. They measured a series of physiologic measurements during 2 minutes of spontaneous breathing; the results of these measurements were not communicated to the primary team. The team then extubated the patients without first undertaking any form of weaning trial. The extubation decision was made by the ICU team based on the following criteria: improvement or resolution of the condition precipitating the need for mechanical ventilation; good level of consciousness with cessation of all sedative agents; temperature less than 38°C; respiratory frequency less than 35 breaths per minute; oxygen saturation greater than 90% on an FiO2 less than or equal to 0.40; hemodynamic stability; and the absence of electrolyte disorders, acid-base disturbance, or anemia (defined as a hemoglobin less than 10 g/dL).
Reintubation was necessary in 37% of the patients. Several variables predicted the need for reintubation with a reasonable degree of accuracy. For example, f/VT had a sensitivity of 0.77 and a specificity of 0.79, with an area under a receiver operating curve (ROC) of 0.81 ± 0.06; maximum expiratory pressure had a sensitivity of 0.52 and a specificity of 0.92, with an area under a ROC of 0.73 ± 0.07. The investigators developed a model based on three variables: f/VT, maximum expiratory pressure, and vital capacity. The area under the ROC for the model was 0.91 ± 0.04 for a development data series and 0.86 ± 0.06 for a validation data series. The accuracy of weaning predictors to predict the development of distress after extubation in this study (296) contrasts sharply with their limited accuracy in studies where the investigators permitted a weaning trial (which altered clinician's extubation decisions) between measurement of the predictors and extubation (256). This difference in diagnostic accuracy is likely due to test-referral bias (2). An important aspect of this study (296) is that the results suggest that undertaking a weaning trial before extubation is useful; the rate of reintubation in the study of Zeggwagh et al. (296) was about double that reported in studies in which weaning trials preceded extubation (256).
Cuff-Leak Test
The presence of an endotracheal tube makes it extremely difficult to evaluate the structure and function of the airway before extubation. The amount of air leaking around the outside of an endotracheal tube on deflating the balloon cuff has been used by several investigators to predict upper airway obstruction after extubation (Fig. 132.28). The idea was first reported by Adderley and Mullins (297), who studied 31 planned extubations in 28 children with croup. After extubation, reintubation was required in 13% of children who had an audible leak (on coughing or when plateau pressure was 40 cm H2O), and reintubation was required in 38% of children without a leak. The cuff-leak test has since been evaluated by numerous investigators (273,278,280,285,298,299,300). For several reasons, however, it is difficult to provide general recommendations on how to perform and interpret a cuff-leak test (256).
|
|
|
Figure 132.28. Tracings of inspiratory flow (upgoing) and expiratory flow (downgoing) in two patients before and after deflation of the cuff on the endotracheal tube (arrow). The patient in the upper panel had a large leak (positive test result): after deflation of the cuff, expiratory flow became substantially smaller than inspiratory flow. The patient in the lower tracing had a small leak (less than 12% of inspired tidal volume; negative test result): expiratory flow exhibited little if any decrease after cuff deflation. (Modified from: Jaber S, Chanques G, Matecki S, et al. Post-extubation stridor in intensive care unit patients. Risk factors evaluation and importance of the cuff-leak test. Intensive Care Med. 2003;29:69). |
First, the method for performing the test has not been standardized. In particular, none of the investigators addressed the setting of inspired tidal volume, which may influence the size of the leak; the method for quantifying the leak varies between absolute units (milliliters) and percentage of inspired tidal volume. Second, the outcome criterion is not always clearly stated: rate of reintubation for any reason, occurrence of stridor of any severity, or occurrence of stridor that requires reintubation. The rates of stridor vary considerably among studies, suggesting that investigators used different criteria; admittedly, it is not obvious that severity of stridor can be graded in any reproducible manner. Third, in some studies, it is not clear whether the investigators carefully excluded reasons for reintubation other than stridor. If a patient is reintubated because of left ventricular failure, it is not logical to expect the cuff-leak test to predict such an event. Fourth, the thresholds for defining a significant leak vary. Fifth, all calculations of test performance are inevitably overestimates, because none of the investigators split their data set into training and validation subsets. Finally, in adult patients, small or absent cuff leaks do not necessarily translate in the development of stridor or the need for reintubation, and vice versa (Fig. 132.29) (273,278,299). For instance, in the study of Kriner et al. (278), 7 of the 462 extubated patients required reintubation. Only two of these seven patients had an air leak volume less than or equal to 110 mL, and the leak volumes of those patients who did and did not require reintubation were similar: 181 ± 158 versus 131 ±137 mL, p = 0.47 (301). In view of all the above observations, some investigators reason that in adult patients, failing a cuff-leak test should not be used as an indication for either delaying extubation or initiating other specific therapy (278,299,301) but, possibly, as an indicator of increasing vigilance at the time of extubation (301). Factors that may contribute to small or absent cuff leaks in patients who do not develop postextubation distress include the following: secretions located around the endotracheal tube, head and neck position, presence or absence of sedation, and large endotracheal tube relative to the size of the patient's larynx (278,302).
|
|
|
Figure 132.29. Cuff leak calculated as the percent difference between exhaled tidal volume when the cuff of the endotracheal tube was inflated and then deflated. Eight of 76 patients (11%) required reintubation for laryngeal edema. In this study, patients requiring reintubation for laryngeal edema had a smaller leak than the other patients. The best cut-off value for air leak was 15.5%. Small or absent cuff leaks, however, did not necessarily translate in reintubation. The positive predictive value of a leak less than 15.5% was only 25%—i.e., a patient with a small cuff leak still had 75% chance of being extubated without requiring reintubation for laryngeal edema. (Modified from: De Bast Y, De Backer D, Moraine JJ, et al. The cuff leak test to predict failure of tracheal extubation for laryngeal edema. Intensive Care Med. 2002;28:1267). |
Laryngeal Ultrasound
In intubated patients, laryngeal ultrasonography can delineate the anatomic structures of the larynx, and it can record the shape and width of the column of air—both within and around the endotracheal tube—which passes through the vocal cords (302). Using laryngeal ultrasonography in 51 patients considered ready for extubation (4 developed postextubation stridor and 2 of them required reintubation), Ding et al. (302) measured the difference in width of the column of air passing through the vocal cords when the cuff of the endotracheal tube was inflated and the corresponding value when the cuff was deflated (Fig. 132.30). The smaller the difference in width, the greater the likelihood of postextubation stridor (302). As the investigators indicate, the study was not designed to assess how the column of air passing through the trachea, as detected by ultrasonography, could be affected by secretions located around the endotracheal tube, cross-sectional dimension of the endotracheal tube relative to the dimensions of the patient's airway, and wakefulness; all patients were studied while sedated to avoid the confounding effect of cough on ultrasound signals. Based on this single study, it is premature to recommend laryngeal ultrasonography as a screening tool before extubation.
Secretions and Cough
A proportion of patients fail either a weaning attempt or an extubation attempt because of excessive airway secretions. This proportion varies among reports, largely because there is no consistent definition of “excessive secretions” or even how best to quantify secretions (256). If one quantifies secretions according to the volume obtained by suctioning over a fixed time interval, a patient who coughs and expels secretions without difficulty may get classified as having a greater secretion problem than a patient who has thick viscid secretions that cannot be dislodged from the lower airways (256).
Investigators have recently evaluated measurements of secretions as predictors of postextubation distress (281,303,304,305,306). Khamiees et al. (303) attempted to quantify cough strength by placing a white card 1 to 2 cm from the end of the endotracheal tube and requesting the patient to cough as many as three or four times just before extubation. Any wetness on the card was classified as a positive test (assessment was made by a single observer). This test was seen as a test of cough strength and not of the amount of secretions present. They studied 100 extubations in 91 patients; 18 patients were classified as extubation failures, and 11 were reintubated within 72 hours of extubation (the criteria for classifying the other seven patients as extubation failures are not clear). Extubation failure was three times more likely in patients with a negative white-card test (no secretions coughed onto the card). Three other measures also predicted extubation failure. Extubation failure was four times more likely among patients who had a weak or absent cough than in patients with a moderate or strong cough. Extubation failure was eight times more likely in patients classified as having moderate or abundant secretions by the nursing staff in the 4 to 6 hours preceding extubation than in patients with absent or mild secretions. Extubation failure was 16 times more likely among patients whose secretions required suctioning every 2 hours or less.
|
|
|
Figure 132.30. Laryngeal ultrasound in an intubated patient who did not develop postextubation stridor. When the cuff on the endotracheal tube is inflated—ultrasound (A) and schematic illustration (B)—the column of air (AC) passing trough the true vocal cords (VC) is square-shaped. The hypoechoic true vocal cords can be seen on both sides of the air column. The hyperechoic arytenoid cartilages are located behind the true vocal cords and next to the air column. When the cuff is deflated—ultrasound (C) and schematic illustration (D)—the column of air passing trough the true vocal cords becomes trapezoid and the air column width increases. In addition, the acoustic shadow of the laryngeal air column masks the arytenoid cartilages and part of the true vocal cords. Arrow, width of the air column; T, thyroid cartilage. (From Ding LW, Wang HC, Wu HD, et al. Laryngeal ultrasound: a useful method in predicting post-extubation stridor. A pilot study. Eur Respir J. 2006;27:384, with permission.) |
Salam et al. (304) of the same investigation group undertook a further study of predictors of reintubation in 88 patients who underwent 100 extubations; extubation failure was defined as reintubation. Reintubation within 72 hours was required in 16% of the patients. The cough peak flow was lower in reintubated patients than in patients successfully extubated (SE): 58 ± 5 (SE) versus 80 ± 4 L/minute. A threshold peak flow of less than or equal to 60 L/minute had a sensitivity 0.77, specificity 0.66, likelihood ratio of 2.3, and risk ratio of 4.8. The investigators also re-evaluated the white-card test described by Khamiees et al. (303) and found that it did not predict reintubation. Clearly, physicians in the study of Salam et al. (304) had reduced the number of extubations attempted in patients with larger volumes of secretions. The physicians had altered their pretest probability of extubation failure based on the need for frequent suctioning. The physicians refused to advance such patients to extubation (test-referral bias), and thus the results of the study give an erroneous impression that frequent suctioning is not a good predictor of reintubation. (A limitation of the white-card test is that it will be negative in patients with a strong cough who have few or no secretions.) The volume of secretions collected in the 2 to 3 hours before extubation was equivalent in reintubated and successfully extubated patients: 2.5 ± 0.9 versus 2.3 ± 0.4 mL/hour, respectively. A threshold of greater than 2.5 mL secretions per hour, however, did discriminate between the groups: sensitivity 0.71, specificity 0.62, likelihood ratio 1.9, and risk ratio 3.0.
Neurologic Assessment
Some ventilated patients demonstrate good respiratory function and tolerate a T-tube trial without distress, yet their physicians are reluctant to extubate them because they fear that the patients will not be able to protect their airway after extubation (256). Inability to protect the airway can be caused, among other factors, by unsatisfactory neural control over the upper airway, such that the tongue (in a recumbent patient) may fall back and occlude the airway lumen, as happens in patients with sleep apnea. It can also be caused by impaired laryngeal and other upper airway reflexes, placing patients at risk of aspiration of secretions or of ingested food.
Concern about protecting the airway most often arises in a patient with evidence of brain injury. Three groups of investigators—Coplin et al. (305), Namen et al. (249), and Salam et al. (304)—have studied the role of brain function in patients being considered for extubation. The most careful study is that by Coplin et al. (305), who studied 136 brain injury patients. Based on their data, these investigators (305) concluded that a depressed level of consciousness—quantified with the Glasgow coma scale score —and absence of a gag reflex should not be used as the sole indication for prolonged intubation.
In contrast to Coplin et al. (305), Namen et al. (249) concluded that a Glasgow coma scale score of greater than or equal to 8 helps in predicting successful extubation in brain injury patients. A fundamental problem with this second study (249) is that half of the extubations were part of the withdrawal of life-support therapy; hence, all of these patients died. Because these patients were not reintubated, it appears that the authors classified them as extubation successes. Irrespective of how these patients were classified, it is impossible to interpret data on extubation predictors where half of the extubations arose from a decision to withdraw life support.
The studies of Coplin et al. (305) and Namen et al. (249) were conducted in patients with brain injury, whereas Salam et al. (304) studied neurologic function as a predictor of reintubation in medical-cardiac ICU patients. Neurologic performance was quantified by requesting patients to perform four simple tasks (307): open their eyes, follow an observer with their eyes, grasp the observer's hand, and stick out their tongue. Reintubation within 72 hours was required in 16% of the patients. Patients tolerating extubation performed a higher number of tasks than did the reintubated patients: 3.8 ± 0.1 versus 2.9 ± 0.5, respectively. Patients who were unable to complete all four tasks were 4.3 times more likely to require reintubation than were patients who could complete all four tasks. The failure to perform any of the four tasks had a sensitivity of 0.42 and specificity of 0.91 in predicting reintubation.
Respiratory Neuromuscular Drive in the Postextubation Period
Increased neuromuscular drive (P0.1 greater than 5 cm H2O) 20 minutes into a T-tube weaning trial has been reported to predict the need for reintubation, with a sensitivity of 0.87 and a specificity 0.91 (308). In contrast to P0.1 values recorded during a T-tube trial (308), measurements of P0.1 during a pressure support weaning trial are less accurate in predicting the need of reintubation (309). In patients with COPD, a rise in P0.1 30 minutes after extubation (as compared to P0.1 values before extubation) may predict the development of postextubation distress (310). Limitations of these studies include lack of prospective validation of P0.1 thresholds and, for the latter study, the need to institute noninvasive ventilation for the sole purpose of measuring P0.1 in all extubated patients.
Treatment of Postextubation Distress
When considering therapies for postextubation distress, it is useful to categorize patients into two groups: patients in whom upper airway obstruction is responsible for postextubation distress, and patients in whom postextubation distress is not due to upper airway obstruction.
Treatment of Postextubation Distress due to Upper Airway Obstruction
The clinical approach to patients with upper airway obstruction must be dictated by great caution, as difficulty or inability to reintubate a patient can cause excess morbidity, including anoxic brain injury and death (289,290). Each patient requires an individualized therapeutic approach; therefore, definite recommendations are problematic (290). Nevertheless, intensivists should have a preplanned strategy for extubation of the difficult airway, including plans to be implemented if it is not possible to maintain an adequate airway after extubation (290). Close consultation with an anesthesiologist and an otolaryngologist must be part of this strategy. Because recommendations on how to approach difficult extubations are essentially based on small clinical series or case reports, the appropriate weighting of each recommendation is a matter of judgment and may be influenced by specific expertise at particular institutions. Upper airway obstruction may worsen suddenly because resistance varies with the fourth power of the radius. A slight change in airway anatomy may dramatically increase resistive load (311). For example, manipulation of the upper airway by an inexperienced clinician may induce edema, which can markedly increase airway resistance and induce asphyxia. In general, pharmacotherapy cannot reverse mechanical obstruction (13). To ensure adequate oxygen stores before extubation, patients should be preoxygenated with an FiO2 of 1.0 for 3 minutes or more (290,312).
Steps for the care of patients with no cuff leak and no identified complicating factors and those for patients with identified complicating factors with or without cuff leak will be discussed separately.
Approach to Patients with No Cuff Leak and No Identified Complicating Factors
When upper airway obstruction is suspected because the patient has failed a cuff-leak test, one possibility is to proceed with extubation while having an anesthesiologist at the bedside. Intubation equipment has to be readily accessible (313). If the patient develops postextubation distress, and reintubation is deemed necessary, the anesthesiologist is immediately available to proceed with reinsertion of the endotracheal tube.
Before extubation, the anesthesiologist may consider placement of an airway exchange catheter (AEC) through the endotracheal tube (Fig. 132.31) (314,315,316,317). Following extubation, the AEC is secured, and humidified oxygen can be insufflated through its central lumen. If the patient does not develop stridor or other signs of respiratory difficulty, the exchange catheter is removed after a variable period of time; exchange catheters have been left in place for up to 72 hours (314). If, however, the patient develops postextubation respiratory distress, and reintubation is deemed necessary, the AEC (with or without the help of laryngoscope) (257) can be used to facilitate reintubation (314,315,316). Should tracheal reintubation prove complicated, jet ventilation can be delivered through the AEC as a bridge to more definitive treatment (258,312,315). To avoid the risk of aspiration, patients should not be fed enterally while the AEC is in place (315).
Occasionally, extubation is performed over a bronchoscope. The bronchoscope provides the opportunity to visually assess the upper airway. When significant abnormalities are noted, the operator must decide whether to immediately reinsert the endotracheal tube or to withdraw the bronchoscope and treat the patient conservatively (see below, racemic epinephrine, heliox, and corticosteroids). Recently (272), the laryngeal mask airway device has been successfully used to rescue the airway in patients with upper airway obstruction when emergency tracheal intubation with direct laryngoscopy was impossible. When using laryngeal mask airway devices without grills, a flexible bronchoscope can be passed through the mask to assess the upper airway, and catheter-guided intubation can be performed through the device (272).
|
|
|
Figure 132.31. Top: The airway exchange catheter is a semirigid catheter designed to maintain airway access following tracheal extubation. Left insert: In the distal 3 cm several side holes are built into the catheter to allow delivery of gas if needed. Right insert: In the proximal end, a 15-mm connector for attachment to oxygen tubing (right) and a Luer lock connector (left) for attachment to jet ventilator circuit. (From Loudermilk EP, Hartmannsgruber M, Stoltzfus DP, et al. A prospective study of the safety of tracheal extubation using a pediatric airway exchange catheter for patients with a known difficult airway. Chest. 1997;111:1660, with permission.) Bottom: A representative patient following maxillofacial reconstructive surgery. The airway exchange catheter is emerging from the right nostril and is connected to an oxygen source. At the time of surgery, the endotracheal tube—through which the airway exchange catheter had been introduced at the time of extubation—was placed nasally. Airway exchange catheters have been used as stylets to facilitate reintubation of medical and surgical patients through the oral and nasal routes (see text for details). (From Dosemeci L, Yilmaz M, Yegin A, et al. The routine use of pediatric airway exchange catheter after extubation of adult patients who have undergone maxillofacial or major neck surgery: a clinical observational study. Crit Care. 2004;8:R385, with permission.) |
When the patient develops postextubation distress with stridor, but immediate reintubation is not considered necessary, some intensivists administer aerosolized epinephrine or racemic epinephrine (as long as the compounds are not contraindicated) (258,315). In adults, aerosolized racemic epinephrine has been given at doses ranging from 0.25 to 0.75 mL of a 2.25% solution in 2.0 to 3.5 mL of normal saline (258,315,319). In patients with laryngeal edema, the response to aerosolized epinephrine or racemic epinephrine can be dramatic but short-lived (318). Therefore, if there is a positive response and patients do not develop side effects, nebulization of epinephrine or racemic epinephrine can be repeated every 1 to 4 hours (318,319); repeated doses of racemic epinephrine every 30 to 60 minutes have also been used (315). Racemic epinephrine consists of equal amounts of the dextro-isomers and levo-isomers. Most of epinephrine's pharmacologic action results from the levo-isomer, which is 30 times more potent than the dextro-isomer (256). Popularity of the more expensive racemic form is based on the supposition that it produces epinephrine's vasoconstrictor action without rebound vasodilation. In addition, less tachycardia, hypertension, and tremor are expected with aerosolized racemic epinephrine than with levo-epinephrine. The stated different actions, however, may have arisen from comparisons of inappropriate dosages (256). In children with postextubation stridor, levo-epinephrine is as effective as the more expensive racemic epinephrine (320).
High-dose corticosteroids—for example, dexamethasone 4 to 8 mg intravenously every 8 to 12 hours (321,322), tapered based on symptoms—may be administered alone or together with aerosolized racemic epinephrine. Whether corticosteroids should be administered before extubation in children (323,324) or in adults (276,277,278,279,300) remains controversial. In a recent investigation conducted in 761 adult patients who had been intubated for more than 36 hours, François et al. (279) reported that, compared to placebo, intravenous methylprednisolone started 12 hours before a planned extubation reduced the incidence of postextubation laryngeal edema from 22% to 3% (p <0.0001) and reduced the incidence of reintubation from 8% to 4% (p = 0.02). The investigators reason that the ineffectiveness of corticosteroids in preventing laryngeal edema reported in previous studies (276,277,325) probably resulted from incorrect timing of administration—all positive trials started corticosteroids 6 to 24 hours before planned extubation (279,300,324), whereas all negative trials started corticosteroids 30 minutes to 6 hours before extubation (276,277,323,325).
François et al. (279) assessed eligibility for extubation (by an unreported mechanism) and then left the patients intubated for a period lasting no less than 12 hours to allow for administration of corticosteroids (or placebo) before proceeding with planned extubation. This strategy was likely conducive to a conservative approach to extubation as supported by the low number of canceled extubations (five patients or 1.3% in the placebo group and three patients or 0.8% in the methylprednisolone group). If such delay indeed occurred in some patients, the extubation strategy of François et al. (279) would be a departure from what is the common practice of most intensivists—i.e., to extubate patients at the earliest feasible time to decrease the risk of iatrogenic complications including ventilator-associated pneumonia. Given the above considerations, it would seem premature to administer intravenous steroids 12 hours before planned extubation in every patient who has been intubated for more than 36 hours. However, for those patients in whom the intensivist has a high suspicion for laryngeal edema (and who do not have contraindications to steroids), the strategy of François et al. (279) seems justifiable.
For patients who do not require high FiO2, helium-oxygen mixture (Heliox) may be tried (322,326,327,328,329,330,331). The goal of this low-density gas mixture is to reduce work of breathing by decreasing the pressure drop associated with turbulent flow across the obstruction.‡ In most cases of airway obstruction, the response to heliox can be seen in minutes (327). If heliox is ineffective, it is likely that turbulent flow is not playing an important role in the patient's stridor. Even when effective, the use of helium-O2 mixtures should not engender a false sense of security (311).
Finally, some authors have used noninvasive ventilation—CPAP (274) or bilevel positive airway pressure (BiPAP) (302,326,331)—alone or in combination with heliox (328). Neither heliox nor noninvasive ventilation have curative properties on their own. Yet, they may be able to “buy time” until the underlying cause of upper airway obstruction has resolved (e.g., laryngeal edema treated with high-dose corticosteroids). None of these pharmacologic and nonpharmacologic strategies has been studied systematically. If stridor does not respond to initial measures or recurs while patients are being treated with noninvasive ventilation, reintubation is usually necessary.
Racemic epinephrine, systemic corticosteroids, heliox, and noninvasive ventilation should be used only in carefully selected patients. Occasionally, the decision to defer intubation may give time to the obstruction of the upper airway to progress to a point at which intubation becomes more difficult, if not impossible (326). Similarly, pharmacologic strategies and noninvasive ventilation should not supplant endotracheal intubation when the upper airway obstruction is critical and expected to progress, e.g., upper airway infection, upper airway tumor awaiting surgery or radiation therapy (326).
Approach to Patients with Identified Complicating Factors with or without Cuff Leak
It may be prudent to have both an anesthesiologist and an otolaryngologist available at bedside–the latter with a tracheostomy tray open and ready to use–during extubation of patients with difficult airway. This category includes patients who fail a cuff-leak test and/or had stridor during the original intubation; have a history of self-extubation or in whom the original intubation was difficult or traumatic; patients who had undergone maxillofacial or major neck surgery; morbidly obese patients; or those with soft tissue swelling. Patients with cervical immobility or instability are also at risk of postextubation respiratory failure (315). If the patient develops postextubation distress, and he/she cannot be immediately be re-intubated, a surgical airway via cricothyrotomy or tracheostomy should be immediately considered. If time permits, and the patient is conscious and still ventilating and oxygenating adequately, some clinicians consider it best to transport the patient to the operating room (288), otherwise the procedure should be performed at the bedside. Although percutaneous tracheostomy is gaining in popularity, it is best performed in an already intubated patient and not as an emergency procedure (288). Jet ventilation through a 14-gauge angiocatheter passed through the cricothyroid membrane is occasionally used as a bridge for more definitive therapy (332,333). This technique is often marred with complications, and operator experience is usually limited (326). In selected patients, extubation should be performed in the operating room.
Unless upper airway tumor is considered as a possible cause of upper airway obstruction, endoscopic visualization of the upper airway before extubation has limited value (334), and it is usually not performed. In some high-risk patients, clinicians may decide to perform an elective tracheostomy (315). A patient with an obstructed airway should not be sedated until the airway has been secured, as minimal sedation may precipitate acute respiratory failure (13).
Treatment of Postextubation Distress Not due to Upper Airway Obstruction
As with patients developing postextubation distress due to upper airway obstruction, patients developing postextubation distress due to other causes require individualized therapy, e.g., chest tube for pneumothorax, bronchodilators for bronchoconstriction, and diuretics for volume overload or negative pressure pulmonary edema (13). In addition to specific therapies, noninvasive ventilation has also been used in patients developing postextubation distress not due to upper airway obstruction (266,335). Two groups of investigators, however, reported that noninvasive ventilation is not beneficial if instituted at a point after patients developed respiratory failure in the 48 hours after extubation (266,335). This contrasts with the accumulating data on the successful use of noninvasive ventilation in weaning (246,247,248).
Keenan et al. (335) studied patients who had received more than 48 hours of mechanical ventilation (overall, 4–5 days). In this study, one of the exclusion criteria was prior history of upper airway obstruction. All study patients were extubated and followed for 48 hours. Of 358 eligible patients, 23% developed criteria of respiratory distress. Of the patients with distress, half were randomly assigned to standard therapy (supplemental O2 to maintain oxygen saturation greater than or equal to 95%), and half to noninvasive ventilation. The rate of reintubation was equivalent for the two groups: 72% for noninvasive ventilation and 69% for usual care, as was hospital mortality (31% for both groups). The duration of conventional mechanical ventilation tended to be shorter with noninvasive ventilation: 8 ± 7 versus 18 ± 28 days (p = 0.11). After the first year of the study, the investigators judged it unethical to withhold noninvasive ventilation in patients with COPD because of published data indicating the superior performance of patients with COPD with noninvasive ventilation. As a result, when the study was concluded, only 11% of the study population had COPD.
Like Keenan et al. (335) and Esteban et al. (266) also investigated the value of instituting noninvasive ventilation in patients after they have developed postextubation distress. All study patients were extubated and then followed for 48 hours. Of 980 eligible patients, 25% (244/980) developed criteria of respiratory distress. Urgent reintubation was necessary in 23 patients (2 patients were reintubated due to upper airway obstruction). Of the remaining patients, 114 were randomly assigned to noninvasive ventilation and 107 to usual care. Reintubation was required in 48% of patients in the noninvasive ventilation group and in 48% of patients in the usual care group. Reasons for reintubation included persistent respiratory distress, lack of improvement in pH or PaCO2, hypoxemia, hypotension, copious secretions, and change in mental status; no patient was reintubated because of upper airway obstruction. Mortality in the ICU was higher with noninvasive ventilation, 25%, than with usual care, 14% (p = 0.048). The interval between extubation and reintubation was longer in the noninvasive ventilation group than in the usual care group: 12 versus 2.5 hours (p = 0.02).
An important aspect of this study (266) concerns the patients who were randomized to the usual care arm. When these patients developed distress and satisfied criteria for intubation, physicians had a choice to either reintubate them or manage them with noninvasive ventilation. Among the 28 patients who were crossed over to noninvasive ventilation, mortality was 11%. These 28 patients represent a sicker subgroup of the 107 patients in the usual care group, yet they had the lowest mortality of all groups requiring ventilator support. Of all patients receiving noninvasive ventilation in the study, these 28 patients were the only ones in whom it was instituted based on a physician's clinical judgment. Thus, it is possible that instituting noninvasive ventilation based on clinical judgment, as opposed to a random allocation, at the point of first observing respiratory distress has a major influence on the success of noninvasive ventilation.
COPD was not an exclusion criterion in the study of Esteban et al. (266). Yet, the fraction of patients with COPD in that study, 10%, was no higher than that in the study of Keenan et al. (335), 11%. The relatively low number of patients with COPD in both studies may have been a major factor in the failure to demonstrate a benefit with noninvasive ventilation. In the study of Esteban et al. (266), the average time between the institution of noninvasive ventilation (for postextubation distress) and reintubation was 12 hours. A substantial proportion of these patients had a decrease in oxygen saturation to less than 85%. It is perhaps not surprising that patients with significant respiratory failure of this magnitude over a prolonged period would experience a higher mortality after reintubation. Although the role of noninvasive ventilation in the management of postextubation distress in patients with COPD is not resolved by these studies, noninvasive ventilation does not appear to have a role in the treatment of other causes of postextubation distress.
A striking feature of the two negative studies is the limited inspiratory assistance that was provided. Patients received IPAP and EPAP settings of 9 and 4 cm H2O, respectively, in the study of Keenan et al. (335), which is equivalent to pressure support of 5 cm H2O. Delivered VT was as little as 5 mL/kg in the study of Esteban et al. (266)—a tidal volume setting too low for most patients in acute respiratory failure, with the possible exception of patients with acute respiratory distress syndrome. The low assistance setting in these two negative studies contrasts with a pressure support setting of 19 ± 2 cm H2O in the study of Nava et al. (246) and the IPAP and EPAP settings of 10 to 20 cm H2O and 4 to 5 cm H2O, respectively, in the study of Ferrer et al. (248). Application of a face mask connected to an inadequate level of positive pressure may pose an impediment for patients, and may have contributed to the negative outcomes in these two studies (266,335).
The only study that has addressed the role of noninvasive ventilation in the prevention of postextubation distress was conducted by Jiang et al. (336). They instituted noninvasive ventilation—initially at IPAP 12 cm H2O and EPAP 5 cm H2O—immediately after extubation. Reintubation was required in 13 of the 47 patients (28%) randomly assigned to noninvasive ventilation and in 7 of the 46 (15%) of patients assigned to usual care. The major problem with this study is that only 56 of the study patients were electively extubated after weaning; the other 37 (40%) patients were enrolled after unplanned extubation. Patients who experience unplanned extubation have a substantially higher rate of reintubation than electively extubated patients, yet the investigators did not state whether these patients were evenly distributed between the two arms of the study. They also do not state how many of their patients had COPD.
In summary, two studies (266,335) suggest that noninvasive ventilation is not beneficial in postextubated patients when instituted after they already have clinical manifestations of respiratory distress. It is possible, however, that noninvasive ventilation is beneficial in the subgroup with COPD. In the two negative studies, it is possible that an inadequate level of positive pressure was supplied to properly test its usefulness in postextubated patients. One can also argue that noninvasive ventilation was unlikely to be beneficial when instituted at such a late stage. An attempt has been made to address the question of whether noninvasive ventilation can prevent the development of postextubation distress (336), but it is not possible to form any conclusion because of the limitations of the study.
Summary
In conclusion, to reduce the possibility of delayed weaning or premature extubation, clinicians should contemplate a two-step diagnostic strategy: first, measurement of weaning predictors and second, a weaning trial. Each step constitutes a diagnostic test, and therefore clinicians must be aware of the scientific principles of diagnostic testing when they interpret the information produced by each step (2). The key point is for physicians to consider the possibility that a patient just may be able to tolerate weaning. Such diagnostic triggering is facilitated through use of a screening test and is the rationale for measurement of weaning predictor tests (2). A positive result on a screening test (weaning predictor test) is followed by a confirmatory test (weaning trial) to increase the possibility that a patient will successfully tolerate extubation. It is important not to postpone the use of a screening test by waiting for a more complex diagnostic test, such as a T-tube trial. In contrast to our greater understanding of the pathophysiology of weaning failure, our understanding of the pathophysiology of severe respiratory distress in the postextubation period is rudimentary.
Acknowledgment
I am grateful to Dr. Martin Tobin for comments when discussing specific contents of this chapter with him.
Supported by a Merit Review Grant from the Veterans Administration Research Service
References
1. Epstein SK. Complications associated with mechanical ventilation. In: Tobin MJ, ed. Principles and Practice of Mechanical Ventilation. 2nd ed. New York, NY: McGraw-Hill: 2006:877–902.
2. Tobin MJ, Jubran A. Weaning from mechanical ventilation. In: Tobin MJ, ed. Principles and Practice of Mechanical Ventilation. 2nd ed. New York, NY: McGraw-Hill; 2006:1185–1220.
3. Kollef MH, Shapiro SD, Silver P, et al. A randomized, controlled trial of protocol-directed versus physician-directed weaning from mechanical ventilation. Crit Care Med. 1997;25(4):567–574.
4. Epstein SK. Etiology of extubation failure and the predictive value of the rapid shallow breathing index. Am J Respir Crit Care Med. 1995;152(2): 545–549.
5. Yang KL, Tobin MJ. A prospective study of indexes predicting the outcome of trials of weaning from mechanical ventilation. N Engl J Med. 1991;324(21):1445–1450.
6. Brochard L, Rauss A, Benito S, et al. Comparison of three methods of gradual withdrawal from ventilatory support during weaning from mechanical ventilation. Am J Respir Crit Care Med. 1994;150(4):896–903.
7. Esteban A, Frutos F, Tobin MJ, et al. A comparison of four methods of weaning patients from mechanical ventilation. Spanish Lung Failure Collaborative Group. N Engl J Med. 1995;332(6):345–350.
8. Rossi A, Poggi R, Roca J. Physiologic factors predisposing to chronic respiratory failure. Respir Care Clin N Am. 2002;8(3):379–404.
9. Esteban A, Alia I, Tobin MJ, et al. Effect of spontaneous breathing trial duration on outcome of attempts to discontinue mechanical ventilation. Spanish Lung Failure Collaborative Group. Am J Respir Crit Care Med. 1999;159(2):512–518.
10. West JB. Pulmonary Pathophysiology: The Essentials. 6th ed. Philadelphia, PA: Lippincott Williams & Wilkins; 2003:68.
11. Gluck EH. Predicting eventual success or failure to wean in patients receiving long-term mechanical ventilation. Chest. 1996;110(4):1018–1024.
12. Younes M. Mechanisms of ventilatory failure. Curr Pulmonol. 1993;14:243–292.
13. Laghi F, Tobin MJ. Indications for mechanical ventilation. In: Tobin MJ, ed. Principles and Practice of Mechanical Ventilation. 2nd ed. New York, NY: McGraw-Hill; 2006:129–162.
14. Jubran A, Tobin MJ. Pathophysiologic basis of acute respiratory distress in patients who fail a trial of weaning from mechanical ventilation. Am J Respir Crit Care Med. 1997;155(3):906–915.
15. Vassilakopoulos T, Zakynthinos S, Roussos C. The tension-time index and the frequency/tidal volume ratio are the major pathophysiologic determinants of weaning failure and success. Am J Respir Crit Care Med. 1998;158(2):378–385.
16. van den BB, Bogaard JM, Hop WC. High fat, low carbohydrate, enteral feeding in patients weaning from the ventilator. Intensive Care Med. 1994;20(7):470–475.
17. Tobin MJ, Perez W, Guenther SM, et al. The pattern of breathing during successful and unsuccessful trials of weaning from mechanical ventilation. Am Rev Respir Dis. 1986;132(6):1111–1118.
18. Sassoon CS, Te TT, Mahutte CK et al. Airway occlusion pressure. An important indicator for successful weaning in patients with chronic obstructive pulmonary disease. Am Rev Respir Dis. 1987;135(1):107–113.
19. Montgomery AB, Holle RH, Neagley SR, et al. Prediction of successful ventilator weaning using airway occlusion pressure and hypercapnic challenge. Chest. 1987;91(4):496–499.
20. Gandia F, Blanco J. Evaluation of indexes predicting the outcome of ventilator weaning and value of adding supplemental inspiratory load. Intensive Care Med. 1992;18(6):327–333.
21. Purro A, Appendini L, De Gaetano A, et al. Physiologic determinants of ventilator dependence in long-term mechanically ventilated patients. Am J Respir Crit Care Med. 2000;161(4 Pt 1):1115–1123.
22. Milic-Emili J, Aubier M. Some recent advances in the study of the control of breathing in patients with chronic obstructive lung disease. Anesth Analg. 1980;59(11):865–873.
23. Laghi F, Tobin MJ. Disorders of the respiratory muscles. Am J Respir Crit Care Med. 2003;168(1):10–48.
24. Tobin MJ, Gardner WN. Monitoring of the control of breathing. In: Tobin MJ, ed. Principles and Practice of Intensive Care Monitoring. New York, NY: McGraw-Hill; 1998:415–464.
25. Laghi F. Assessment of respiratory output in mechanically ventilated patients. Respir Care Clin N Am. 2005;11(2):173–199.
26. Murciano D, Boczkowski J, Lecocguic Y, et al. Tracheal occlusion pressure: a simple index to monitor respiratory muscle fatigue during acute respiratory failure in patients with chronic obstructive pulmonary disease. Ann Intern Med. 1988;108(6):800–805.
27. Cooper KR, Phillips BA. Effect of short-term sleep loss on breathing. J Appl Physiol. 1982;53(4):855–858.
28. Spengler CM, Shea SA. Sleep deprivation per se does not decrease the hypercapnic ventilatory response in humans. Am J Respir Crit Care Med. 2000;161(4 Pt 1):1124–1128.
29. Zakynthinos SG, Vassilakopoulos T, Roussos C. The load of inspiratory muscles in patients needing mechanical ventilation. Am J Respir Crit Care Med. 1995;152(4 Pt 1):1248–1255.
30. D'Angelo E, Calderini E, Robatto FM, et al. Lung and chest wall mechanics in patients with acquired immunodeficiency syndrome and severe Pneumocystis carinii pneumonia. Eur Respir J. 1997;10(10):2343–2350.
31. Appendini L, Purro A, Patessio A, et al. Partitioning of inspiratory muscle workload and pressure assistance in ventilator-dependent COPD patients. Am J Respir Crit Care Med. 1996;154(5):1301–1309.
32. Laghi F, Cattapan SE, Jubran A, et al. Is weaning failure caused by low-frequency fatigue of the diaphragm? Am J Respir Crit Care Med. 2003;167 (2):120–127.
33. Parthasarathy S, Jubran A, Laghi F, et al. Sternomastoid, rib-cage and expiratory muscle activity during weaning failure. J Appl Physiol. 2007; 103(1):140–147. Epub 2007 Mar 29.
34. Zakynthinos SG, Vassilakopoulos T, Zakynthinos E, et al. Contribution of expiratory muscle pressure to dynamic intrinsic positive end-expiratory pressure: validation using the Campbell diagram. Am J Respir Crit Care Med. 2000;162(5):1633–1640.
35. Parthasarathy S, Jubran A, Tobin MJ. Cycling of inspiratory and expiratory muscle groups with the ventilator in airflow limitation. Am J Respir Crit Care Med. 1998;158(5 Pt 1):1471–1478.
36. Jubran A, Tobin MJ. Passive mechanics of lung and chest wall in patients who failed or succeeded in trials of weaning. Am J Respir Crit Care Med. 1997;155(3):916–921.
37. Capdevila X, Perrigault PF, Ramonatxo M, et al. Changes in breathing pattern and respiratory muscle performance parameters during difficult weaning. Crit Care Med. 1998;26(1):79–87.
38. Fiastro JF, Habib MP, Shon BY, et al. Comparison of standard weaning parameters and the mechanical work of breathing in mechanically ventilated patients. Chest. 1988;94(2):232–238.
39. Derenne JP, Couture J, Iscoe S, et al. Occlusion pressures in men rebreathing CO2 under methoxyflurane anesthesia. J Appl Physiol. 1976;40(5):805–814.
40. Tobin MJ, Laghi F. Monitoring respiratory muscle function. In: Tobin MJ, ed. Principles and Practice of Intensive Care Monitoring. New York, NY: McGraw-Hill; 1998:497–544.
41. Zakynthinos S, Routsi C, Vassilakopoulos T, et al. Differential cardiovascular responses during weaning failure: effects on tissue oxygenation and lactate. Intensive Care Med. 2005;31(12):1634–1642.
42. Sassoon CS, Mahutte CK. Airway occlusion pressure and breathing pattern as predictors of weaning outcome. Am Rev Respir Dis. 1993;148(4 Pt 1):860–866.
43. Tahvanainen J, Salmenpera M, Nikki P. Extubation criteria after weaning from intermittent mandatory ventilation and continuous positive airway pressure. Crit Care Med. 1983;11(9):702–707.
44. Laghi F, Harrison MJ, Tobin MJ. Comparison of magnetic and electrical phrenic nerve stimulation in assessment of diaphragmatic contractility. J Appl Physiol. 1996;80(5):1731–1742.
45. Cattapan SE, Laghi F, Tobin MJ. Can diaphragmatic contractility be assessed by airway twitch pressure in mechanically ventilated patients? Thorax. 2003;58(1):58–62.
46. Watson AC, Hughes PD, Louise HM, et al. Measurement of twitch transdiaphragmatic, esophageal, and endotracheal tube pressure with bilateral anterolateral magnetic phrenic nerve stimulation in patients in the intensive care unit. Crit Care Med. 2001;29(7):1325–1331.
47. Polkey MI, Kyroussis D, Hamnegard CH, et al. Diaphragm strength in chronic obstructive pulmonary disease. Am J Respir Crit Care Med. 1996; 154(5):1310–1317.
48. Laghi F, Jubran A, Topeli A, et al. Effect of lung volume reduction surgery on diaphragmatic neuromechanical coupling at 2 years. Chest. 2004; 125(6):2188–2195.
49. Braun NM, Arora NS, Rochester DF. Respiratory muscle and pulmonary function in polymyositis and other proximal myopathies. Thorax. 1983;38(8):616–623.
50. Gibson GJ, Gilmartin JJ, Veale D, et al. Respiratory muscle function in neuromuscular disease. In: Jones NL, Killian KJ, eds. Breathlessness. The Campbell Symposium. Hamilton, Ontario: Boehringer-Ingelheim; 1992: 66–73.
51. Alison JA, Regnis JA, Donnelly PM, et al. End-expiratory lung volume during arm and leg exercise in normal subjects and patients with cystic fibrosis. Am J Respir Crit Care Med. 1998;158(5 Pt 1):1450–1458.
52. Bloch KE, Weder W, Boehler A, et al. Successful lung volume reduction surgery in a child with severe airflow obstruction and hyperinflation due to constrictive bronchiolitis. Chest. 2002;122(2):747–750.
53. Koutsoukou A, Armaganidis A, Stavrakaki-Kallergi C, et al. Expiratory flow limitation and intrinsic positive end-expiratory pressure at zero positive end-expiratory pressure in patients with adult respiratory distress syndrome. Am J Respir Crit Care Med. 2000;161(5):1590–1596.
54. Kimball WR, Leith DE, Robins AG. Dynamic hyperinflation and ventilator dependence in chronic obstructive pulmonary disease. Am Rev Respir Dis. 1982;126(6):991–995.
55. Tuxen DV, Lane S. The effects of ventilatory pattern on hyperinflation, airway pressures, and circulation in mechanical ventilation of patients with severe air-flow obstruction. Am Rev Respir Dis. 1987;136(4):872–879.
56. Laghi F, Jubran A, Topeli A, et al. Effect of lung volume reduction surgery on neuromechanical coupling of the diaphragm. Am J Respir Crit Care Med. 1998;157(2):475–483.
57. Coussa ML, Guerin C, Eissa NT, et al. Partitioning of work of breathing in mechanically ventilated COPD patients. J Appl Physiol. 1993;75(4):1711–1719.
58. Pelosi P, Cereda M, Foti G, et al. Alterations of lung and chest wall mechanics in patients with acute lung injury: effects of positive end-expiratory pressure. Am J Respir Crit Care Med. 1995;152(2):531–537.
59. Laaban JP, Kouchakji B, Dore MF, et al. Nutritional status of patients with chronic obstructive pulmonary disease and acute respiratory failure. Chest. 1993;103(5):1362–1368.
60. Faisy C, Rabbat A, Kouchakji B, et al. Bioelectrical impedance analysis in estimating nutritional status and outcome of patients with chronic obstructive pulmonary disease and acute respiratory failure. Intensive Care Med. 2000;26(5):518–525.
61. Kim J, Heshka S, Gallagher D, et al. Intermuscular adipose tissue-free skeletal muscle mass: estimation by dual-energy X-ray absorptiometry in adults. J Appl Physiol. 2004;97(2):655–660.
62. Murciano D, Rigaud D, Pingleton S, et al. Diaphragmatic function in severely malnourished patients with anorexia nervosa. Effects of renutrition. Am J Respir Crit Care Med. 1994;150(6 Pt 1):1569–1574.
63. Ameredes BT, Watchko JF, Daood MJ, et al. Growth hormone restores aged diaphragm myosin composition and performance after chronic undernutrition. J Appl Physiol. 1999;87(4):1253–1259.
64. Lewis MI, Li H, Huang ZS, et al. Influence of varying degrees of malnutrition on IGF-I expression in the rat diaphragm. J Appl Physiol. 2003;95(2):555–562.
65. Lewis MI, Lorusso TJ, Zhan WZ, et al. Interactive effects of denervation and malnutrition on diaphragm structure and function. J Appl Physiol. 1996;81(5):2165–2172.
66. Schols AM, Soeters PB, Mostert R, et al. Physiologic effects of nutritional support and anabolic steroids in patients with chronic obstructive pulmonary disease. A placebo-controlled randomized trial. Am J Respir Crit Care Med. 1995;152(4 Pt 1):1268–1274.
67. Ryan CF, Whittaker JS, Road JD. Ventilatory dysfunction in severe anorexia nervosa. Chest. 1992;102(4):1286–1288.
68. Lanz JK Jr, Donahoe M, Rogers RM, et al. Effects of growth hormone on diaphragmatic recovery from malnutrition. J Appl Physiol. 1992;73(3):801–805.
69. Martinez FJ, Bermudez-Gomez M, Celli BR. Hypothyroidism. A reversible cause of diaphragmatic dysfunction. Chest. 1989;96(5):1059–1063.
70. Tawa NE, Jr., Odessey R, Goldberg AL. Inhibitors of the proteasome reduce the accelerated proteolysis in atrophying rat skeletal muscles. J Clin Invest. 1997;100(1):197–203.
71. Norrelund H, Hove KY, Brems-Dalgaard E, et al. Muscle mass and function in thyrotoxic patients before and during medical treatment. Clin Endocrinol (Oxf). 1999;51(6):693–699.
72. Goswami R, Guleria R, Gupta AK, et al. Prevalence of diaphragmatic muscle weakness and dyspnoea in Graves' disease and their reversibility with carbimazole therapy. Eur J Endocrinol. 2002;147(3):299–303.
73. Siafakas NM, Milona I, Salesiotou V, et al. Respiratory muscle strength in hyperthyroidism before and after treatment. Am Rev Respir Dis. 1992;146(4):1025–1029.
74. Iandelli I, Gorini M, Duranti R, et al. Respiratory muscle function and control of breathing in patients with acromegaly. Eur Respir J. 1997;10(5):977–982.
75. Mitch WE, Goldberg AL. Mechanisms of muscle wasting. The role of the ubiquitin-proteasome pathway. N Engl J Med. 1996;335(25):1897–1905.
76. Mills GH, Kyroussis D, Jenkins P, et al. Respiratory muscle strength in Cushing's syndrome. Am J Respir Crit Care Med. 1999;160(5 Pt 1):1762–1765.
77. Powers SK, Shanely RA, Coombes JS, et al. Mechanical ventilation results in progressive contractile dysfunction in the diaphragm. J Appl Physiol. 2002;92(5):1851–1858.
78. Yang L, Luo J, Bourdon J, et al. Controlled mechanical ventilation leads to remodeling of the rat diaphragm. Am J Respir Crit Care Med. 2002;166(8):1135–1140.
79. Sassoon CS, Ciaozzo VJ, Manka A, et al. Altered diaphragm contractile properties with controlled mechanical ventilation. J Appl Physiol 2002; 92(6):2585–2595.
80. Sassoon CS, Zhu E, Caiozzo VJ. Assist-control mechanical ventilation attenuates ventilator-induced diaphragmatic dysfunction. Am J Respir Crit Care Med. 2004;170(6):626–632.
81. Radell PJ, Remahl S, Nichols DG, et al. Effects of prolonged mechanical ventilation and inactivity on piglet diaphragm function. Intensive Care Med. 2002;28(3):358–364.
82. Anzueto A, Peters JI, Tobin MJ, et al. Effects of prolonged controlled mechanical ventilation on diaphragmatic function in healthy adult baboons. Crit Care Med. 1997;25(7):1187–1190.
83. Le Bourdelles G, Viires N, Boczkowski J, et al. Effects of mechanical ventilation on diaphragmatic contractile properties in rats. Am J Respir Crit Care Med. 1994;149(6):1539–1544.
84. Radell P, Edstrom L, Stibler H, et al. Changes in diaphragm structure following prolonged mechanical ventilation in piglets. Acta Anaesthesiol Scand. 2004;48(4):430–437.
85. Capdevila X, Lopez S, Bernard N, et al. Effects of controlled mechanical ventilation on respiratory muscle contractile properties in rabbits. Intensive Care Med. 2003;29(1):103–110.
86. Hussain SN, Vassilakopoulos T. Ventilator-induced cachexia. Am J Respir Crit Care Med. 2002;166(10):1307–1308.
87. Shanely RA, Coombes JS, Zergeroglu AM, et al. Short-duration mechanical ventilation enhances diaphragmatic fatigue resistance but impairs force production. Chest. 2003;123(1):195–201.
88. Shanely RA, Zergeroglu MA, Lennon SL, et al. Mechanical ventilation-induced diaphragmatic atrophy is associated with oxidative injury and increased proteolytic activity. Am J Respir Crit Care Med. 2002;166(10): 1369–1374.
89. Zergeroglu MA, McKenzie MJ, Shanely RA, et al. Mechanical ventilation-induced oxidative stress in the diaphragm. J Appl Physiol. 2003;95(3): 1116–1124.
90. Radell P, Edstrom L, Stibler H, et al. Changes in diaphragm structure following prolonged mechanical ventilation in piglets. Acta Anaesthesiol Scand. 2004;48(4):430–437.
91. Capdevila X, Lopez S, Bernard N, et al. Effects of controlled mechanical ventilation on respiratory muscle contractile properties in rabbits. Intensive Care Med. 2003;29(1):103–110.
92. Nguyen T, Friscia M, Kaiser LR, et al. Ventilator-induced proteolysis in human diaphragm myofibers. Proc Am Thorac Soc. 2006;3:A259.
93. Shanely RA, Van Gammeren D, DeRuisseau KC, et al. Mechanical ventilation depresses protein synthesis in the rat diaphragm. Am J Respir Crit Care Med. 2004;170(9):994–999.
94. Crimi E, Liguori A, Condorelli M, et al. The beneficial effects of antioxidant supplementation in enteral feeding in critically ill patients: a prospective, randomized, double-blind, placebo-controlled trial. Anesth Analg. 2004;99(3):857–863.
95. Nathens AB, Neff MJ, Jurkovich GJ, et al. Randomized, prospective trial of antioxidant supplementation in critically ill surgical patients. Ann Surg. 2002;236(6):814–822.
96. Knisely AS, Leal SM, Singer DB. Abnormalities of diaphragmatic muscle in neonates with ventilated lungs. J Pediatr. 1988;113(6):1074–1077.
97. Levine S, Nguyen T, Friscia M, et al. Ventilator-induced atrophy in human diaphragm myofibers. Proc Am Thorac Soc. 2006;3:A27.
98. Pichard C, Kyle U, Chevrolet JC, et al. Lack of effects of recombinant growth hormone on muscle function in patients requiring prolonged mechanical ventilation: a prospective, randomized, controlled study. Crit Care Med. 1996;24(3):403–413.
99. Takala J, Ruokonen E, Webster NR, et al. Increased mortality associated with growth hormone treatment in critically ill adults. N Engl J Med. 1999;341(11):785–792.
100. Hussain SN. Respiratory muscle dysfunction in sepsis. Mol Cell Biochem. 1998;179(1–2):125–134.
101. Leon A, Boczkowski J, Dureuil B, et al. Effects of endotoxic shock on diaphragmatic function in mechanically ventilated rats. J Appl Physiol. 1992;72(4):1466–1472.
102. Lin MC, Ebihara S, El Dwairi Q, et al. Diaphragm sarcolemmal injury is induced by sepsis and alleviated by nitric oxide synthase inhibition. Am J Respir Crit Care Med. 1998;158(5 Pt 1):1656–1663.
103. Aarli JA, Skeie GO, Mygland A, et al. Muscle striation antibodies in myasthenia gravis. Diagnostic and functional significance. Ann N Y Acad Sci. 1998;841:505–515.
104. Callahan LA, Nethery D, Stofan D, et al. Free radical-induced contractile protein dysfunction in endotoxin-induced sepsis. Am J Respir Cell Mol Biol. 2001;24(2):210–217.
105. Supinski G, Nethery D, DiMarco A. Effect of free radical scavengers on endotoxin-induced respiratory muscle dysfunction. Am Rev Respir Dis. 1993;148(5):1318–1324.
106. Taille C, Foresti R, Lanone S, et al. Protective role of heme oxygenases against endotoxin-induced diaphragmatic dysfunction in rats. Am J Respir Crit Care Med. 2001;163(3 Pt 1):753–761.
107. Javesghani D, Magder SA, Barreiro E, et al. Molecular characterization of a superoxide-generating NAD(P)H oxidase in the ventilatory muscles. Am J Respir Crit Care Med. 2002;165(3):412–418.
108. Fujimura N, Sumita S, Aimono M, et al. Effect of free radical scavengers on diaphragmatic contractility in septic peritonitis. Am J Respir Crit Care Med. 2000;162(6):2159–2165.
109. Tiao G, Fagan J, Roegner V, et al. Energy-ubiquitin-dependent muscle proteolysis during sepsis in rats is regulated by glucocorticoids. J Clin Invest. 1996;97(2):339–348.
110. Laghi F. Curing the septic diaphragm with the ventilator. Am J Respir Crit Care Med. 2002;165(2):145–146.
111. Klaude M, Fredriksson K, Tjader I, et al. Proteasome proteolytic activity in skeletal muscle is increased in patients with sepsis. Clin Sci (Lond). 2007;112(9):499–506.
112. Boczkowski J, Lisdero CL, Lanone S, et al. Endogenous peroxynitrite mediates mitochondrial dysfunction in rat diaphragm during endotoxemia. FASEB J. 1999;13(12):1637–1646.
113. El Dwairi Q, Comtois A, Guo Y, et al. Endotoxin-induced skeletal muscle contractile dysfunction: contribution of nitric oxide synthases. Am J Physiol. 1998;274(3 Pt 1):C770–C779.
114. Fredriksson K, Hammarqvist F, Strigard K, et al. Derangements in mitochondrial metabolism in intercostal and leg muscle of critically ill patients with sepsis-induced multiple organ failure. Am J Physiol Endocrinol Metab. 2006;291(5):E1044–E1050.
115. Lanone S, Mebazaa A, Heymes C, et al. Muscular contractile failure in septic patients: role of the inducible nitric oxide synthase pathway. Am J Respir Crit Care Med. 2000;162(6):2308–2315.
116. Bolton CF, Laverty DA, Brown JD, et al. Critically ill polyneuropathy: electrophysiological studies and differentiation from Guillain-Barré syndrome. J Neurol Neurosurg Psychiatry. 1986;49(5):563–573.
117. Fletcher SN, Kennedy DD, Ghosh IR, et al. Persistent neuromuscular and neurophysiologic abnormalities in long-term survivors of prolonged critical illness. Crit Care Med. 2003;31(4):1012–1016.
118. Deem S, Lee CM, Curtis JR. Acquired neuromuscular disorders in the intensive care unit. Am J Respir Crit Care Med. 2003;168(7):735–739.
119. Hund EF, Fogel W, Krieger D, et al. Critical illness polyneuropathy: clinical findings and outcomes of a frequent cause of neuromuscular weaning failure. Crit Care Med. 1996;24(8):1328–1333.
120. Latronico N, Fenzi F, Recupero D, et al. Critical illness myopathy and neuropathy. Lancet. 1996;347(9015):1579–1582.
121. Hermans G, Wilmer A, Meersseman W, et al. Impact of intensive insulin therapy on neuromuscular complications and ventilator dependency in the medical intensive care unit. Am J Respir Crit Care Med. 2007;175(5):480–489.
122. Khan J, Harrison TB, Rich MM, et al. Early development of critical illness myopathy and neuropathy in patients with severe sepsis. Neurology. 2006;67(8):1421–1425.
123. Bednarik J, Vondracek P, Dusek L, et al. Risk factors for critical illness polyneuromyopathy. J Neurol. 2005;252(3):343–351.
124. Larsson L, Li X, Edstrom L, et al. Acute quadriplegia and loss of muscle myosin in patients treated with nondepolarizing neuromuscular blocking agents and corticosteroids: mechanisms at the cellular and molecular levels. Crit Care Med. 2000;28(1):34–45.
125. Rich MM, Teener JW, Raps EC, et al. Muscle is electrically inexcitable in acute quadriplegic myopathy. Neurology 1996;46(3):731–736.
126. Rich MM, Bird SJ, Raps EC, et al. Direct muscle stimulation in acute quadriplegic myopathy. Muscle Nerve. 1997;20(6):665–673.
127. Lefaucheur JP, Nordine T, Rodriguez P, et al. Origin of ICU acquired paresis determined by direct muscle stimulation. J Neurol Neurosurg Psychiatry. 2006;77(4):500–506.
128. Bolton CF. Neuromuscular manifestations of critical illness. Muscle Nerve. 2005;32(2):140–163.
129. Ramsay DA, Zochodne DW, Robertson DM, et al. A syndrome of acute severe muscle necrosis in intensive care unit patients. J Neuropathol Exp Neurol. 1993;52(4):387–398.
130. Faragher MW, Day BJ, Dennett X. Critical care myopathy: an electrophysiological and histological study. Muscle Nerve. 1996;19(4):516–518.
131. Mozaffar T, Haddad F, Zeng M, et al. Molecular and cellular defects of skeletal muscle in an animal model of acute quadriplegic myopathy. Muscle Nerve. 2007;35(1):55–65.
132. Di Giovanni S, Molon A, Broccolini A, et al. Constitutive activation of MAPK cascade in acute quadriplegic myopathy. Ann Neurol. 2004;55(2):195–206.
133. de Letter MA, van Doorn PA, Savelkoul HF, et al. Critical illness polyneuropathy and myopathy (CIPNM): evidence for local immune activation by cytokine-expression in the muscle tissue. J Neuroimmunol. 2000;106 (1–2):206–213.
134. De Jonghe B, Sharshar T, Lefaucheur JP, et al. Paresis acquired in the intensive care unit: a prospective multicenter study. JAMA. 2002;288(22):2859–2867.
135. Faragher MW, Day BJ. A practical approach to weakness in the intensive care unit. In: Cros D, ed. Peripheral Neuropathy: A Practical Approach to Diagnosis and Management. Philadelphia, PA: Lippincott Williams & Wilkins; 2001:370–386.
136. De Jonghe B, Bastuji-Garin S, Sharshar T, et al. Does ICU-acquired paresis lengthen weaning from mechanical ventilation? Intensive Care Med. 2004;30(6):1117–1121.
137. Latronico N, Shehu I, Seghelini E. Neuromuscular sequelae of critical illness. Curr Opin Crit Care. 2005;11(4):381–390.
138. De Jonghe B, Bastuji-Garin S, Durand MC, et al. Respiratory weakness is associated with limb weakness and delayed weaning in critical illness. Crit Care Med. 2007;35(9):2007–2015.
139. Leatherman JW, Fluegel WL, David WS, et al. Muscle weakness in mechanically ventilated patients with severe asthma. Am J Respir Crit Care Med. 1996;153(5):1686–1690.
140. de Seze M, Petit H, Wiart L, et al. Critical illness polyneuropathy. A 2-year follow-up study in 19 severe cases. Eur Neurol. 2000;43(2):61–69.
141. Roberts PA, Loxham SJ, Poucher SM, et al. Bicarbonate-induced alkalosis augments cellular acetyl group availability and isometric force during the rest-to-work transition in canine skeletal muscle. Exp Physiol. 2002;87(4):489–498.
142. Schnader JY, Juan G, Howell S, et al. Arterial CO2 partial pressure affects diaphragmatic function. J Appl Physiol. 1985;58(3):823–829.
143. Juan G, Calverley P, Talamo C, et al. Effect of carbon dioxide on diaphragmatic function in human beings. N Engl J Med 1984;310(14):874–879.
144. Jackson DC, Arendt EA, Inman KC, et al. 31P-NMR study of normoxic and anoxic perfused turtle heart during graded CO2 and lactic acidosis. Am J Physiol. 1991;260(6 Pt 2):R1130–R1136.
145. Yanos J, Wood LD, Davis K, et al. The effect of respiratory and lactic acidosis on diaphragm function. Am Rev Respir Dis. 1993;147(3):616–619.
146. Coast JR, Shanely RA, Lawler JM, et al. Lactic acidosis and diaphragmatic function in vitro. Am J Respir Crit Care Med. 1995;152(5 Pt 1):1648–1652.
147. Knuth ST, Dave H, Peters JR, et al. Low cell pH depresses peak power in rat skeletal muscle fibres at both 30 degrees C and 15 degrees C: implications for muscle fatigue. J Physiol. 2006;575(Pt 3):887–899.
148. Kristensen M, Albertsen J, Rentsch M, et al. Lactate and force production in skeletal muscle. J Physiol. 2005;562(Pt 2):521–526.
149. Posterino GS, Dutka TL, Lamb GD. L(+)-lactate does not affect twitch and tetanic responses in mechanically skinned mammalian muscle fibres. Pflugers Arch. 2001;442(2):197–203.
150. Degroot M, Massie BM, Boska M, et al. Dissociation of [H+] from fatigue in human muscle detected by high time resolution 31P-NMR. Muscle Nerve. 1993;16(1):91–98.
151. Westerblad H, Allen DG, Lannergren J. Muscle fatigue: lactic acid or inorganic phosphate the major cause? News Physiol Sci. 2002;17:17–21.
152. Nielsen OB, de Paoli F, Overgaard K. Protective effects of lactic acid on force production in rat skeletal muscle. J Physiol. 2001;536(Pt 1):161–166.
153. Rafferty GF, Lou HM, Polkey MI, et al. Effect of hypercapnia on maximal voluntary ventilation and diaphragm fatigue in normal humans. Am J Respir Crit Care Med. 1999;160(5 Pt 1):1567–1571.
154. Schnader J, Howell S, Fitzgerald RS, et al. Interaction of fatigue and hypercapnia in the canine diaphragm. J Appl Physiol. 1988;64(4):1636–1643.
155. Mador MJ, Wendel T, Kufel TJ. Effect of acute hypercapnia on diaphragmatic and limb muscle contractility. Am J Respir Crit Care Med. 1997;155(5):1590–1595.
156. Vianna LG, Koulouris N, Moxham J. Lack of effect of acute hypoxia and hypercapnia on muscle relaxation rate in man. Rev Esp Fisiol. 1993;49(1):7–15.
157. Aubier M, Murciano D, Lecocguic Y, et al. Effect of hypophosphatemia on diaphragmatic contractility in patients with acute respiratory failure. N Engl J Med. 1985;313(7):420–424.
158. Aubier M, Viires N, Piquet J, et al. Effects of hypocalcemia on diaphragmatic strength generation. J Appl Physiol. 1985;58(6):2054–2061.
159. Dhingra S, Solven F, Wilson A, et al. Hypomagnesemia and respiratory muscle power. Am Rev Respir Dis. 1984;129(3):497–498.
160. Stedwell RE, Allen KM, Binder LS. Hypokalemic paralyses: a review of the etiologies, pathophysiology, presentation, and therapy. Am J Emerg Med. 1992;10(2):143–148.
161. Rodriguez JA, Crespo-Leiro MG, Paniagua MJ, et al. Rhabdomyolysis in heart transplant patients on HMG-CoA reductase inhibitors and cyclosporine. Transplant Proc. 1999;31(6):2522–2523.
162. Masters BA, Palmoski MJ, Flint OP, et al. In vitro myotoxicity of the 3-hydroxy-3-methylglutaryl coenzyme A reductase inhibitors, pravastatin, lovastatin, and simvastatin, using neonatal rat skeletal myocytes. Toxicol Appl Pharmacol. 1995;131(1):163–174.
163. Sugiyama S. HMG CoA reductase inhibitor accelerates aging effect on diaphragm mitochondrial respiratory function in rats. Biochem Mol Biol Int. 1998;46(5):923–931.
164. Cote HC, Brumme ZL, Craib KJ, et al. Changes in mitochondrial DNA as a marker of nucleoside toxicity in HIV-infected patients. N Engl J Med. 2002;346(11):811–820.
165. Hasfurther DL, Bailey PL. Failure of neuromuscular blockade reversal after rocuronium in a patient who received oral neomycin. Can J Anaesth. 1996;43(6):617–620.
166. Segredo V, Caldwell JE, Matthay MA, et al. Persistent paralysis in critically ill patients after long-term administration of vecuronium. N Engl J Med. 1992;327(8):524–528.
167. de Lemos JM, Carr RR, Shalansky KF, et al. Paralysis in the critically ill: intermittent bolus pancuronium compared with continuous infusion. Crit Care Med. 1999;27(12):2648–2655.
168. Rudis MI, Sikora CA, Angus E, et al. A prospective, randomized, controlled evaluation of peripheral nerve stimulation versus standard clinical dosing of neuromuscular blocking agents in critically ill patients. Crit Care Med. 1997;25(4):575–583.
169. Hirano M, Ott BR, Raps EC, et al. Acute quadriplegic myopathy: a complication of treatment with steroids, nondepolarizing blocking agents, or both. Neurology. 1992;42(11):2082–2087.
170. Gooch JL, Suchyta MR, Balbierz JM, et al. Prolonged paralysis after treatment with neuromuscular junction blocking agents. Crit Care Med. 1991;19(9):1125–1131.
171. Whetstone Foster JG, Clark AP. Functional recovery after neuromuscular blockade in mechanically ventilated critically ill patients. Heart Lung. 2006;35(3):178–189.
172. Murray MJ, Cowen J, DeBlock H, et al. Clinical practice guidelines for sustained neuromuscular blockade in the adult critically ill patient. Crit Care Med. 2002;30(1):142–156.
173. Laghi F, Topeli A, Tobin MJ. Does resistive loading decrease diaphragmatic contractility before task failure? J Appl Physiol. 1998;85(3):1103–1112.
174. Laghi F, D'Alfonso N, Tobin MJ. Pattern of recovery from diaphragmatic fatigue over 24 hours. J Appl Physiol. 1995;79(2):539–546.
175. Travaline JM, Sudarshan S, Roy BG, et al. Effect of N-acetylcysteine on human diaphragm strength and fatigability. Am J Respir Crit Care Med. 1997;156(5):1567–1571.
176. Dahlstedt AJ, Katz A, Westerblad H. Role of myoplasmic phosphate in contractile function of skeletal muscle: studies on creatine kinase-deficient mice. J Physiol. 2001;533(Pt 2):379–388.
177. Radell PJ, Eleff SM, Nichols DG. Effects of loaded breathing and hypoxia on diaphragm metabolism as measured by 31P-NMR spectroscopy. J Appl Physiol. 2000;88(3):933–938.
178. Westerblad H, Bruton JD, Lannergren J. The effect of intracellular pH on contractile function of intact, single fibres of mouse muscle declines with increasing temperature. J Physi. 1997;500:193–204.
179. Zhu E, Comtois AS, Fang L, et al. Influence of tension time on muscle fiber sarcolemmal injury in rat diaphragm. J Appl Physiol. 2000;88(1):135–141.
180. Jiang TX, Reid WD, Road JD. Delayed diaphragm injury and diaphragm force production. Am J Respir Crit Care Med. 1998;157(3 Pt 1):736–742.
181. Thille AW, Rodriguez P, Cabello B, et al. Patient-ventilator asynchrony during assisted mechanical ventilation. Intensive Care Med. 2006;32(10):1515–1522.
182. Chao DC, Scheinhorn DJ, Stearn-Hassenpflug M. Patient-ventilator trigger asynchrony in prolonged mechanical ventilation. Chest.1997;112(6):1592–1599.
183. Bellemare F, Grassino A. Effect of pressure and timing of contraction on human diaphragm fatigue. J Appl Physiol. 1982;53(5):1190–1195.
184. Pinsky MR. Effect of mechanical ventilation on heart-lung interactions. In: Tobin MJ, ed. Principles and Practice of Mechanical Ventilation. New York, NY: McGraw-Hill; 2006:729–757.
185. Hurford WE, Lynch KE, Strauss HW, et al. Myocardial perfusion as assessed by thallium-201 scintigraphy during the discontinuation of mechanical ventilation in ventilator-dependent patients. Anesthesiology. 1991;74(6):1007–1016.
186. Srivastava S, Chatila W, Amoateng-Adjepong Y, et al. Myocardial ischemia and weaning failure in patients with coronary artery disease: an update. Crit Care Med. 1999;27(10):2109–2112.
187. Hurford WE, Favorito F. Association of myocardial ischemia with failure to wean from mechanical ventilation. Crit Care Med. 1995;23(9):1475–1480.
188. Lemaire F, Teboul JL, Cinotti L, et al. Acute left ventricular dysfunction during unsuccessful weaning from mechanical ventilation. Anesthesiology. 1988;69(2):171–179.
189. Nozawa E, Azeka E, Ignez ZM, et al. Factors associated with failure of weaning from long-term mechanical ventilation after cardiac surgery. Int Heart J. 2005;46(5):819–831.
190. Jubran A, Mathru M, Dries D, et al. Continuous recordings of mixed venous oxygen saturation during weaning from mechanical ventilation and the ramifications thereof. Am J Respir Crit Care Med. 1998;158(6):1763–1769.
191. Richard C, Teboul JL. Weaning failure from cardiovascular origin. Intensive Care Med. 2005;31(12):1605–1607.
192. Scheinhorn D. Increase in serum albumin and decrease in body weight correlate with weaning from prolonged mechanical ventilation. Am.Rev.Respir.Dis. 1992;145:A522.
193. Beach T, Millen E, Grenvik A. Hemodynamic response to discontinuance of mechanical ventilation. Crit Care Med. 1973;1(2):85–90.
194. Indihar FJ. A 10-year report of patients in a prolonged respiratory care unit. Minn Med. 1991;74(4):23–27.
195. Martin UJ, Criner GJ. Psychological problems in the ventilated patient. In: Tobin MJ, ed. Principles and Practice of Mechanical Ventilation. 2nd ed. New York, NY: McGraw-Hill; 2006:1137–1151.
196. Banzett RB, Brown R. Addressing respiratory discomfort in the ventilated patient. In: Tobin MJ, ed. Principles and Practice of Mechanical Ventilation. 2nd ed. New York, NY: McGraw-Hill; 2006:1153–1162.
197. Dilling D, Duffner LA, Lawn G, et al. Anxiety levels in patients being weaned from mechanical ventilation. Proc Am Thorac Soc. 2005;2:A161.
198. Ramana RD, Lawn G, Kelly J, et al. Can anxiety be measured in patients weaning from prolonged mechanical ventilation? Proc Am Thorac Soc. 2006;3:A43.
199. Repetz N, Ciccolella DE, Criner GJ. Long-term outcome of patients with delirium on admission to a multidisciplinary ventilator rehabilitation unit (VRU). Am.J Respir.Crit Care Med. 2001;163:A889.
200. Yu BH, Dimsdale JE. Posttraumatic stress disorder in patients with burn injuries. J Burn Care Rehabil. 1999;20(5):426–433.
201. Kress JP, Gehlbach B, Lacy M, et al. The long-term psychological effects of daily sedative interruption on critically ill patients. Am J Respir Crit Care Med. 2003;168(12):1457–1461.
202. Cuthbertson BH, Hull A, Strachan M, et al. Post-traumatic stress disorder after critical illness requiring general intensive care. Intensive Care Med. 2004;30(3):450–455.
203. Hanly PJ. Sleep in the ventilated patient. In: Tobin MJ, ed. Principles and Practice of Mechanical Ventilation. 2nd ed. New York, NY: McGraw-Hill; 2006:1173–1183.
204. Dubois MJ, Bergeron N, Dumont M, et al. Delirium in an intensive care unit: a study of risk factors. Intensive Care Med. 2001;27(8):1297–1304.
205. Ely EW, Gautam S, Margolin R, et al. The impact of delirium in the intensive care unit on hospital length of stay. Intensive Care Med. 2001;27(12):1892–1900.
206. Bergbom-Engberg I, Haljamae H. Assessment of patients' experience of discomforts during respirator therapy. Crit Care Med. 1989;17(10):1068–1072.
207. Johnson CJ, Auger WR, Fedullo PF, et al. Methylphenidate in the ‘hard to wean’ patient. J Psychosom Res. 1995;39(1):63–68.
208. Rothenhausler HB, Ehrentraut S, von Degenfeld G, et al. Treatment of depression with methylphenidate in patients difficult to wean from mechanical ventilation in the intensive care unit. J Clin Psychiatr. 2000;61(10):750–755.
209. Holliday JE, Hyers TM. The reduction of weaning time from mechanical ventilation using tidal volume and relaxation biofeedback. Am Rev Respir Dis. 1990;141(5 Pt 1):1214–1220.
210. Acosta F. Biofeedback and progressive relaxation in weaning the anxious patient from the ventilator: a brief report. Heart Lung. 1988;17(3):299–301.
211. Martin UJ, Hincapie L, Nimchuk M, et al. Impact of whole-body rehabilitation in patients receiving chronic mechanical ventilation. Crit Care Med. 2005;33(10):2259–2265.
212. Elpern EH, Silver MR, Rosen RL, et al. The noninvasive respiratory care unit. Patterns of use and financial implications. Chest. 1991;99(1):205–208.
213. Feinstein AR. Clinical Epidemiology: The Architecture of Clinical Research. Philadelphia, PA: WB Saunders; 1985.
214. Tobin MJ, Jubran A. Variable performance of weaning-predictor tests: role of Bayes' theorem and spectrum and test-referral bias. Intensive Care Med. 2006;32(12):2002–2012.
215. Casscells W, Schoenberger A, Graboys TB. Interpretation by physicians of clinical laboratory results. N Engl J Med. 1978;299(18):999–1001.
216. Meade M, Guyatt G, Cook D, et al. Predicting success in weaning from mechanical ventilation. Ches. 2001;120(6 Suppl):400S–424S.
217. MacIntyre NR, Cook DJ, Ely EW Jr, et al. Evidence-based guidelines for weaning and discontinuing ventilatory support: a collective task force facilitated by the American College of Chest Physicians; the American Association for Respiratory Care; and the American College of Critical Care Medicine. Chest. 2001;120(6 Suppl):375S–395S.
218. Brand R, Kragt H. Importance of trends in the interpretation of an overall odds ratio in the meta-analysis of clinical trials. Stat Med. 1992;11(16): 2077–2082.
219. Schmid CH, Lau J, McIntosh MW, et al. An empirical study of the effect of the control rate as a predictor of treatment efficacy in meta-analysis of clinical trials. Stat Med. 1998;17(17):1923–1942.
220. Engel G, Rockson SG. Rapid diagnosis of myocardial injury with troponin T and CK-MB relative index. Mol Diagn Ther. 2007;11(2):109–116.
221. Voigt GE. Biomechanics of blunt chest injuries especially of the thorax, aorta and heart. Contribution to the problem of the so-called internal safety of personal moor vehicles [in German]. Hefte Unfallheilkd. 1968;96:1–115.
222. Mylonakis E, Calderwood SB. Infective endocarditis in adults. N Engl J Med. 2001;345(18):1318–1330.
223. Sahn SA, Lakshminarayan S. Bedside criteria for discontinuation of mechanical ventilation. Chest. 1973;63(6):1002–1005.
224. Chevrolet JC, Deleamont P. Repeated vital capacity measurements as predictive parameters for mechanical ventilation need and weaning success in the Guillain-Barré syndrome. Am Rev Respir Dis. 1991;144(4):814–818.
225. Brenner M, Mukai DS, Russell JE, et al. A new method for measurement of airway occlusion pressure. Chest. 1990;98(2):421–427.
226. Burki NK. The effects of changes in functional residual capacity with posture on mouth occlusion pressure and ventilatory pattern. Am Rev Respir Dis. 1977;116(5):895–900.
227. Lederer DH, Altose MD, Kelsen SG, et al. Comparison of occlusion pressure and ventilatory responses. Thorax. 1977;32(2):212–220.
228. Brown SD, Gutierrez G. Gut mucosal pH monitoring. In: Tobin MJ, ed. Principles and Practice of Intensive Care Monitoring. 1st ed. New York, NY: McGraw-Hill; 1998:351–368.
229. Bouachour G, Guiraud MP, Gouello JP, et al. Gastric intramucosal pH: an indicator of weaning outcome from mechanical ventilation in COPD patients. Eur Respir J. 1996;9(9):1868–1873.
230. Bocquillon N, Mathieu D, Neviere R, et al. Gastric mucosal pH and blood flow during weaning from mechanical ventilation in patients with chronic obstructive pulmonary disease. Am J Respir Crit Care Med. 1999;160(5 Pt 1):1555–1561.
231. Uusaro A, Chittock DR, Russell JA, et al. Stress test and gastric-arterial PCO2 measurement improve prediction of successful extubation. Crit Care Med. 2000;28(7):2313–2319.
232. Maldonado A, Bauer TT, Ferrer M, et al. Capnometric recirculation gas tonometry and weaning from mechanical ventilation. Am J Respir Crit Care Med. 2000;161(1):171–176.
233. Mohsenifar Z, Hay A, Hay J, et al. Gastric intramural pH as a predictor of success or failure in weaning patients from mechanical ventilation. Ann Intern Med. 1993;119(8):794–798.
234. Tobin MJ. Remembrance of weaning past: the seminal papers. Intensive Care Med. 2006;32(10):1485–1493.
235. Sassoon CS. Intermittent mechanical ventilation. In: Tobin MJ, ed. Principles and Practice of Mechanical Ventilation. 2nd ed. New York, NY: McGraw-Hil; 2006:201–220.
236. Marini JJ, Smith TC, Lamb VJ. External work output and force generation during synchronized intermittent mechanical ventilation. Effect of machine assistance on breathing effort. Am Rev Respir Dis. 1988;138(5):1169–1179.
237. Imsand C, Feihl F, Perret C, et al. Regulation of inspiratory neuromuscular output during synchronized intermittent mechanical ventilation. Anesthesiology. 1994;80(1):13–22.
238. Tomlinson JR, Miller KS, Lorch DG, et al. A prospective comparison of IMV and T-piece weaning from mechanical ventilation. Chest. 1989;96(2):348–352.
239. Brochard L. Pressure-support ventilation. In: Tobin MJ, ed. Principles and Practice of Mechanical Ventilation. 2nd ed. New York, NY: McGraw-Hill; 2006:221–250.
240. Jubran A, Van de Graaff WB, Tobin MJ. Variability of patient-ventilator interaction with pressure support ventilation in patients with chronic obstructive pulmonary disease. Am J Respir Crit Care Med. 1995;152(1):129–136.
241. Straus C, Louis B, Isabey D, et al. Contribution of the endotracheal tube and the upper airway to breathing workload. Am J Respir Crit Care Med. 1998;157(1):23–30.
242. Lellouche F, Mancebo J, Jolliet P, et al. A multicenter randomized trial of computer-driven protocolized weaning from mechanical ventilation. Am J Respir Crit Care Med. 2006;174(8):894–900.
243. Kager LM, Schultz MJ. Computer-driven protocolized weaning from mechanical ventilation. Am J Respir Crit Care Med. 2007;175(9):968–969.
244. Shannon J, Bonett S, Gabrielli A, et al. Evaluation of closed-loop ventilation for patient weaning. Crit Care Med. 2006;34:A91.
245. Jubran A, Grant BJ, Laghi F, et al. Weaning prediction: esophageal pressure monitoring complements readiness testing. Am J Respir Crit Care Med. 2005;171(11):1252–1259.
246. Nava S, Ambrosino N, Clini E, et al. Noninvasive mechanical ventilation in the weaning of patients with respiratory failure due to chronic obstructive pulmonary disease. A randomized, controlled trial. Ann Intern Med. 1998;128(9):721–728.
247. Girault C, Daudenthun I, Chevron V, et al. Noninvasive ventilation as a systematic extubation and weaning technique in acute-on-chronic respiratory failure: a prospective, randomized controlled study. Am J Respir Crit Care Med. 1999;160(1):86–92.
248. Ferrer M, Esquinas A, Arancibia F, et al. Noninvasive ventilation during persistent weaning failure: a randomized controlled trial. Am J Respir Crit Care Med. 2003;168(1):70–76.
249. Namen AM, Ely EW, Tatter SB, et al. Predictors of successful extubation in neurosurgical patients. Am J Respir Crit Care Med. 2001;163(3 Pt 1):658–664.
250. Randolph AG, Wypij D, Venkataraman ST, et al. Effect of mechanical ventilator weaning protocols on respiratory outcomes in infants and children: a randomized controlled trial. JAMA. 2002;288(20):2561–2568.
251. Krishnan JA, Moore D, Robeson C, et al. A prospective, controlled trial of a protocol-based strategy to discontinue mechanical ventilation. Am J Respir Crit Care Med. 2004;169(6):673–678.
252. Marelich GP, Murin S, Battistella F, et al. Protocol weaning of mechanical ventilation in medical and surgical patients by respiratory care practitioners and nurses: effect on weaning time and incidence of ventilator-associated pneumonia. Chest. 2000;118(2):459–467.
253. Ely EW, Baker AM, Evans GW, et al. The prognostic significance of passing a daily screen of weaning parameters. Intensive Care Med. 1999;25(6):581–587.
254. Tobin MJ. Of principles and protocols and weaning. Am J Respir Crit Care Med. 2004;169(6):661–662.
255. Morris AH. Algorithm-based decision making. In: Tobin MJ, ed. Principles and Practice of Intensive Care Monitoring. 1st ed. New York, NY: McGraw-Hill; 1998:1355–1381.
256. Tobin MJ, Laghi F. Extubation. In: Tobin MJ, ed. Principles and Practice of Mechanical Ventilation. 2nd ed. New York, NY: McGraw-Hill; 2006:1221–1237.
257. de la Linde Valverde CM. Extubation of the difficult airway [in Spanish]. Rev Esp Anestesiol Reanim. 2005;52(9):557–570.
258. Gal TG. Airway management. In: Miller RD, ed. Miller's Anesthesia. 6th ed. Philadelphia, PA: Elsevier, Churchill Livingstone; 2005:1617–1652.
259. Leder SB, Cohn SM, Moller BA. Fiberoptic endoscopic documentation of the high incidence of aspiration following extubation in critically ill trauma patients. Dysphagia. 1998;13(4):208–212.
260. El Solh A, Okada M, Bhat A, et al. Swallowing disorders post orotracheal intubation in the elderly. Intensive Care Med. 2003;29(9):1451–1455.
261. Barquist E, Brown M, Cohn S, et al. Postextubation fiberoptic endoscopic evaluation of swallowing after prolonged endotracheal intubation: a randomized, prospective trial. Crit Care Med. 2001;29(9):1710–1713.
262. Leitch EA, Moran JL, Grealy B. Weaning and extubation in the intensive care unit. Clinical or index-driven approach? Intensive Care Med. 1996;22(8):752–759.
263. Conti G, Montini L, Pennisi MA, et al. A prospective, blinded evaluation of indexes proposed to predict weaning from mechanical ventilation. Intensive Care Med. 2004;30(5):830–836.
264. Dojat M, Harf A, Touchard D, et al. Evaluation of a knowledge-based system providing ventilatory management and decision for extubation. Am J Respir Crit Care Med. 1996;153(3):997–1004.
265. Cohen JD, Shapiro M, Grozovski E, et al. Automatic tube compensation-assisted respiratory rate to tidal volume ratio improves the prediction of weaning outcome. Chest. 2002;122(3):980–984.
266. Esteban A, Frutos-Vivar F, Ferguson ND, et al. Noninvasive positive-pressure ventilation for respiratory failure after extubation. N Engl J Med. 2004;350(24):2452–2460.
267. Epstein SK, Ciubotaru RL. Independent effects of etiology of failure and time to reintubation on outcome for patients failing extubation. Am J Respir Crit Care Med. 1998;158(2):489–493.
268. Hammer G, Schwinn D, Wollman H. Postoperative complications due to paradoxical vocal cord motion. Anesthesiology. 1987;66(5):686–687.
269. Harbison J, Dodd J, McNicholas WT. Paradoxical vocal cord motion causing stridor after thyroidectomy. Thorax. 2000;55(6):533–534.
270. Rubin AD, Hawkshaw MJ, Moyer CA, et al. Arytenoid cartilage dislocation: a 20-year experience. J Voice. 2005;19(4):687–701.
271. Tolley NS, Cheesman TD, Morgan D, et al. Dislocated arytenoid: an intubation-induced injury. Ann R Coll Surg Engl. 1990;72(6):353–356.
272. Cook TM, Silsby J, Simpson TP. Airway rescue in acute upper airway obstruction using a ProSeal Laryngeal mask airway and an Aintree catheter: a review of the ProSeal Laryngeal mask airway in the management of the difficult airway. Anaesthesia. 2005;60(11):1129–1136.
273. De Bast Y, De Backer D, Moraine JJ, et al. The cuff leak test to predict failure of tracheal extubation for laryngeal edema. Intensive Care Med. 2002;28(9):1267–1272.
274. Sundaram RK, Nikolic G. Successful treatment of post-extubation stridor by continuous positive airway pressure. Anaesth Intensive Care. 1996;24(3):392–393.
275. Hartley M, Vaughan RS. Problems associated with tracheal extubation. Br J Anaesth. 1993;71(4):561–568.
276. Darmon JY, Rauss A, Dreyfuss D, et al. Evaluation of risk factors for laryngeal edema after tracheal extubation in adults and its prevention by dexamethasone. A placebo-controlled, double-blind, multicenter study. Anesthesiology. 1992;77(2):245–251.
277. Ho LI, Harn HJ, Lien TC, et al. Postextubation laryngeal edema in adults. Risk factor evaluation and prevention by hydrocortisone. Intensive Care Med. 1996;22(9):933–936.
278. Kriner EJ, Shafazand S, Colice GL. The endotracheal tube cuff-leak test as a predictor for postextubation stridor Respir Car. 2005;50(12):1632–1638.
279. François B, Bellissant E, Gissot V, et al. 12-h pretreatment with methylprednisolone versus placebo for prevention of postextubation laryngeal oedema: a randomised double-blind trial. Lancet. 2007;369(9567):1083–1089.
280. Jaber S, Chanques G, Matecki S, et al. Post-extubation stridor in intensive care unit patients. Risk factors evaluation and importance of the cuff-leak test. Intensive Care Med. 2003;29(1):69–74.
281. Smina M, Salam A, Khamiees M, et al. Cough peak flows and extubation outcomes. Ches. 2003;124(1):262–268.
282. Dane TE, King EG. A prospective study of complications after tracheostomy for assisted ventilation. Ches. 1975;67(4):398–404.
283. Pearson FG, Goldberg M, da Silva AJ. Tracheal stenosis complicating tracheostomy with cuffed tubes. Clinical experience and observations from a prospective study. Arch Surg. 1968;97(3):380–394.
284. Stauffer JL, Olson DE, Petty TL. Complications and consequences of endotracheal intubation and tracheotomy. A prospective study of 150 critically ill adult patients. Am J Med. 1981;70(1):65–76.
285. Sandhu RS, Pasquale MD, Miller K, et al. Measurement of endotracheal tube cuff leak to predict postextubation stridor and need for reintubation. J Am Coll Surg. 2000;190(6):682–687.
286. Ferrari LR, Gotta AW. Anesthesia for otolaringologic surgery. In: Barash PG, Cullen BF, Stoelting RK, eds. Clinical Anesthesia. 5th ed. Philadelphia, PA: Lippincott Williams & Wilkins; 2006:997–1012.
287. Patel A, Mitchell V. ENT and maxillofacial surgery. In: Calder I, Pearce A, editors. Core topics in Airway Management. Cambridge University Press, 2005:179.
288. Khosh MM, Lebovics RS. Upper airway obstruction. In: Parrillo JE, Dellinger PR, eds. Critical Care Medicine. Principles of Diagnosis and Management in the Adult. 2nd ed. St. Louis, MO: Mosby; 2001:808–825.
289. Cheney FW, Posner KL, Lee LA, et al. Trends in anesthesia-related death and brain damage: A closed claims analysis. Anesthesiology. 2006;105 (6):1081–1086.
290. Practice guidelines for management of the difficult airway: an updated report by the American Society of Anesthesiologists Task Force on Management of the Difficult Airway. Anesthesiology. 2003;98(5):1269–1277.
291. Tami TA, Chu F, Wildes TO, et al. Pulmonary edema and acute upper airway obstruction. Laryngoscope. 1986;96(5):506–509.
292. Schwartz DR, Maroo A, Malhotra A, et al. Negative pressure pulmonary hemorrhage. Chest. 1999;115(4):1194–1197.
293. Miro AM, Pinsky MR. Heart-lung interactions. In: Tobin MJ, ed. Principles and Practice of Mechanical Ventilation. 1st ed. New York, NY: McGraw-Hill; 1994:647–671.
294. Deepika K, Kenaan CA, Barrocas AM, et al. Negative pressure pulmonary edema after acute upper airway obstruction. J Clin Anesth. 1997;9(5):403–408.
295. Torres A, Gatell JM, Aznar E, et al. Re-intubation increases the risk of nosocomial pneumonia in patients needing mechanical ventilation. Am J Respir Crit Care Med. 1995;152(1):137–141.
296. Zeggwagh AA, Abouqal R, Madani N, et al. Weaning from mechanical ventilation: a model for extubation. Intensive Care Med. 1999;25(10):1077–1083.
297. Adderley RJ, Mullins GC. When to extubate the croup patient: the “leak” test. Can J Anaesth. 1987;34(3 (Pt 1)):304–306.
298. Miller RL, Cole RP. Association between reduced cuff leak volume and postextubation stridor. Chest. 1996;110(4):1035–1040.
299. Engoren M. Evaluation of the cuff-leak test in a cardiac surgery population. Chest. 1999;116(4):1029–1031.
300. Cheng KC, Hou CC, Huang HC, et al. Intravenous injection of methylprednisolone reduces the incidence of postextubation stridor in intensive care unit patients. Crit Care Med. 2006;34(5):1325–1350.
301. Deem S. Limited value of the cuff-leak test. Respir Care. 2005;50(12):1617–1618.
302. Ding LW, Wang HC, Wu HD, et al. Laryngeal ultrasound: a useful method in predicting post-extubation stridor. A pilot study. Eur Respir J. 2006;27(2):384–389.
303. Khamiees M, Raju P, DeGirolamo A, et al. Predictors of extubation outcome in patients who have successfully completed a spontaneous breathing trial. Chest. 2001;120(4):1262–1270.
304. Salam A, Tilluckdharry L, Amoateng-Adjepong Y, et al. Neurologic status, cough, secretions and extubation outcomes. Intensive Care Med. 2004;30(7):1334–1339.
305. Coplin WM, Pierson DJ, Cooley KD, et al. Implications of extubation delay in brain-injured patients meeting standard weaning criteria. Am J Respir Crit Care Med. 2000;161(5):1530–1536.
306. Vallverdu I, Calaf N, Subirana M, et al. Clinical characteristics, respiratory functional parameters, and outcome of a two-hour T-piece trial in patients weaning from mechanical ventilation. Am J Respir Crit Care Med, 1998;158(6):1855–1862.
307. Kress JP, O'Connor MF, Pohlman AS, et al. Sedation of critically ill patients during mechanical ventilation. A comparison of propofol and midazolam. Am J Respir Crit Care Med. 1996;153(3):1012–1018.
308. Capdevila XJ, Perrigault PF, Perey PJ, et al. Occlusion pressure and its ratio to maximum inspiratory pressure are useful predictors for successful extubation following T-piece weaning trial. Chest. 1995;108(2):482–489.
309. Fernandez R, Raurich JM, Mut T, et al. Extubation failure: diagnostic value of occlusion pressure (P0.1) and P0.1-derived parameters. Intensive Care Med. 2004;30(2):234–240.
310. Hilbert G, Gruson D, Portel L, et al. Airway occlusion pressure at 0.1 s (P0.1) after extubation: an early indicator of postextubation hypercapnic respiratory insufficiency. Intensive Care Med. 1998;24(12):1277–1282.
311. King EG, Sheehan GJ, McDonnell TJ. Upper airway obstruction. In: Hall JB, Schmidt GA, Wood LDH, eds. Principles of Critical Care. 1st ed. New York, NY: McGraw-Hill; 1992:1710–1718.
312. Cooper SD, Benumof JL. Airway algorithm: safety considerations. In: Murell RC, Eichhorn JH, eds. Patient Safety in Anesthetic Practice. New York, NY: Churchill Livingstone; 1997:221–262.
313. Practice guidelines for management of the difficult airway. A report by the American Society of Anesthesiologists Task Force on Management of the Difficult Airway. Anesthesiology. 1993;78(3):597–602.
314. Cooper RM. The use of an endotracheal ventilation catheter in the management of difficult extubations. Can J Anaesth. 1996;43(1):90–93.
315. Loudermilk EP, Hartmannsgruber M, Stoltzfus DP, et al. A prospective study of the safety of tracheal extubation using a pediatric airway exchange catheter for patients with a known difficult airway. Chest. 1997;111(6):1660–1665.
316. Dosemeci L, Yilmaz M, Yegin A, et al. The routine use of pediatric airway exchange catheter after extubation of adult patients who have undergone maxillofacial or major neck surgery: a clinical observational study. Crit Care. 2004;8(6):R385–R390.
317. Walz JM, Zayaruzny M, Heard SO. Airway management in critical illness. Chest. 2007;131(2):608–620.
318. Hartley M. Difficulties at tracheal extubation. In: Latto IP, Vaughan RS, eds. Difficulties in Tracheal Intubation. 2nd ed. London, UK: WB Saunders; 1997:347–359.
319. Grabovac MT, Kim K, Quinn TE, et al. Respiratory care. In: Miller RD, ed. Miller's Anesthesia. 6th ed. Philadelphia, PA: Elsevier, Churchill Livingstone; 2005:2811–2830.
320. Nutman J, Brooks LJ, Deakins KM, et al. Racemic versus l-epinephrine aerosol in the treatment of postextubation laryngeal edema: results from a prospective, randomized, double-blind study. Crit Care Med. 1994;22(10):1591–1594.
321. Schmidt GA, Hall JB. Management of the ventilated patient. In: Hall JB, Schmidt GA, Wood LDH, eds. Principles of Critical Care Medicine. 3rd ed. New York, NY: McGraw-Hill; 2005:481–468.
322. Donlon JV, Doyle DJ, Feldman MA. Anesthesia for eye, ear, nose and throat surgery. In: Miller RD, ed. Miller's Anesthesia. 6th ed. Philadelphi, PA: Elsevier, Churchill Livingstone; 2005:2527–2555.
323. Tellez DW, Galvis AG, Storgion SA, et al. Dexamethasone in the prevention of postextubation stridor in children. J Pediatr. 1991;118(2):289–294.
324. Anene O, Meert KL, Uy H, et al. Dexamethasone for the prevention of postextubation airway obstruction: a prospective, randomized, double-blind, placebo-controlled trial. Crit Care Med. 1996;24(10):1666–1669.
325. Ferrara TB, Georgieff MK, Ebert J, et al. Routine use of dexamethasone for the prevention of postextubation respiratory distress. J Perinatol. 1989;9(3):287–290.
326. Gehlbach B, Kress JP. Upper airway obstruction. In: Hall JB, Schmidt GA, Wood LDH, eds. Principles of Critical Care Medicine. 3rd ed. New York, NY: McGraw-Hil; 2005:455–464.
327. Orr JB. Helium-oxygen gas mixtures in the management of patients with airway obstruction. Ear Nose Throat J. 1988;67(12):866, 868–869.
328. Jaber S, Carlucci A, Boussarsar M, et al. Helium-oxygen in the postextubation period decreases inspiratory effort. Am J Respir Crit Care Med. 2001;164(4):633–637.
329. Skrinskas GJ, Hyland RH, Hutcheon MA. Using helium-oxygen mixtures in the management of acute upper airway obstruction. Can Med Assoc J. 1983;128(5):555–558.
330. Boorstein JM, Boorstein SM, Humphries GN, et al. Using helium-oxygen mixtures in the emergency management of acute upper airway obstruction. Ann Emerg Med. 1989;18(6):688–690.
331. Berkenbosch JW, Grueber RE, Graff GR, et al. Patterns of helium-oxygen (heliox) usage in the critical care environment. J Intensive Care Med. 2004;19(6):335–344.
332. Nakatsuka M, MacLeod AD. Hemodynamic and respiratory effects of transtracheal high-frequency jet ventilation during difficult intubation. J Clin Anesth. 1992;4(4):321–324.
333. Smith RB, Babinski M, Klain M, et al. Percutaneous transtracheal ventilation. JACEP. 1976;5(10):765–770.
334. Benjamin B. Prolonged intubation injuries of the larynx: endoscopic diagnosis, classification, and treatment. Ann Otol Rhinol Laryngol Suppl. 1993;160:1–15.
335. Keenan SP, Powers C, McCormack DG, et al. Noninvasive positive-pressure ventilation for postextubation respiratory distress: a randomized controlled trial. JAMA. 2002;287(24):3238–3244.
336. Jiang JS, Kao SJ, Wang SN. Effect of early application of biphasic positive airway pressure on the outcome of extubation in ventilator weaning. Respirology. 1999;4(2):161–165.
337. Sieck GC, Prakash YS. Cross-bridge kinetics in respiratory muscles. Eur Respir J. 1997;10(9):2147–2158.
338. Aubier M, Viires N. Calcium ATPase and respiratory muscle function. Eur Respir J. 1998;11(3):758–766.