Joseph Feldschuh
Effective perfusion requires an optimal interplay between vascular volume and vasomotor tone. In the critical care setting, the blood volume and/or the vasomotor tone may be subject to rapid changes, and a patient may enter the critical care unit with pre-existing disturbances resulting from trauma, disease, or pharmacologic treatment. The intensivist must be able to recognize and treat acute and chronic blood volume disturbances in a manner that will optimize effective perfusion.
In this chapter, we will examine the role that radioisotopic blood volume measurement can play in the critical care unit. We will discuss the physiology of blood volume maintenance and blood volume disturbances, and then introduce the principles underlying radioisotopic blood volume measurement and some technical considerations required for accurate measurement. We will then discuss interpretation of blood volume measurement results in the critical care setting, including general guidelines for understanding blood volume status and several examples of how blood volume measurement can be applied in some common situations.
Physiology of Blood Volume Maintenance
The water in the body (total body water) is divided into two main compartments: The intracellular space (the water in the cells themselves) and the extracellular space. The extracellular space is further divided into the vascular space (the water in the blood) and the interstitial space (the water between the cells and outside the vascular space). Although red blood cells are cellular, they are considered part of the vascular space.
Blood volume, also referred to as circulating blood volume or intravascular volume, is the amount of blood in the vascular space—the vasculature and the chambers of the heart. This is the most important of fluid compartments and is the first to deplete into areas of injury, and the first to replete from intravenous infusion of fluid and blood. Plasma and red blood cells account for more than 99% of the blood volume, while white cells and platelets account for less than 1%. Blood normally comprises approximately 7% of an average adult's body weight, but it can range anywhere from 4% to 10% depending on a person's gender and body composition. Women on average have an 8% lower blood volume and 18% lower red cell volume than men of identical height and weight (1). Leaner people tend to have a higher percentage of blood, while more obese people tend to have a lower percentage.
Plasma Volume Maintenance
The amount of plasma in the circulation adjusts constantly to maintain perfusion, temperature, and hemodynamics. A prime goal of plasma volume maintenance is to maintain a normal whole blood volume and to optimize perfusion to the organs and cells. The albumin and the kidneys play particularly important roles in plasma volume maintenance.
|
|
|
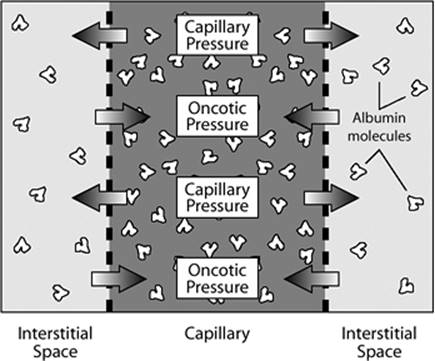
Figure 25.1. Dynamic equilibrium between hydrostatic (capillary) and oncotic pressure. Under normal conditions, there is a balance between the net hydrostatic pressure causing flux from the blood vessels into the interstitial space and the net oncotic pressure causing flux from the interstitial space into the blood vessels. The primary protein responsible for maintaining oncotic pressure is albumin, which occurs at a higher concentration in the blood vessels than in the interstitial space. |
Albumin and Oncotic Pressure
The interstitial space functions in part as a reserve buffer of fluid, available as needed to provide additional fluid to the vascular space or accommodate excess fluid. Under normal circumstances, a constant flux of water across the capillary membranes between the vascular and interstitial spaces maintains a dynamic equilibrium. Hydrostatic pressure is higher in the vasculature than in the interstitial space, which causes water to flow out of the vascular space into the interstitial space. Counterbalancing this, the relatively higher concentration of albumin and other proteins in the vascular space results in a higher oncotic pressure, causing water to flow out of the interstitial space into the vascular space as described by Starling forces (Fig. 25-1).
Albumin is the primary protein responsible for maintaining oncotic pressure. A large enough total pool of albumin is needed to maintain the pressure gradient between the vascular and interstitial spaces, and a low enough capillary permeability is needed to keep albumin from transudating too quickly out of the circulation into the interstitial space. Normally, albumin transudates out of the plasma into the interstitial space at a rate of approximately 0.25% per minute, gets picked up by the lymphatic system, and eventually returns to the circulation via the lymphatic ducts. However, if too much albumin leaves the circulation too quickly, then the relative concentration of vascular albumin to interstitial albumin—and thus the oncotic pressure—decreases, causing a decrease in plasma volume.
The Kidneys and the Renin–Angiotensin–Aldosterone System
The kidneys are of particular importance in blood volume regulation. Under optimal circumstances, the kidneys' rate of excretion of sodium and water adjusts continually to maintain a normal whole blood volume.
When the kidneys receive decreased perfusion, the renin–angiotensin–aldosterone (RAA) system is activated. The RAA system includes both rapid- and slow-response mechanisms. The rapid response, a rise in blood pressure caused by angiotensin-mediated vasoconstriction, occurs almost immediately. The slower response, an increase in plasma volume caused by the actions of angiotensin II and aldosterone, can occur over the course of days.
The kidneys' response is essentially primitive—they respond to changes in perfusion without being able to differentiate the cause. Thus, while the kidneys ideally function to regulate blood volume, sometimes their responses are maladaptive. For example, if an individual has a normal blood volume but has renal artery stenosis or heart failure, the RAA system is activated, vasoconstriction increases, and excess plasma volume is retained even if the individual has a normal or even expanded blood volume.
The pituitary gland also plays a role in blood volume maintenance. It responds to increased concentration of solutes in plasma or decreased blood pressure by secreting antidiuretic hormone (ADH, also known as vasopressin), which stimulates water reabsorption in the kidneys, reducing urine output. Like the kidneys, the pituitary gland responds to indicators of decreased volume without being able to differentiate the cause.
Red Blood Cell Volume Maintenance
Red cell volume is primarily maintained through a balance of production (erythropoiesis) and destruction (hemolysis). Red blood cells are created in the bone marrow and, at the end of their life span, hemolyzed in the spleen or the liver. In the presence of normal bone marrow function, the rate of red cell production is controlled by the hormone erythropoietin, which is produced by the kidney, with the rate of production affected by indicators of blood oxygenation.
If red blood cells are lost (such as through hemorrhage), they can be replaced through the manufacture of new cells by the bone marrow. It can take days to months to replace lost red cells, depending on the amount lost and an individual's capacity for creating new red cells. A study of healthy males who donated 2 units of blood found that the subjects took a month to replace an average of 92% of the lost blood (2).
Pearls
· Optimizing effective perfusion is a prime goal in managing critical care patients. Blood volume (plasma + red cell volume) and vasomotor tone both play key roles in perfusion.
· Clinical utilization of radioisotopic blood volume measurement promises to improve patient care by enabling fluid management decisions to be based on accurate quantification of blood volume, rather than on inaccurate estimates based on surrogate measurements or clinical assessment (see below).
Difficulties in Estimating Blood Volume
Many of the measurements available in a clinical setting are indicators or proxy measurements for perfusion (local or systemic), vasomotor tone (local or systemic), or blood volume. These measurements may include:
· Blood pressure and heart rate
· Blood gases, including pH, base deficit, and lactic acid as estimates of perfusion
· Hematocrit and hemoglobin as surrogate tests for red cell volume
· Blood urea nitrogen (BUN)/creatinine as an estimate of kidney function
· Urine output as an estimate of kidney function and/or perfusion
· Invasive procedures such as pulmonary artery catheterization for determination of intravascular pressures
None of these, however, is a direct measure of volume status. The physician in the critical care setting is faced with the difficult situation of administering or withholding fluids, blood, and blood components on the basis of these surrogate tests. In particular, hemoglobin and hematocrit are frequently inaccurate surrogate markers for blood volume. When using hematocrit or hemoglobin to estimate red cell volume, it is assumed that the whole blood volume remains normovolemic (euvolemic)—for example, that fluid replacement of lost red cells via plasma expansion is rapid and complete. This is frequently not the case. Review articles on fluid management discuss a variety of complex factors to consider when estimating a patient's volume status (3,4,5), and clinical estimation is frequently inaccurate. In a recent study, experienced cardiologists correctly estimated volume status only 51% of the time for 43 nonedematous, ambulatory heart failure patients (6).
Monitoring blood volume using clinical assessment and proxy measurements can be particularly misleading in the critical care setting, because compensatory responses to acute blood volume derangements occur at different rates. Changes in vasomotor tone may occur nearly instantaneously, while changes in plasma volume may occur over hours or days. Following acute blood loss, rapid changes in vasoconstriction, which can occur before any compensatory volume expansion takes place, may maintain a relatively normal peripheral blood pressure and hematocrit at the expense of organ perfusion. Administration of fluids, blood, or blood components can additionally complicate the picture.
Although no studies have explicitly evaluated clinical assessment against blood volume measurement in the critical care unit, a 2003 study (7) compared clinical estimates of intravascular volume with estimates obtained by determining corrected left ventricular flow time from transesophageal Doppler imaging. Clinical estimates agreed with Doppler imaging results only 30% of the time. It is not clear how accurate the Doppler imaging technique is for estimating blood volume, but in some ways this only emphasizes the uncertainty—not only do different methods of assessing volume status disagree, but we don't even know which surrogate methods are the most accurate.
It is a common intuitive assumption that achieving normovolemia facilitates effective perfusion and contributes to improved outcomes. There have, however, been few studies that specifically examined outcomes in relation to accurately measured blood volume with accurate norms. Some recent studies have provided suggestive evidence that achieving normovolemia is a valid goal in a number of clinical settings. In a heart failure study performed at Columbia Presbyterian Hospital, among 43 nonedematous patients, hypervolemic patients had a 2-year mortality rate of 55%, while normovolemic and slightly hypovolemic patients had a 2-year mortality rate of 0% (6). The American College of Cardiology has previously recommended assessment of volume status as an important factor in the diagnosis and treatment of heart failure, but this was the first study to provide a clear association between measured blood volume and patient outcome.
Recent studies have begun to explore how measuring blood volume in the surgical intensive care unit affects patient treatment and outcome (8). Blood volume measurement was performed 86 times for 40 patients with unclear volume statuses. Results led to a change in treatment 36% of the time, and in 42% of those cases, improvement was noted in one or more of the following parameters: Oxygenation, renal dysfunction, vasopressor use, and cardiac index. In the remaining 58% of cases, no improvement was noted, but no treatment changes were detrimental. Because this was a retrospective chart review, the results cannot be used to interpret how blood volume measurement affected outcomes. However, these studies provide preliminary evidence that incorporating blood volume measurement into critical care may impact a significant proportion of patients and may ultimately lead to improved treatment.
|
|
|
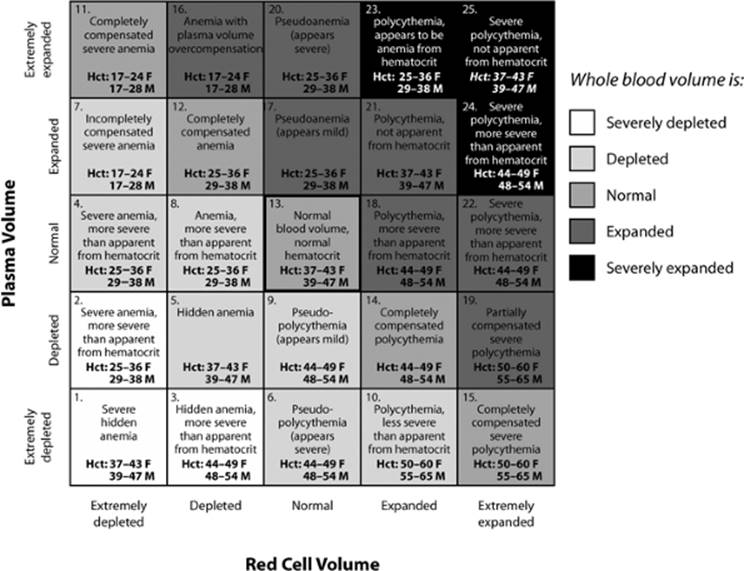
Figure 25.2. Combinations of whole blood volume, red cell volume, and plasma volume disturbances. A number of distinct combinations of whole blood volume, red cell volume, and plasma volume status may be present in a given patient. Different combinations of volume status in each compartment can have different underlying causes, result in different complications, and require different treatment approaches. Considering the hematocrit or the volume in any single compartment alone does not provide sufficient information for fully understanding volume status. Hct, hematocrit. |
|
|
|
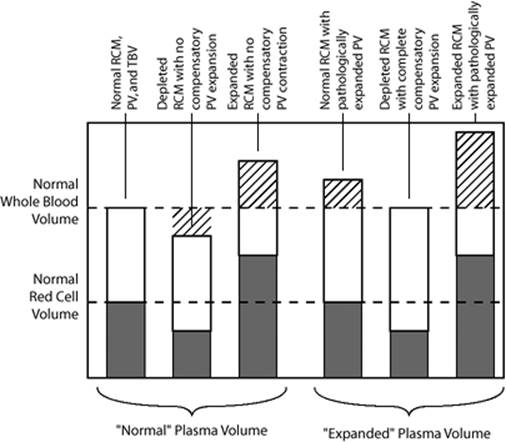
Figure 25.3. Plasma volume in relation to whole blood and red cell volume. Plasma volume must be interpreted in relation to red cell and whole blood volume. Among the left three bars, the “normal” plasma volume is only truly normal in the presence of a normal red cell and whole blood volume. Among the right three bars, the “expanded” plasma volume is in fact compensatory and normal when the red cell volume is depleted. RCM, red cell mass; PV, plasma volume; TBV, total blood volume. |
Blood Volume Disturbances
Blood volume disturbances can occur in the red cell volume, the plasma volume, or both, and can occur to different degrees in each compartment (Fig. 25.2). Whole blood volume and red cell volume abnormalities are considered abnormal when they vary from their respective normal values. However, because homeostatic mechanisms are aimed at maintaining a normal whole blood volume, plasma volume disturbances are only abnormal when they fail to maintain a normal whole blood volume. For example, in a patient with red cell loss, a normal response is for plasma to expand to maintain a normal whole blood volume (Fig. 25.3). Conversely, if a patient has an expanded red cell mass, a contracted plasma volume is normal, although with severe red cell expansion, a balance between maintaining normovolemia and avoiding hemoconcentration occurs.
Blood volume abnormalities in the critical care unit may develop from a wide variety of causes. A patient may enter the critical care unit with existing blood volume disturbances and may experience rapid volume changes in response to acute conditions or volume-altering treatment. Comorbidities such as myocardial infarction, stroke, and diabetes may additionally affect blood volume, blood volume maintenance mechanisms, or response to treatment. Evidence of blood volume disturbances, such as hypotension, oliguria, or pulmonary edema, may or may not be present. Surrogate measurements, such as pressure measurements or hematocrit/hemoglobin measurements, often do not accurately reflect the patient's volume status.
While blood volume measurement will not, in itself, identify all of the factors contributing to a patient's blood volume disturbance, it will allow the physician to precisely quantify that disturbance and may help single out what underlying problems need most acutely to be treated. In addition, treating a patient to normovolemia may ease some of the patient's compensatory mechanisms and buy additional time until the underlying factors can be addressed.
Blood Volume Measurement
The earliest attempts to measure blood volume occurred in animals as early as the mid-1800s (9,10,11,12). In vivo blood volume measurement using the indicator dilution technique was first performed in humans around 1915 (13). This has remained the fundamental method underlying blood measurement.
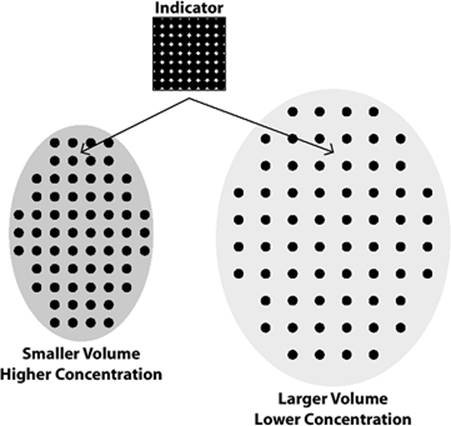
The indicator dilution technique is based on the concept that the concentration of an indicator (or tracer) in an unknown volume is inversely proportional to that volume (Fig. 25.4). Roughly, blood volume measurement is performed as follows: A standard is prepared in which a known quantity of tracer is mixed in a known volume. The same quantity of tracer is injected into the circulation. After the tracer has mixed fully throughout the unknown volume, a sample is withdrawn, and the volume is calculated by comparing the concentration of tracer in the sample to the concentration of tracer in the standard. The gold standard for accurate measurement of blood volume is the indicator dilution technique using radioisotopic tracers. Blood volume measurement can provide information essential to understanding a patient's perfusion status. Although blood volume measurement has historically been infrequently used because of its complexity and length, recent semiautomated technology has enabled practical clinical application of this measurement (14,15).
Technical Considerations for Accurate Blood Volume Measurement
Many factors affect the accuracy and precision of blood volume measurement. The choice of indicator and details in measurement and correction factors can affect the accuracy of results. Because different investigators have used different tracers, sampling methods, and methods of calculation, it is difficult to compare results from different studies. Thus, when reviewing blood volume in the literature, attention should be paid to the reliability of the methods used by the investigators, as well as the methods used to predict each patient's normal blood volume.
|
|
|
Figure 25.4. Indicator dilution. When a tracer (known amount in known volume) is injected into an unknown volume (i.e., intravascular space), the new concentration of the tracer is inversely related to the volume of the space it is injected into. |
Optimal Tracers for Blood Volume Measurement
A prime consideration in blood volume measurement is the choice of indicator. An ideal indicator for blood volume measurement in humans should be harmless; remain unchanged when mixed in the vascular space; mix completely throughout the vascular space and not spread to any other spaces (such as interstitial fluid); and be accurately and precisely measurable.
The first indicators used for human patients were dyes (13,16,17,18,19). Evans blue dye (T-1824) has been one of the most widely studied and utilized dyes for measuring blood volume, and both Evans blue dye and indocyanine green are in current use.
Dyes fill many of the criteria required for a good indicator. They are largely innocuous and mix thoroughly in the plasma volume. However, in some situations, abnormality in the color or turbidity of the blood may lead to errors in measuring dye concentration. The primary drawback to dyes is that they are removed from the circulation at a rapid and variable rate. As with any marker that binds to plasma proteins, dye transudates into the interstitial space at a slow, steady rate. In addition, however, the liver reticuloendothelial cells remove dye rapidly. This disappearance of the dye through two different avenues is difficult to measure or accurately correct for. Additionally, dye can be cleared from the circulation in as little as 20 to 25 minutes. Since it can take 12 to 20 minutes for a tracer to mix completely in the blood volume, there is very little time after mixing is complete and before the dye is cleared from the circulation.
Radioisotopic tracers were introduced for human blood volume measurement in the late 1940s and early 1950s (20,21,22) and have essentially replaced dyes for most applications. Currently, chromium-51 (51Cr) tagged red cells are used for red cell volume measurement, and radioactive iodine (131I and 125I) tagged albumin are used for plasma volume measurement.
Radioisotopic indicators mix more predictably in the vascular space and can be measured more precisely than dyes. Tagged red cells remain in the circulation for the life span of the cell or of the bond between the radioisotope and the cell. No loss of tagged red cells is expected during the 20 to 40 minutes of a blood volume measurement. Although some radioisotopically tagged albumin transudates into the interstitial space, under normal conditions more than 90% of the tracer remains in the circulation during blood volume measurement. Even with an abnormally high capillary permeability, more than 75% of the tagged albumin remains in the circulation after 40 minutes. The rate of transudation can be measured, and a correction performed to determine the true blood volume.
Double versus Single Labeling and the F Ratio
The current gold standard for blood volume measurement, as published by the International Council for Standardization in Hematology (ICSH) in 1980, is simultaneous measurement of red cell volume using radioisotopically tagged red cells and of plasma volume using radioisotopically tagged human serum albumin (23). One of the drawbacks of simultaneously measuring red cell and plasma volume is that it involves the preparation and administration of two radioisotopes, requiring a significant expenditure of time and involving many variables that are vulnerable to human error. In addition, red cell volume measurement requires reinfusion of the patient's own blood. Further, injecting two radioisotopes increases the patient's exposure to radioactivity, even though the exposure from each isotope is very small.
One alternative to double labeling is to precisely measure plasma volume and use the hematocrit to calculate the red cell volume. This procedure is less complicated and more rapid than double labeling, taking on average 90 minutes rather than 4 to 5 hours to complete (24). It is commonly used in research and clinical applications (25,26,27,28,29,30), but it has been controversial as to whether or not it is as accurate as double labeling (29,31,32,33).
One source of possible error arises from the use of the peripheral hematocrit. Because blood vessels throughout the body vary in size, the hematocrit in a large blood vessel (peripheral hematocrit) is higher than the average hematocrit of all the blood in the circulatory system (mean body hematocrit). The ratio of the mean body hematocrit to the peripheral hematocrit is known as the F ratio or F-cell ratio. The mean body hematocrit cannot be directly measured, but it can be calculated by multiplying the measured peripheral hematocrit by a previously determined value for the F ratio.
The F ratio can be measured by comparing the peripheral hematocrit with the ratio of measured red cell volume to whole blood volume. Most studies have found the average F ratio to be 0.91 (33,34,35), although some have found slightly different values (29,36). Some studies have found the F ratio to be consistent among a variety of patients (37,38), while others have found it to vary between subjects (31,32,37) or in the same subjects in response to different conditions (35,39). One difficulty in interpreting these results arises from the fact that different studies used different blood volume measurement methods. Depending on the accuracy and precision of the measurement methods, changes in F ratio may reflect physiologic changes or measurement error.
A more effective way to evaluate the accuracy of calculating whole blood and red cell volume from measured plasma volume and peripheral hematocrit is to compare blood volume results from both methods in the same patients. Few studies have done this. A recent study compared blood volume measurement using the ICSH-recommended method with a semiautomated plasma volume method (BVA-100, Daxor) (24). Measuring plasma volume alone provided results comparable to those from simultaneous measurement, even though there were minor differences in how plasma volume was measured between the two methods. The key advantage of the semiautomated method is that it provides results in 90 minutes and has the potential to provide preliminary results in as little as 20 to 30 minutes. This opportunity for rapid results makes blood volume measurement feasible for clinical use, particularly in acute situations.
Additional Technical Considerations
Mixing Time
Some blood subcircuits in the body, such as the skin, the spleen, and muscles at rest, have significantly slower circulation times than the average circulation time. For blood volume measurement to be complete, the tracer must mix with all the blood, including blood from these slower circuits. Withdrawing one or more samples before mixing is complete results in an erroneously high concentration of tracer, which will be reflected in an erroneously low blood volume. Although early studies erroneously thought that mixing was complete in 4 to 5 minutes, it normally requires 8 to 13 minutes for the radioisotope to fully mix with all the blood in the circulation. In patients with reduced cardiac output, such as with heart failure, up to 20 minutes may be required (40).
Multiple Sample Points
The two key variables that affect the accuracy of a blood volume—the mixing time and the transudation rate—require multiple samples for accurate measurement. With a single sample point, there is no way to determine if mixing is complete when the sample is withdrawn or to calculate the transudation rate and correct to true zero-time plasma volume. With two or three sample points, these key variables may be measured, but an error in a single point can greatly alter the results and cannot be readily detected. For reliable measurement, a minimum of four sample points—preferably five points to accommodate possible removal of erroneous points—should be taken at 6- to 8-minute intervals, beginning 10 to 12 minutes after injection (longer for patients known to have reduced cardiac output).
Plasma Packing
Failure to correct for plasma packing or for heparin used in the collection of samples can result in a false increase of the measured blood volume of 2% to 3% (41).
Accurate Hematocrit Measurement
Hematocrit should be measured using the most accurate currently available technology. Additionally, the hematocrit changes when a person moves from a standing to reclining position. In ambulatory patients, blood volume measurement should be initiated after the patient has been reclining for at least 15 minutes. (This is generally not a consideration for a patient in the intensive care unit, however.)
Duplicate Measurements
To ensure accurate measurements and improved detection of technical errors, all samples should be prepared and counted in duplicate.
Predicting an Individualized Normal Blood Volume
Even when blood volume is measured accurately, it can only be meaningfully interpreted in relation to accurate normal values. A variety of methods for determining normal blood volume, using body weight, body surface area, and (most accurately) body composition, have been developed (42).
The first blood volume norms were based on a fixed ratio of blood volume to body weight (fixed-weight ratio). Fixed-weight ratios are easy to measure and apply, but they are not accurate. Because fat has 2/35 the blood content of lean tissue (43), people with different body compositions have different normal blood volumes per unit of mass. An obese individual has a lower normal blood volume than a very lean individual of the same body weight. Fixed-weight ratio norms tend to systematically underestimate normal blood volume in obese individuals and overestimate it in lean individuals.
Some early studies attempted to develop more accurate norms by categorizing subjects based on body composition (44,45,46). While these studies proved that fixed-weight ratios are inaccurate for many patients, they did not offer viable alternatives, because their methods for evaluation of body composition were subjective and unreliable.
A number of studies have proposed body surface area as an alternative basis for norms (47,48,49,50,51,52,53), including, in 1995, the International Council on Standardization in Hematology (5). However, this method, while more accurate than fixed-weight ratio norms, does not reflect the physiology that underlies differences in blood volume norms. The ICSH paper, recognizing that the body surface area was not reliably accurate, recommended a broad normal range of ±25% from the predicted norm. This included 98% to 99% of the subjects studied, thus maximizing specificity. However, the authors acknowledged that an individual can have a significant blood volume abnormality within this “normal” range, resulting in limited clinical utility.
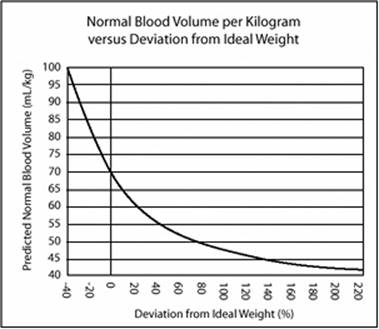
An easily measured, physiologically meaningful method for calculating normal blood volume had been presented in 1977 by Feldschuh and Enson (1). The authors utilized the Metropolitan Life height and weight tables, developed from over 100,000 measurements, which show the ideal weight for any given height based on mortality rates. Feldschuh and Enson hypothesized that individuals of the same deviation from ideal weight would have similar body compositions and hence similar normal blood volumes. They compared measured blood volume from 160 normal individuals of both sexes, with a wide range of height, weight, and body composition, to the subjects' percent deviation from ideal weight. These results were used to extrapolate a curve that described normal blood volume per unit mass in relation to percent deviation from ideal weight (Fig. 25.5). The subjects' blood volumes correlated well with this curve and did not show any systematic deviations based on weight, height, or deviation from ideal weight. In comparison, fixed-weight ratio norms and body surface area norms showed systematic errors and/or wide scatter.
|
|
|
Figure 25.5. The deviation from ideal weight norm. Graph of blood volume norms at a given percent deviation from ideal weight for that height, as developed by Feldschuh and Enson (1). |
Based on these results, Feldschuh and Enson established a category system for interpreting the presence and severity of blood volume abnormalities. A normal blood volume was determined to be within 8% of the predicted normal, a mild hypo- or hypervolemia ±8% to ±16%, moderate ±16% to ±24%, severe ±24% to ±32%, and extreme more than ±32%. This classification scheme has lower specificity than the ICSH category but much higher sensitivity. Presentation of a patient's deviation from the predicted norm in combination with a classification of severity can provide a clinically useful balance between sensitivity and specificity. Milder deviations from normal may be identified more often, enabling earlier diagnosis and treatment, but a clinician can evaluate mild deviations in relation to the patient's specific situation and determine whether treatment or simply additional monitoring is needed. The use of incremental ranges of severity also reflects the fact that blood volume abnormalities may require different treatment approaches based on severity (54).
Interpreting Blood Volume Measurement Results
Units of Measurement
In addition to absolute measurements, blood volume results for each compartment should be presented as the patient's deviation from his or her normal volume, as a percent deviation and in cubic centimeters. For example, a patient with a predicted normal blood volume of 2,500 mL and a measured blood volume of 2,000 mL has a blood volume depletion of -20% and -500 mL. The percentage indicates the severity of the patient's blood volume, and the absolute quantity of the depletion can help guide treatment. There are little data on the optimum blood volume associated with survival in critically ill patients, but due to expansion of intravascular space, a higher than normal value may be desirable (55).
Presentation of measured blood volume solely as an absolute value (such as 3,000 mL or 38 mL/kg) should be avoided, because it does not encourage interpretation of the measured volume in relation to the patient's norm.
Relationship between Whole Blood, Red Cell, and Plasma Volumes
When interpreting blood volume results, the whole blood volume should be considered first, with the red cell volume interpreted in relation to the whole blood volume, and the plasma volume interpreted in relation to both the whole blood and red cell volumes.
A normal whole blood volume may indicate that, even in the presence of anemia or polycythemia, the body's blood volume maintenance mechanisms are functioning appropriately. A depleted whole blood volume may indicate any of a number of disorders and/or maladaptive responses, including (but not limited to) recent acute blood loss, impairment in the kidneys' ability to regulate the blood volume, and iatrogenic causes such as overdiuresis. An expanded whole blood volume may indicate disorders and/or maladaptive responses including (but not limited to) heart failure, inappropriate activation of the RAA system, and iatrogenic causes such as overtransfusion.
The red cell volume should be interpreted in relation to the whole blood volume. For example, a 20% red cell deficit may occur with a normal whole blood volume (fully compensated anemia), a depleted whole blood volume (hypovolemic anemia), or an expanded whole blood volume (anemia with pathologic plasma volume expansion). Each of these is likely to result in markedly different peripheral hematocrits, have different underlying causes, and require different treatment approaches.
An additional tool for evaluating the red cell volume is the “normalized hematocrit,” a ratio of the measured red cell volume to the patient's predicted normal whole blood volume. Unlike the peripheral hematocrit, which can provide a misleading estimate of red cell volume, the normalized hematocrit accurately reflects the red cell volume. Because it is presented in the same units as the peripheral hematocrit, the “normalized hematocrit” can be used in much the same way that hematocrit measurements are currently used (such as for evaluating the extent of anemia and determining transfusion triggers).
The plasma volume should always be considered in relation to the red cell and the whole blood volume. Because alterations in the plasma volume are part of the body's homeostatic mechanisms to maintain a normal blood volume, alterations in plasma volume may be beneficial or maladaptive. In general, if the whole blood volume is normal, then any changes in the plasma volume are compensatory and normal. If the whole blood volume is expanded or depleted, then the plasma volume is maladaptive. A plasma volume alteration may also be partially homeostatic and partially pathologic. For example, if a heart failure patient has anemia and an expanded whole blood volume, then some of the plasma volume is compensatory and some pathologic (see Fig. 25.3).
The Rate of Transudation
When five sample points are used to measure the plasma volume, the rate of decrease of radioisotope concentration over time is calculated in order to determine the true zero-time plasma volume. This rate of decrease reflects the rate of albumin transudation and may provide information about the patient's capillary permeability. The reliability of the transudation rate depends on the accuracy of the plasma volume measurement.
The normal rate of albumin transudation has not been fully established, but studies by Feldschuh and Enson (1) and others have found normal rates to range from a low of 0.05% per minute to a high of 0.45% to 0.50% per minute. Given an accurate blood volume measurement, a transudation rate above 0.50% per minute may be considered evidence of increased capillary permeability, and a rate between 0.45% and 0.50% per minute borderline. In such cases, possible causes of increased capillary permeability, including toxic damage, hypoalbuminemia, capillary leak syndrome, or other causes, should be evaluated and, if possible, treated. Patients with a high transudation rate may require a greater quantity of fluids in order to maintain a normal intravascular volume, and some amount of edema may be tolerated in order to avoid hypovolemia.
A normal transudation rate is not proof that a patient's capillary permeability is normal. An individual may accommodate increased capillary permeability by developing a larger ratio of interstitial to intravascular fluid (likely indicated by edema). The decreased ratio of intravascular to interstitial albumin allows for a normal transudation rate and a new homeostatic balance. This is common in hypoalbuminemia.
A transudation rate of less than 0.05% per minute, and especially a negative slope, is probably an indication of measurement error.
Pearls
· Whole blood, red cell, and plasma volume measurements should each be presented as an absolute measurement and as a deviation from the patient's predicted normal value.
· The normalized hematocrit is the ratio of the measured red cell volume to the predicted normal whole blood volume. It is analogous to the peripheral hematocrit but is an accurate reflection of the red cell volume.
· The slope indicates how quickly albumin is transudating out of the circulation. A high slope (0.0050 or above) may indicate capillary leakage.
· The whole blood volume should be interpreted first, followed by the red cell volume and then plasma volume. Plasma volume should always be viewed in relation to red cell and whole blood volume disturbances, and homeostatic responses should be differentiated from maladaptive responses.
Applications of Blood Volume Measurement in Critical Care
A number of comorbid conditions and other factors may underlie a patient's blood volume disturbance, and different factors may have opposing effects. This may be especially true in a critical care setting, where the interplay between chronic and acute comorbid conditions, as well as treatments aimed at managing fluid balance, can be particularly complex. Clinical status, other measurement results, and medications should be considered when interpreting a patient's blood volume status.
In the critical care setting, a physician often has to consider both the short-term need to achieve effective perfusion and the longer-term need to understand and diagnose underlying problems. Treatment may be aimed at achieving normovolemia directly through fluid management and/or at improving underlying disturbances.
The Need to Detect Blood Volume Disturbances Early
It is important to detect and correct severe blood volume disturbances as quickly as possible. Underperfusion and volume overload can themselves damage organs, which may result in additional worsening of the patient's condition. Conversely, maintaining normovolemia may improve perfusion and oxygen delivery to critical organs and buy time for successful treatment and recovery.
Undetected Hypovolemia
Early detection of hypovolemia is essential. By the time a patient becomes symptomatic, hypovolemia is often extreme, damage may have already occurred to critical organs (the gut and the kidneys are particularly susceptible), and deterioration may be rapid and unexpected (56).
In acute situations, the current primary measures used to track perfusion and evaluate fluid replacement requirements include pressure measurements (such as central venous pressure, intra-arterial or indirect auscultating blood pressure, and pulmonary artery catheter measurements) in conjunction with hematocrit/hemoglobin measurements. However, the body can respond to hypovolemia by initiating vasoconstrictive defense mechanisms, maintaining near-normal pressures even in the face of severe blood loss, and allowing the hypovolemia to remain undetected. A study of surgical intensive care unit patients demonstrated a weak correlation between blood volume results and pulmonary artery occlusion pressure, and no correlation between blood volume values and central venous pressure, cardiac index, and stroke volume index (57).
The patient's vasoconstrictive mechanisms are limited, and critical organs may experience hypoxia even when systemic pressures are near-normal—this situation can be termed “partially compensated shock.” If hypovolemia progresses beyond the ability of the body's vasoconstrictive mechanisms to compensate, the blood pressure may suddenly collapse in disproportionate response to a small incremental decrease in blood volume, and the patient may enter an overt clinical crisis.
Hypovolemia is generally more dangerous and urgent than the same degree of hypervolemia, and sudden blood loss is more urgent than the same degree of chronic hypovolemia. A patient may tolerate a 40% increase in whole blood volume or an 80% increase in red cell volume for some time without suffering acute negative effects, but a 40% loss of blood or an 80% loss of red cells is an extreme medical emergency. A sudden loss of as little as 20% of the blood volume triggers an acute vasoconstrictive response, and a sudden 30% loss can lead to circulatory collapse. A rapid 40% to 45% loss is incompatible with life. Further, an already anemic or hypovolemic patient who experiences sudden blood loss will be less able to tolerate that loss than would a normovolemic or hypervolemic patient.
Even after fluid resuscitation (whether after partially compensated shock or circulatory collapse), damage to the gut and kidneys may result in severe complications. Reperfusion of infarcted bowels can lead to invasion of bacteria from the gut throughout the circulatory system. Hypoxia to the kidneys can damage the tubules, impairing their ability to reabsorb water.
Accurate blood volume measurement enables the treating physician to identify hypovolemia early—preferably before organ damage has occurred—and to place ongoing pressure measurements in context.
Undetected Hypervolemia
In the critical care unit, hypervolemia may be a result of comorbidities or iatrogenic causes such as overtransfusion. Hypervolemia usually develops slowly and is most frequently related to cardiac disease, particularly heart failure. Acute hypervolemia is almost always iatrogenic. Particular attention must be paid to patients who are oliguric or in renal shutdown, as these patients cannot remove excess fluid through urine output.
The hypervolemic patient is at risk for the development of pulmonary edema in response to increased pressure; hypoalbuminemia, which predisposes to pulmonary edema; and pulmonary hypertension as a maladaptive mechanism that may eventually lead to permanent pulmonary hypertension and worsening of heart failure.
It is often assumed that gross peripheral edema is an indication of hypervolemia. However, a hypervolemic patient may be nonedematous and remain undetected (6,25), or an edematous patient may be normovolemic or hypovolemic in the important intravascular space. In the former case, a failure to recognize and treat hypervolemia may lead to the development of pulmonary hypertension or pulmonary edema. In the latter case, aggressive diuresis can precipitate hypovolemia and organ hypoperfusion. Clinical judgment using surrogate markers may not be consistently accurate (8).
Blood volume measurement can be used to accurately diagnose the presence and extent of hypervolemia. Treatment can vary depending on the severity of the patient's hypervolemia and the patient's kidney function and may include fluid restriction, diuretic therapy, hemodialysis if the patient is in kidney failure, or ultrafiltration.
Pearl
· Early detection and treatment of hypovolemia are essential to avoiding organ damage.
The Bleeding Patient: When to Perform Blood Volume Measurement
Bleeding, or more precisely evidence of blood loss, is common in the critical care setting. In blood volume measurement, it is assumed that the red cell volume remains constant during the course of the blood volume measurement. In a patient who is bleeding, this assumption does not hold true. Thus, it is important to evaluate the presence and rate of bleeding in order to determine when it is appropriate to perform a blood volume measurement.
If a patient is massively bleeding at a rate greater than 100 cm3/hour, then blood volume measurement should not be performed. During the immediate stabilization process, fluid pressures should be the primary guide.
Blood volume measurement can be used as an estimate in patients who are losing blood at a rate of less than 100 cm3/hour. A patient bleeding at this rate loses about 2.4 L/day, but only 50 to 60 cm3(approximately 1%–3% of the blood volume) during the 30 to 40 minutes of a blood volume measurement. While a blood volume measurement will be slightly less accurate, it will still provide a reasonable estimate. This is especially true for patients who have severe volume disturbances, as is common in the critical care setting. For example, if a patient is measured to have a blood volume depletion of -30%, even an uncertainty of ±5% does not alter the basic diagnosis of severe hypovolemia. Current practice of using hemoglobin/hematocrit value to guide red cell transfusion may not be addressing severe deviations in red cell volume (58). In a group of surgical intensive care unit patients, comparison of peripheral hematocrit with normalized hematocrit demonstrated a 95% confidence interval limit of agreement of ±15.2 hematocrit % (58).
Tracking Changes in Blood Volume and Performing Follow-up Measurements
After an initial blood volume measurement, it is possible in a nonbleeding patient to track changes in blood volume with precise hematocrit measurements. If the patient's red cell volume remains stable, changes in the hematocrit reflect changes in blood volume as follows:
Plasma volume = Red cell volume × (1 - Hematocrit)/Hematocrit
Whole blood volume = Red cell volume/Hematocrit
For example, consider a patient who is found to have a measured red cell volume of 2,000 mL, plasma volume of 4,000 mL, and hematocrit of 33%. This patient is diuresed, and the hematocrit rises to 40%. The new volume is equal to:
Plasma volume = 2,000 mL × (1 - 0.4)/0.4 = 3,000 mL
Whole blood volume = 2,000/0.4 = 5,000 mL
If a nonbleeding patient receives a transfusion, the volume response may be roughly estimated based on the type of fluid transfused and its expected effect on the hematocrit; a follow-up blood volume measurement may be needed for precise quantification. If a patient is bleeding or otherwise experiences a change in red cell volume that cannot be reasonably estimated, blood volume changes cannot be tracked with precision via changes in hematocrit. A follow-up blood volume measurement should be performed 24 to 48 hours after treatment is initiated.
In general, changes in blood volume may correlate with changes in symptoms, hemodynamic measurements, or clinical status, but these relationships are not necessarily straightforward. In one study of acute decompensated heart failure patients (59), after 24 to 48 hours of treatment blood volume correlated better with some hemodynamic measurements than did brain natriuretic peptide (BNP) levels. However, no measurements correlated closely enough with blood volume results for any hemodynamic measurement to serve as a surrogate measure for volume status, or vice versa.
Blood Volume Measurement in Some Common Critical Care Situations
Following are some examples of common situations in the critical care setting, with discussion of the roles blood volume and blood volume measurement may play in these situations.
Shock
The presentation of symptoms in shock may not be straightforward and can complicate assessment of the patient's volume status, especially in situations where several factors contribute to shock. Blood volume measurement can be of major importance in understanding the underlying cascade of events that precipitate shock and determining appropriate treatment. In a patient with hypovolemia, even in conjunction with other contributing factors, appropriate transfusion and fluid replacement are needed before severe multiorgan hypoperfusion and failure ensues.
For example, following a myocardial infarction, patients frequently become hypotensive. While cardiac damage usually plays a major, if not the predominant, role in the ensuing shock, blood volume derangements may play a significant additional role. A patient with a myocardial infarction may develop hypovolemia from severe vomiting, profuse sweating, or the use of anticoagulants. Sometimes blood loss secondary to gastrointestinal bleeding may trigger a myocardial infarction (MI). Because the blood loss may not be recognized as a precipitating factor in the MI, the patient may not be treated to restore volume. This may progress to renal or multiorgan damage. Accurate assessment of the volume status and prompt treatment of volume derangements are important for all types of shock, even those that do not appear on the surface to be volume related.
Acidosis
Acidosis frequently develops from hypoperfusion and a shift to anaerobic metabolism, resulting in increased lactic acid production. Under these circumstances, the body's metabolic defense mechanisms, which are strongly geared to maintain a pH of 7.4, may be overcome. At a pH of 7.0 to 7.1, major deterioration of all functions including cardiac metabolism occurs. At a pH of 6.85 to 6.9, the body's metabolic systems are so diminished that death is imminent.
Acidosis may also develop from other underlying causes. For example, in diabetic acidosis, ketoacidosis develops from hyperglycemia. Hypovolemia may be a contributing factor, though, because the severely dehydrated patient may have localized ischemia.
Blood volume measurement may be helpful in elucidating the underlying cause of acidosis and determining optimal therapy. If the acidosis is caused by hypoperfusion related to diminished blood volume, aggressive and rapid therapy is needed before irreversible deterioration occurs. In situations such as diabetic acidosis, therapy should also be directed at correcting the underlying condition (such as hyperglycemia) and correction of the electrolyte imbalance.
Hypoalbuminemia
Hypoalbuminemic patients, because of a shift in oncotic pressure, may be predisposed to edema formation in order to achieve a balance of hydrostatic and oncotic pressures that can maintain a normal blood volume. Rather than a normal ratio of 3:1 of extracellular to vascular volume, equilibrium between the two spaces may be reached at a ratio of 4:1 or 5:1. In such patients, the goal is to maintain a normal blood volume even if that means allowing an expanded extracellular volume. It is a common mistake to focus treatment on removal of obvious peripheral edema. Patients with hypoalbuminemia and/or capillary leak syndrome may require a larger volume of extracellular fluid in order to maintain a normal blood volume.
Hepatorenal Syndrome
In hepatorenal syndrome, the liver and kidneys fail simultaneously. Frequently, this syndrome originates with liver damage that progresses to cirrhosis and portal hypertension, causing edema and ascites. If the patient is overdiuresed to remove the edema, the patient becomes hypovolemic and the kidneys hypoperfused. If severe enough, this can lead to kidney failure, liver failure, and circulatory collapse. Hepatorenal syndrome is essentially part of a cascade of circulatory decompensation that, if not corrected, usually results in multiorgan failure and death.
Understanding the blood volume is essential to detecting and correcting this situation. It is usually not possible to diurese a patient with liver damage to completely remove edema, because diuresis does not correct the underlying imbalance between intravascular and interstitial volume. Instead, the reduced fluid simply redistributes throughout the vascular and extravascular space in the same ratio. This situation is similar when using paracentesis to treat ascites. Because paracentesis only removes ascitic fluid and does not address the underlying imbalance, the rapid removal of a large amount of ascitic fluid causes fluid to shift quickly from the vascular to the peritoneal space, resulting in hypovolemia, a drop in blood pressure, and collapse of the circulation.
Blood volume measurement can be performed on a patient with liver problems, edema, and/or ascites to determine what quantity of diuresis is possible without precipitating hypovolemia. A patient who is hypervolemic will be able to tolerate diuresis, and an edematous normovolemic patient should be diuresed only slowly and minimally, with careful follow-up. Some patients with edema and/or ascites may require a blood volume at the upper limit of normal in order to maintain adequate perfusion pressures. A patient who is hypovolemic should not be diuresed!
Oliguria
Oliguria may be an indication of impending renal shutdown resulting from renal hypoperfusion. After fluid is administered and urine flow is re-established, the physician must pay particular attention to urine output. Even a relatively short period of renal hypoperfusion may result in renal tubule damage that persists after reperfusion and impairs the ability of the tubules to reabsorb water and sodium.
Recovery from renal shutdown occurs in two phases—an oliguric phase and a natriuretic phase. In the oliguric phase, which occurs before resuscitation and persists until the kidneys begin to respond to reperfusion, the kidneys produce little to no urine. In this phase, it is important to monitor fluids so that the patient does not become hypervolemic. After the kidney begins to recover, the glomeruli may begin functioning again, but tubular damage may persist, leading to impairment in the kidneys' ability to reabsorb water and sodium. In this natriuretic phase, the patient may produce a large quantity of urine, which, if not replaced with enough fluid, may lead to hypovolemia and additional kidney hypoperfusion.
The transition from the oliguric to the natriuretic phase should be monitored in two main ways. The patient's urine output must be monitored in order to recognize the shift from the oliguric to the natriuretic phase, so that treatment can be altered as appropriate. Additionally, as long as the patient is not bleeding, baseline blood volume measurement followed by subsequent hematocrit measurements can help the physician track changes in the patient's blood volume. Ongoing evaluation of the fluid administration and volume relationship can help the physician more accurately determine the quantity and type of fluids and electrolytes required for the patient to maintain a normal blood volume.
Diuretic Resistance
The term diuretic resistance is frequently used when patients do not respond to relatively large quantities of IV diuretics. To some extent the term may be a misnomer, because diuretic resistance may be a reflection of severe hypoperfusion. A patient in renal shutdown will obviously not respond to diuretics, and occasionally aggressive use of diuretics precipitates renal shutdown. To differentiate true diuretic resistance from hypoperfusion of the kidneys, blood volume measurement in conjunction with renal tests can be helpful. This differentiation is particularly important because aggressive use of diuretics in a patient with marginal perfusion to the kidneys may precipitate renal shutdown.
Inappropriate Antidiuretic Syndrome and Renal Salt Wasting Syndrome: Differential Diagnosis
Hyponatremia, which is seen daily in the critical care unit, results in multiple disturbances at a metabolic level. Two of the primary causes of hyponatremia are syndrome of inappropriate secretion of antidiuretic hormone (SIADH) and renal salt-wasting syndrome. SIADH is often associated with head trauma, neurosurgery, or other neurologic disturbances in which the pituitary gland releases inappropriately high levels of antidiuretic hormone, resulting in the retention of water and the dilution of sodium in an expanded plasma volume. Excessive hypervolemia predisposes a patient to pulmonary hypertension and/or pulmonary edema, the latter of which may lead to sudden death.
In contrast, in renal salt-wasting syndrome the tubules do not reabsorb sufficient quantities of sodium, and too much salt is lost from the circulation into the urine. A particularly important cause of renal salt-wasting syndrome is damage to the tubules caused by hypoperfusion to the kidneys (such as may occur after even relatively short periods of hemorrhage). The tubules are particularly sensitive to damage from hypoperfusion, and when they experience anoxia, they may lose the ability to concentrate urine by reabsorbing sodium and water that has been filtered by the glomeruli. They also lose the ability to excrete acidic urine, which may result in a buildup of acid in the body. The low concentration of sodium contributes to a decrease in plasma volume, which can cause additional or continued hypovolemia, leading to further kidney hypoperfusion and complete renal shutdown.
Blood volume measurement can help differentiate between these two conditions. Given a normal amount of salt and fluid intake, a patient with SIADH will have an expanded blood volume, while a patient with renal salt-wasting syndrome will be hypovolemic. Other conditions, such as glomerular damage or overadministration of fluids, may also result in hyponatremia and an expanded plasma volume; these various diagnoses may be differentiated through results from other tests, such as plasma osmolality and urine and serum sodium, and the patient's clinical condition.
In both cases, it is important to treat the patient to normalize the blood volume and to restore a normal sodium concentration. For SIADH, this can include the administration of hypertonic sodium, fluid restriction, and possibly diuresis. For renal salt-wasting syndrome, this can include the administration of large quantities of fluids and sodium, in quantities sufficient not only to restore the already lost volume, but also to maintain intravascular volume and sodium in the face of continued losses. It is critically important to effectively differentiate between these two syndromes, because for each, treating with inappropriate fluid management can exacerbate the imbalance contributing to the hyponatremia and precipitate a clinical crisis, such as complete renal shutdown.
Cardiogenic and Noncardiogenic Pulmonary Edema: Differential Diagnosis
Cardiogenic pulmonary edema (caused by increased hydrostatic pressure in the alveoli), often secondary to hypervolemia, and noncardiogenic pulmonary edema (caused by damage to the membranes of the alveoli), also known as acute respiratory distress syndrome (ARDS), have different underlying causes and require different treatment approaches. The two conditions may present similar symptoms, and both are common in the critical care setting. When physical examination and noninvasive tests do not provide a definitive distinction, pulmonary capillary wedge pressure is often used to distinguish between the two, but results may be difficult to interpret in patients with pulmonary artery hypertension related to other conditions. Additionally, patients may have a combination of both conditions; increased hydrostatic pressure does not rule out damage to the alveoli. The relationship between blood volume and wedge pressures seems at best weak, with no correlation to central venous pressures (56).
Blood volume measurement, by detecting the presence or absence of hypervolemia, can be used in the differential diagnosis of cardiogenic and noncardiogenic pulmonary edema, especially in patients known to have pulmonary hypertension from other causes and in patients for whom invasive pulmonary artery catheterization is not desirable. Hypervolemia is more likely to be present in a patient with cardiogenic pulmonary edema, while noncardiogenic pulmonary edema may develop in a patient with normovolemia or hypovolemia. However, because both conditions may coexist, hypervolemia does not rule out ARDS. These conditions must also be reviewed in the context of evaluating albumin, as hypoalbuminemia by itself will predispose to pulmonary edema.
Diuretic therapy is a mainstay in the treatment of cardiogenic pulmonary edema. Aggressive diuretic therapy in hypovolemic patients is likely to worsen perfusion and may lead to renal and other organ damage. Hypovolemia can be readily identified with blood volume measurement. Even in patients with hypervolemia, especially if they also have alveolar damage, overly aggressive diuresis may result in hypovolemia and hypoperfusion. Evaluating the extent of hypervolemia and evaluating volume in relation to pressure measurements can help the physician determine how to diurese the patient safely. In a nonbleeding patient, once an initial blood volume is established, the hematocrit can be helpful in monitoring blood volume changes and tracking the patient's response to diuresis.
Summary
While fluid resuscitation and blood volume management have long been mainstays in critical care, evaluation of blood volume has traditionally relied on assessment of the patient's clinical condition, which is often misleading, and surrogate measurements to estimate volume status, which are often inaccurate. Blood volume measurement has been a missing link in treating critically ill patients, and the clinical utilization of semiautomated radioisotopic blood volume measurement promises to complete that link.
On the simplest level, blood volume measurement results can be used to guide treatment more precisely; rather than relying on inaccurate surrogate measurements to estimate volume status, blood volume measurement results can be considered when making fluid management decisions. Additional tools such as the normalized hematocrit can be used as quickly understood, more accurate guides for determining when transfusion is required.
In addition, blood volume measurement, by providing an accurate, quantitative measurement of circulating blood volume, offers the opportunity to develop evidence-based approaches to treating volume derangements. Treatment algorithms with precise end points can be developed and tested, with an ultimate goal of developing a comprehensive, evidence-based approach to evaluating and treating blood volume derangements in the critical care setting.
References
1. Feldschuh J, Enson Y. Prediction of the normal blood volume. Relation of blood volume to body habitus. Circulation. 1977;56(4 Pt 1):605–612.
2. Valeri CR, Ragno G, Srey R. Restoration of red blood cell volume following 2-unit red blood cell apheresis. Vox Sang. 2003;85(2):85–87.
3. Gutierrez G, Reines HD, Wulf-Gutierrez ME. Clinical review: hemorrhagic shock. Crit Care. 2004;8(5):373–381. Epub 2004 Apr 2.
4. McGee S, Abernethy WB, Simel DL. Is this patient hypovolemic? JAMA. 1999;281:11.
5. Kreimeier U. Pathophysiology of fluid imbalance. Crit Care. 2000;4(Suppl 2):S3–7. Epub 2000 Oct 13.
6. Androne AS, Hryniewicz K, Hudaihed A, et al. Relation of unrecognized hypervolemia in chronic heart failure to clinical status, hemodynamics, and patient outcomes. Am J Cardiol. 2004;93(10):1254–1259.
7. Iregui MG, Prentice D, Sherman G, et al. Physicians' estimates of cardiac index and intravascular volume based on clinical assessment versus transesophageal Doppler measurements obtained by critical care nurses. Am J Crit Care. 2003;12(4):336–342.
8. Takanishi DM, Biuk-Aghai E, Yu M, et al. Availability of circulating blood volume alters fluid management in critically ill surgical patients. Am J Surg. In press.
9. Meek WJ, Glasser HS. Blood volume: a method for its determination with data for dogs, cats, and rabbits. Am J Physiol. 1918;47:302–317.
10. Dreyer G, Ray W. The blood volume of mammals as determined by experiments upon rabbits, guinea-pigs, and mice; and its relationship to the body weight and to the surface area expressed in a formula. Philos Tran R Soc. 1911;201:133–160.
11. Sjostrand T. Blood volume. In: Hamilton WF, Dow P, eds. Handbook of Physiology, Section 2: Circulation. Vol. 1. Washington, DC: American Physiological Society; 1962:51–53.
12. Rasmussen AT, Rasmussen GB. The volume of blood during hibernation and other periods of year in the woodchuck (Marmatoa monax). Am J Physiol. 1917;44:132–148.
13. Keith NM, Rountree LG, Geraghty JT. A method for the determination of plasma and blood volume. Arch Intern Med. 1915;16:547.
14. Manzone TA, Dam HQ, Soltis D, et al. Blood volume analysis: a new technique and new clinical interest reinvigorate a classic study. J Nucl Med Technol. 2007;35(2):55–63.
15. Ertl AC, Diedrich A, Raj SR. Techniques used for the determination of blood volume. Am J Med Sci. 2007;334(1):32–36.
16. Smith HP. Blood volume studies II. Repeated determination of blood volume and short intervals by means of the dye method. Am J Physiol. 1920;51:221.
17. Smith HP. The fate of an intravenously injected dye (brilliant vital red) with special reference to its use in blood volume determination. Bull Johns Hopkins Hosp. 1925;36:325.
18. Gergersen MI, Gibson JJ, Stead EA. Plasma volume determination with dyes, errors in colorometry: use of the blue dye T-1824. Am J Physiol (Proc). 1935;113:54.
19. Bradley EC, Barr JW. Determination of blood volume using indocyanine green (Cardio-Green) dye. Life Sci. 1968;7:1001–1007.
20. Hevesy G, Zerahn K. Acta Physiol Scand. 1942;4:376.
21. Gray SJ, Sterling K. The tagging of red cells and plasma proteins with radioactive chromium. J Clin Invest. 1950;29:1604–1613.
22. Storaasli JP, Kriefer H, Friedell HL, et al. Surg Gynecol Obstet. 1950;91:458.
23. Recommended methods for measurement of red-cell and plasma volume: International Committee for Standardization in Haematology. J Nucl Med. 1980;21(8):793–800.
24. Dworkin H, Premo M, Dees S. Comparison of red cell and whole blood volume as performed using both chromium-51 tagged red cells and iodine-125 tagged albumin and using I-131 tagged albumin and extrapolated red cell volume. Am J Med Sci. 2001;334(1):32.
25. Androne AS, Katz SD, Lund L, et al. Hemodilution is common in patients with advanced heart failure. Circulation. 2003;107(2):226–229.
26. Mancini DM, Katz SD, Lang CC, et al. Effect of erythropoietin on exercise capacity in patients with moderate to severe chronic heart failure. Circulation. 2003;107(2):294–299.
27. Shevde K, Pagala M, Tyagaraj C, et al. Preoperative blood volume deficit influences blood transfusion requirements in females and males undergoing coronary bypass graft surgery. J Clin Anesth. 2002;14(7):512–517.
28. Alrawi SJ, Miranda LS, Cunningham JN Jr, et al. Correlation of blood volume values and pulmonary artery catheter measurements. Saudi Med J. 2002;23(11):1367–1372.
29. Fairbanks VF, Klee GG, Wiseman GA, et al. Measurement of blood volume and red cell mass: re-examination of 51Cr and 125I methods. Blood Cells Mol Dis. 1996;22(2):169–186; discussion 186a–186g.
30. Davy KP, Seals DR. Total blood volume in healthy young and older men. J Appl Physiol. 1994;76(5):2059–2062.
31. Balga I, Solenthaler M, Furlan M. Should whole-body red cell mass be measured or calculated? Blood Cells Mol Dis. 2000;26(1):25–31; discussion 32–36.
32. Nielsen S, Rodbro P. Validity of rapid estimation of erythrocyte volume in the diagnosis of polycythemia vera. Eur J Nucl Med. 1989;15(1):32–37.
33. Olmer M, Berland Y, Purgus R, et al. Determination of blood volume in nephrotic patients. Am J Nephrol. 1989;9(3):211–214.
34. Akira T, Tomoyuki I, Kazuhiro Y, et al. Effect of an exercise-heat acclimation program on body fluid regulatory responses to dehydration in older men. Am J Physiol Regul Integr Comp Physiol. 1999;277:R1041–R1050.
35. Lundvall J, Lindgren P. F-cell shift and protein loss strongly affect validity of PV reductions indicated by Hb/Hct and plasma proteins. J Appl Physiol. 1998;84:822–829.
36. Lee SMC, Williams WJ, Schneider SM. Role of skin blood flow and sweating rate in exercise thermoregulation after bed rest. J Appl Physiol. 2002;92:2026–2034.
37. Najean Y, Deschrywer F. The body/venous haematocrit ratio and its use for calculating total blood volume from fractional volumes. Eur J Nucl Med. 1984;9(12):558–560.
38. Chaplin H Jr, Mollison PL, Vetter H. The body/venous hematocrit ratio: its constancy over a wide hematocrit range. J Clin Invest. 1953;32(12):1309–1316.
39. Haller M, Brechtelsbauer H, Akbulut C, et al. Isovolemic hemodilution alters the ratio of whole-body to large-vessel hematocrit (F-cell ratio). A prospective, randomized study comparing the volume effects of hydroxyethyl starch 200,000/0.62 and albumin. Infusions Ther Transfusion Med. 1995;22(2):74–80.
40. Jaenike JR, Schreiner BF Jr, Waterhouse C. The relative volumes of distribution of I131 tagged albumin and high molecular weight dextran in normal subjects and patients with heart disease. J Lab Clin Med. 1957;49:172–181.
41. Chaplin H Jr, Mollison PL. Correction for plasma trapped in red cell column of hematocrit. Blood. 1952;7:1227.
42. Feldschuh J, Katz S. The importance of correct norms in blood volume measurement. Am J Med Sci. 2007;334(1):41–46.
43. Jacobs DS, Demott WR, et al. Laboratory Test Handbook. 4th ed. Lexi-Comp Inc.; 1996:306.
44. Gregersen MI, Nickerson JL. Relation of blood volume and cardiac output to body type. J Appl Physiol. 1950;3(6):329–341.
45. Keys A, Brozek J, Henschel A, et al. The Biology of Human Starvation. Minneapolis: University of Minnesota Press; 1950.
46. Alexander JK, Dennis EW, Smight WG, et al. Blood volume, cardiac output, and distribution of systemic blood flow in extreme obesity. Cardiovasc Res Cent Bull. 1962-1963[Winter];1:39–44.
47. Samet P, Fritts HW Jr, Fishman AP, et al. The blood volume in heart disease. Medicine (Baltimore). 1957;36(2):211–235.
48. Baker RT, Kozoll DD, et al. The use of surface area as a basis for establishing normal blood volume. Surg Gynecol Obstet. 1957;104:183–189.
49. Wennesland R, Brown E, Hopper J, et al. Red cell, plasma and blood volume in healthy men measured by radiochromium (Cr51) cell tagging and hematocrit: influence of age, somatotype and habits of physical activity on the variance after regression of volumes to height and weight combined. J Clin Invest. 1959;38(7):1065–1077.
50. Nadler SB, Hidalgo JU, Bloch T. Prediction of blood volume in normal human adults. Surgery. 1962;51:224–232.
51. Retzlaff JA, Tause WN, Kielly JM. Erythrocyte volume, plasma volume and lean body mass in adult men and women. Blood. 1969;33:649–661.
52. Hurley PJ. Red cell and plasma volumes in normal adults. J Nucl Med. 1975;16:46–52.
53. Pearson TC, Guthrie DL, Simpson J, et al. Interpretation of measured red cell mass and plasma volume in adults: Expert Panel on Radionuclides of the International Council for Standardization in Haematology. Br J Haematol. 1995;89:748–756.
54. Lucas G. Approach to the multiple trauma patient (part I). Hosp Med. 1982; January.
55. Shoemaker WC, Montgomery ES, Kaplan E, et al. Physiologic patterns in surviving and nonsurviving shock patients. Arch Surg. 1973;106:630–636.
56. Chiara O, Pelosi P, Segala M, et al. Mesenteric and renal oxygen transport during hemorrhage and reperfusion: evaluation of optimal goals for resuscitation. J Trauma. 2001;51(2):356–362.
57. Yamauchi H, Biuk-Aghai EN, Yu M, et al. Circulating blood volume measurements in critically ill surgical patients correlate poorly with pulmonary artery catheter measurements. HMJ. 2007;66(12):318.
58. Takanishi DM, Yu M, Lurie D, et al. Peripheral blood hematocrit in critically ill surgical patients: an imprecise surrogate of true red cell volume. Anesth Analg. 2008;106:1808–1812.
59. James KB, Troughton RW, Feldschuh J, et al. Blood volume and brain natriuretic peptide in congestive heart failure: a pilot study. Am Heart J. 2005;150(5):984.