The Concept of TNM Oncoanatomy
• The oncoanatomy is the paradigm for the oncotaxonomy, that is, the anatomic extent of cancer spread is the basis for cancer classification and staging.
• The oncoanatomy refers to the normal tissue organization of a specific anatomic site that determines the clinical behavior of the cancer that originates there and its pattern of spread.
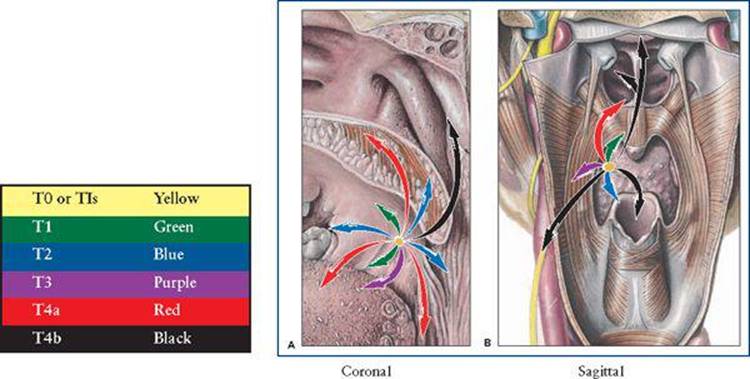
• The cancer crab invades the anatomic site of origin in six basic directions: superior-inferior, medial-lateral, anterior-posterior (SIMLAP). Although cancer can infiltrate in a myriad of directions, it usually follows the path of least resistance around these six vectors. The tumor infiltrates along fascial and muscle planes, invading fatty areolar spaces, and enters low pressure lymphatics and venous channels.
• The three-dimensional anatomic aspects and construct of a region is readily appreciated by utilizing the model of cancer spread patterns. That is, each manifestation of the cancer clinically is based upon a specific vector of tumor involvement, providing a geographic, anatomic-physiologic basis as its explanation.
• The most important decision in cancer treatment is the first decision once the neoplasm is definitely diagnosed as to its histopathologic type and grade.
• Knowing the anatomic extent of the cancer or its stage is most often the key determinant in achieving a successful outcome and selection of treatment.
• The oncoanatomy is presented as Regional Sections (7), which then are divided into Primary Cancer Sites (61). Then each regional section is presented first as an orientation diagram in an anterior and lateral projection, with surface anatomy landmarks and a radiographic osseous feature, the vertebral level.
• Each anatomic region is presented in 3D/3-planar sections; a coronal, a sagittal, and a transverse axial section of anatomy. There are seven anatomic regions, each with several primary cancer sites, which are ordered from cephalad to caudad.
• This “companion volume” to major multidisciplinary, multiauthored oncology textbooks is designed for the oncologist to have a visual illustrated reference to TNM staging to complement the associated verbal descriptive anatomy that begins each chapter in all editions of the AJCC and UICC (seventh edition).
• Each cancer site is introduced by a diagram of anatomic features identifiable on physical or radiographic examination.
• The derivative normal cellular and histologic features of each site provide a basis for the WHO histopathologic classification of cancers at each anatomic site.
• The patterns of cancer spread at the primary site (T), to regional nodes (N), and to a distant target organ of first metastases (M), often based on venous drainage, are concisely presented as the logic built into the TNM system of tumor progression.
• The 3D/3-planar oncoanatomy of the primary site and the regional nodes along with its venous drainage are presented in succession.
• The first-station lymph nodes (N) are shown for each primary site, with emphasis on the sentinel lymph node and tabulation of regional lymph nodes.
• Hematogenous spread via draining venous channels (M) will often determine the target metastatic organ.
• The clinical imaging criteria for staging with onco-imaging annotations are emphasized in the rules for TNM classification.
• The cancer survival results over the past 5 decades are presented as Surveillance Epidemiology and End Results (SEER) 5-year survival data (1950–2000).
• In reviewing the staging systems that have been designed, adopted, and modified over time, we have utilized the international anatomical terminology (Terminologia Anatomica) to improve the accuracy of reporting by oncologic disciplines to supplement the numbering of lymph node stations in a region.
Chapter Organization
The Design of Individual Cancer Site Chapters follows a similar page layout to minimize page turning.
• One topic is assigned to each set of facing pages: text on left page, figures on right page, tables on either side.
1. Histopathology of the dominant cancer is illustrated in microsections from Rubin's Pathology and is accompanied by WHO Histopathology Table. (Table 1 and Figure 1).
2. Pathology and Patterns of Cancer Spread is illustrated in two views of the anatomy (Figures 2A and 2B).
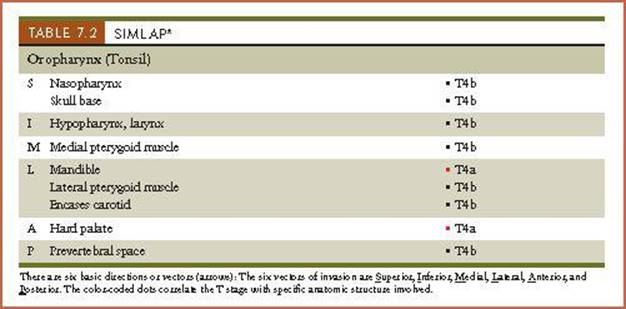
A. Coronal B. Sagittal, whenever possible. Six patterns of cancer spread are presented: Superior, Inferior, Medial, Lateral, Anterior, and Posterior. (SIMLAP Tables accompany Patterns of Spread figures; Table 2 and Figure 2).
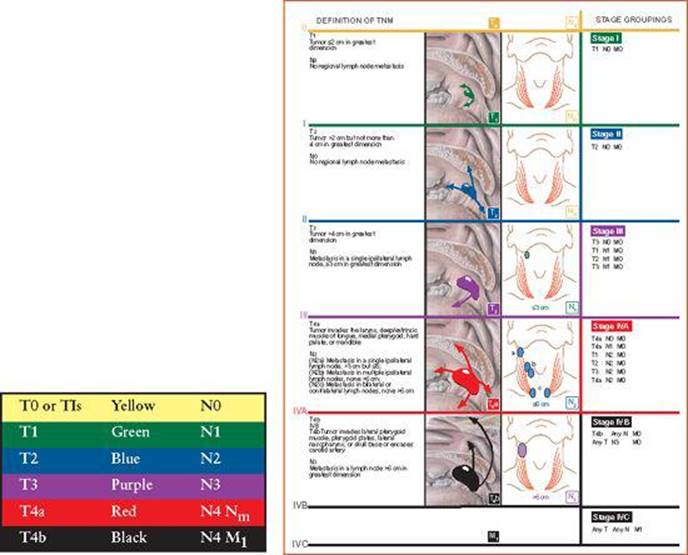
3. TNM Staging Criteria and Changes summarized according to the 7th Edition of American Joint Committee of Cancer/UICC Cancer Staging Manual (published in 2010). Two additional features are a Stage Summary Matrixand a concise overview summarizing 6th and 7th edition changes of each staging system.
• TNM Stage Groups are presented diagrammatically in five color-coded lanes with portrayal of T progression and N advancement. Definitions are on the left side and Stage Groups are on the right side. (Figure 3).
• TNM Stage Summary Matrix allows ease in identifying Stage Group once T and N stages are defined. (Table 3).
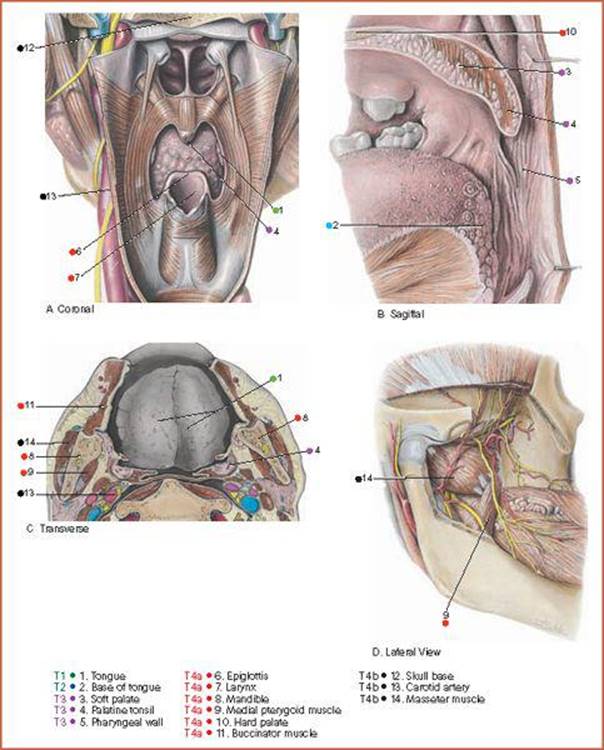
4. T-Oncoanatomy consists of phantom figures to orient the three-planar anatomy in coronal, sagittal, and axial sections at the anatomic isocenter of the cancer site (Nexus).
• T-Oncoanatomy is identified by coronal/sagittal crosshair diagrams based on trigeminal landmarks (Figure 4).
• T-Oncoanatomy is displayed in three dissection planes based mainly on Grant's Atlas of Anatomy. (Figure 5).
5. N-Oncoanatomy describes the sentinel lymph node and regional lymph nodes, which are tabulated and displayed in Table 4, and Figure 6. M-Oncoanatomy describes the venous drainage pattern and target metastatic organ.
• N and M-Oncoanatomy of lymph nodes and veins are illustrated based on Grant's Atlas of Anatomy (Figure 6A for N-Oncoanatomy, and Figure 6B for M-Oncoanatomy orientation).
• Incidence and Distribution of Lymph Node and Distant Metastases by Stage are tabulated and diagrammed when available in literature.
6. Rules and Staging Work-up emphasize imaging with CT/MRI/PET/US with “Oncoimaging Annotations” based on Oncologic Imaging by Bragg, Rubin, and Hricak, 2nd Edition, Elsevier, 2002, Table 5. A normal transverse axial CT/MRI is presented to allow correlation with axial anatomy section. (Table 5).
• CT and MR imaging in axial plane is offered as a correlate to T-oncoanatomy three planar (Figure 7).
• Prognostic Factors and Survival Statistics are summarized (Table 6) based on 7th Edition AJCC data in the form of bar graphs, by stage and five year survival rates. (Figure 8).
When the TNM oncoanatomy is the same, multiple histopathologies, each with its own staging system, are added as separate TNM staging figures. Examples are in Head and Neck: Ethmoid Sinus Cancer/Mucosal Melanoma, Thorax: Esophagus vs. Esophagogastric Junction, Abdomen: Stromal Cancer and Stromal Tumor, Liver and Intrahepatic Bile Ducts, Gynecologic: Fundus Cancer vs. Sarcomas, GAS: Basal/Squamous Cell Cancers vs. Merkel Cell Carcinoma, Eye: Choroid Melanomas.
In a similar fashion, multiple anatomic sites with identical anatomies are consolidated into one chapter: the Glottis and Subglottis in the Head and Neck, Liver and Intrahepatic Bile Ducts, Distal and Proximal Bile Ducts in the Abdomen, Penis and Urethra in the Male Genital Site, and the Ovary and Fallopian Tube in the Gynecologic site.
Special Features: Color Code
A unifying feature of this atlas is a color code that portrays the spectrum of cancer progression at primary sites (T) and lymph node regions (N), and of stage grouping. The head and neck oropharynx cancer site illustrates the color code.
• The unifying feature is the Color Code for Cancer Progression of primary tumors and lymph nodes. The Head and Neck Oropharynx cancer illustrates the design of figures.
• For the primary (T), color-coded arrows on the cancer crab spread patterns allow the reader to immediately appreciate cancer progression and advancement. Each arrow points to specific structures that advance the stage when invaded. Arrow color changes and length increases as stage advances.
• SIMLAP Tables act as legends for Figure 1 Patterns of Spread by identifying the anatomy invaded and its impact on stage. There are six vectors of cancer infiltrations: Superior, Inferior, Medical, Lateral, Anterior, and Posterior. The T stage advancement assigns the color-code dot next to specific structures provides the T stage if involved by cancer.
• For primary and regional nodes, the designation of nodal progression N1, N2, N3 is colored the same as T1, T2, and T3. Beyond, T4a,b and N3 refers to second station or echelon of nodes. We are suggesting MN for such regional lymph nodes, which are considered truly juxtaregional but not placed in M1. Such metatastatic juxtaregional nodes are quite distant and rarely curable.
• For TNM Stage Grouping (the third figure in each chapter), the color code remains the same. Horizontal color bars encompass T and N categories, which vary in each stage group. Variations in cancer staging, A and B, when applied to stages III and IV, in effect creates five or six stages. In such situations, color coding may vary but is designed to show progression of a more advanced stage.
• The vertical arrangement of TNM is to allow the reader to read across the page to check T and N.
• Definitions on left with pictorial display and stage groupings on right. When stage group is not shown in diagram, an asterisk alerts the reader and is annotated in the legend.
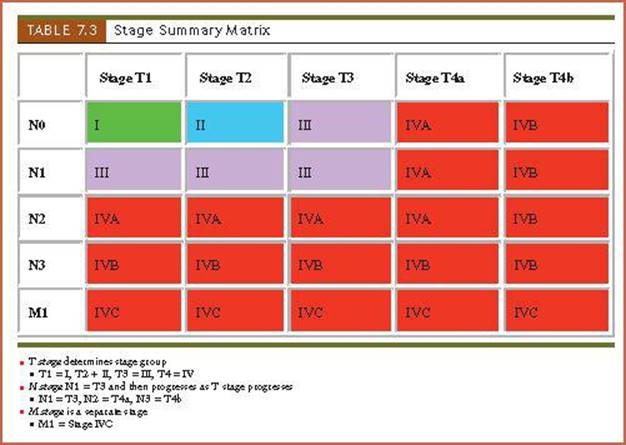
• Stage Summary Matrix figures are designed in color code as in Stage Groups for ease in determining exact stage group to complement Stage Group figures.
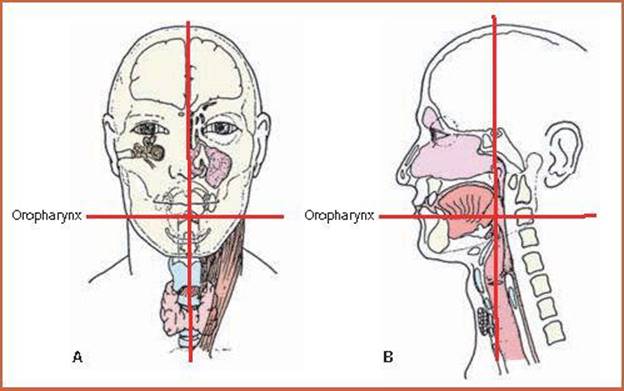
• Orientation of T-oncoanatomy: The crosshair diagrams provide landmarks for the anatomic isocenter, which is the nexus for three-planar anatomy. Trigeminal landmarks are readily identified in surface (ectoderm), skeletal (mesoderm), and visceral (endoderm).
• The anatomic isocenter is at the axial level, in this case, at level C3. Figure A shows the coronal view. Figure B shows the Sagittal view.
• T-Oncoanatomy legend of Three-Planar Views have been the anatomy leadlines and labels, also with color-code dots assigned to cancer progression by stage.
• Connecting the dots via color code allows for integrating the oncoanatomy into the TNM oncotaxonomy.
• *Three-planar anatomy has similar color code dots identifying specific structures invaded as cancer invasion progresses.
Concept of the Cancer Staging Process: Connecting the Dots
Oncoanatomy is the paradigm of TNM Oncotaxonomy. The clinical oncologist most often will rely on some form of cross-sectional imaging: CT/MRI/PET to determine anatomic extent of the cancer, its stage.
Thus, by “Connecting the Dots” in anatomy, it alerts the clinical oncologist what anatomy details he or she needs to discern for T staging.
• The Gross Tumor Volume (GTV) will be defined by size and details as to normal anatomy structures invaded by the cancer.
• The Gross Nodal Volume (GNV) is determined by sentinel and regional lymph node involvement and is defined by size, number, and geographic location of nodes in relation to primary site. Such aspects as mobility, matting, and ulceration are assessed on clinical examination.
• Connecting the Dots is a new feature in which the Patterns of Spread figures are color coded for cancer advancement in SIMLAP (Table 2).
• T-Oncoanatomy legends are color coded for cancer invasion stage. *Connecting the Dots assists and abets the Staging Process (Figure 5).