INTRODUCTION
Congenital heart disease (CHD) is the most common group of congenital anomalies, occurring in 0.3–0.6% of live births but with a higher prenatal incidence. Fetal cardiology and the echocardiographic assessment of the fetal heart have developed exponentially over the past 30 years, and are now an established part of CHD practice internationally. There are large reported series describing virtually all forms of CHD and this expertise has led to a high degree of diagnostic accuracy, particularly in specialist centers. Technical advances mean the fetal heart can be examined transabdominally or transvaginally as early as the 1st trimester, particularly in fetuses at higher risk of developing CHD. Image acquisition by standard modalities such as 2D echocardiography, M-mode, pulsed-wave Doppler imaging and color flow Doppler mapping have become a routine part of fetal cardiac assessment. The advent of newer imaging modalities in the form of 3D echocardiography, tissue Doppler, and speckle tracking (myocardial deformation assessment) show promise in providing even greater insight into the structure and function of the fetal heart. With the improvements in the ability to diagnose congenital heart defects during fetal life, new challenges have emerged. These include risk stratification within diagnostic categories, fetal intervention, and optimization of postnatal management.
INDICATIONS FOR FETAL ECHOCARDIOGRAPHY
Traditionally, pregnancies have been classified as “low-risk” or “high-risk” based on whether there are specific fetal or historic risk factors for congenital heart disease. For “low-risk” pregnancies, ultrasound imaging of the fetal heart is typically incorporated into obstetric anomaly scans in the second trimester, which include views of the fetal heart. A variety of standards for imaging of the fetal heart have been published by different obstetric and cardiac professional bodies. Views of the heart which are common to all recommendations include the cardiac situs, four-chamber view, aortic valve/left ventricular outflow tract and pulmonary valve/right ventricular outflow tract, and/or three-vessel view. In pregnancies which are classified as “high risk,” the risk of congenital heart disease is elevated to a degree in which detailed fetal echocardiography is warranted. Detailed fetal echocardiography involves a comprehensive evaluation of the cardiac connections and cardiac function for which reference standards have been published. In specialist centers, detailed fetal echocardiography has a very high level of diagnostic accuracy for congenital heart defects. Reassurance of normality is also an important facet of evaluation of high-risk pregnancies. Some of the major indications for detailed fetal echocardiography are shown in Table 32.1.
First trimester assessment is used to identify fetuses at high risk of CHD of which measurement of nuchal translucency (NT) thickness is an essential component. The addition of ductus venosus flow patterns, particularly “a” wave reversal, and the presence of tricuspid valve regurgitation, has further refined this screening. NT screening was introduced to identify fetuses at increased risk for chromosomal abnormalities; however, there is a clear link with congenital heart disease. The relationship between NT and CHD is independent of the fetal karyotype, and the risk of CHD increases with the value of NT. There has been some debate as to the threshold NT which should warrant detailed fetal echocardiography. Most commonly either the 95th (2.6–3.2mm) or 99th percentiles (3.5mm) are used as “cutoff” values. Large series have suggested that NT screening may identify up to 30% of fetuses with CHD.
Newer, noninvasive screening techniques for trisomy 21, 13, and 18 are now available in the form of maternal blood cell–free (cf) DNA. This test does not exclude rarer chromosomal abnormalities or congenital heart defects. Current guidelines advise that it should be an adjunct to routine screening blood tests, and ultrasound scans.
TIMING OF FETAL ECHOCARDIOGRAPHY
Detailed images of the fetal heart can be obtained by transabdominal or transvaginal echocardiography as early as the 1st trimester and is particularly indicated in selected cases, for example, a previous child with severe cardiac disease, increased NT, or another structural fetal abnormality. This can provide early diagnosis or reassurance well in advance of the standard midtrimester anomaly scans. Most fetal cardiologists would recommend follow-up scanning even if an early scan, undertaken between 13 and 17 weeks, proves normal. The midtrimester period between 18 and 22 weeks gestation remains the optimal time period for fetal echocardiography and in many cases only a single scan will be required. Images obtained in the third trimester may not be as clear as second trimester images due to a reduction in available acoustic windows.

SYSTEMATIC APPROACH
For the purposes of screening many groups have advocated assessment of the fetal heart by a series of transverse or near transverse projections across the fetal thorax. A structured and systematic approach should be undertaken to ensure all aspects of the cardiac anatomy are examined (Table 32.2).
Fetal Position
Orientation of Fetal Position and Cardiac Situs
Before embarking on ultrasound assessment of the fetal heart it is essential to delineate the fetal position in the maternal abdomen (e.g., breech, cephalic, transverse) and the position of the fetal spine. This orientates the scan and establishes the anterior, posterior, left, and right of the fetus. This permits the operator to ensure that the heart and stomach are both on the left, and the position of the descending aorta and inferior vena cava to the left or right can be established with certainty. Normal abdominal situs is shown in Figure 32.1 (Video 32.1, Table 32.3). Normal cardiac situs (situs solitus) is determined by scanning in a plane immediately below the fetal heart and delineating the relationship of the descending aorta and inferior vena cava to each other and in relation to the fetal spine. In normal cardiac situs the abdominal aorta lies anterior and to the left of the spine. The inferior vena cava (IVC) lies anterior and to the right of the abdominal aorta and can be traced toward the morphological right atrium (RA). The fetal stomach should be seen on the left.
Four-Chamber View
The heart normally lies in the left of the chest, with the apex pointing to the left, at an angle of around 40°, filling one-third of the fetal thorax. In an optimal cross section, only a single rib should be visualized around the fetal thorax. It is essential to confirm the correct cut of the fetal thorax as “off-axis” images can be misleading or falsely reassuring. The stomach should be visualized to the left immediately below the heart. It is important to use the aforementioned method of orientation, as in certain situations the stomach and cardiac apex may lie on opposite sides or both may lie on the right of the fetus.
From the situs view, sweeping the probe cranially allows visualization of the four-chamber view of the heart. The normal four-chamber view of the fetal heart is shown in Figure 32.2 (Video 32.2, Table 32.4). This view allows assessment of the pulmonary venous drainage, atrioventricular (AV) connections, and the relative sizes of the atria and ventricles. The left ventricle (LV) is a smooth-walled chamber lying posteriorly. In comparison, the right ventricle (RV) is more trabeculated with a visible moderator band. Both ventricles should appear of similar size in a normal four-chamber view. The AV valves insert into the septum to produce the crux of the heart. The tricuspid valve inserts into the septum more apically and the mitral valve more toward the base, which is known as “differential insertion” (DI) or “AV valve offset.” This subtle anatomic feature is an essential component of the cardiac assessment. The offset is reversed where there are discordant atrioventricular connections, and loss of offsetting is a feature of atrioventricular septal (canal) defects (AVSD). A left superior vena cava (SVC) draining to a dilated coronary sinus can also make interpretation of offsetting more difficult. Color flow Doppler is used to assess flow patterns across the atrioventricular valves and to detect AV valve regurgitation. Color flow Doppler should also be used to interrogate the ventricular septum to identify ventricular septal defects which may not be seen on 2D imaging.


Figure 32.1. Transverse section through the fetal thorax demonstrating normal cardiac situs. The spine is seen posteriorly, with the stomach on the left. The descending aorta (DAo) lies anteriorly and to the left of the spine. The inferior vena cava (IVC) anterior and to the right of the DAo.
The mitral and tricuspid valves should be seen to open freely on 2D imaging and the addition of color flow Doppler will ascertain forward flow and the presence of any AV valve regurgitation. Trivial tricuspid valve regurgitation can be an incidental finding in the presence of otherwise normal cardiac anatomy and normal karyotype. The AV valve inflow pattern (diastolic filling) is assessed by placing the PW Doppler at the AV valve tips (Fig. 32.3). The fetus shows reversal of the E/A ratio and with advancing gestational age the E wave velocity increases so that there is also a gestation-related increase in the E/A ratio.
The connection of the pulmonary veins to the left atrium can be demonstrated on 2D imaging, but the addition of color flow Doppler assists in the confirmation that the veins drain directly into the left atrial mass. The velocity of blood flow through the pulmonary veins is lower than other cardiac structures and the color scale should be altered accordingly (Fig. 32.4, Video 32.3). In fetal life the foramen ovale is patent and can often appear aneurysmal. The flap valve of the foramen ovale is seen bowing into the left atrium, consistent with right-to-left shunting of blood at the atrial level, which can be confirmed by color flow Doppler. Some cardiac abnormalities are characterized by an abnormal four-chamber view of the heart. Examples include hypoplastic left heart (Fig. 32.5A, Video 32.4A(1–3)), tricuspid atresia (Fig. 32.5B, Video 32.4B), atrioventricular septal defect (Fig. 32.5C, Video 32.4C(1–2)) and discordance of the atrioventricular connections (Fig. 32.5D, Video 32.4D(1–2)). The abnormal features are outlined in the figure legend.
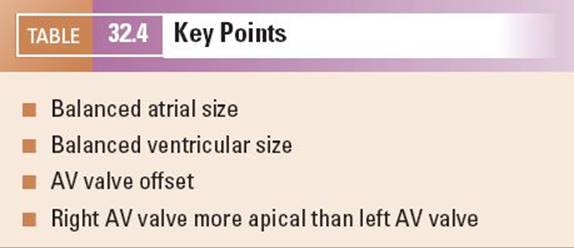

Figure 32.2. A: Transverse section through the fetal thorax demonstrating the four-chamber view. The left and right atria (LA, RA) and left and right ventricle (LV, RV) with corresponding mitral and tricuspid valves (MV, TV). B: Alternate four-chamber view demonstrating the AV valve offsetting.

Figure 32.3. A: E and A wave of the mitral inflow B: E and A wave of the tricuspid inflow. During fetal life the E wave velocity is less than the A wave. The E/A ratio increases with advancing gestational age.

Echocardiographic Imaging of the Great Arteries
Remaining in the horizontal section and sweeping the probe cranially from the four-chamber view, the ventricular-arterial (VA) connections are visualized. The first outflow tract which is seen on sweeping cranially is the aorta and the second great artery is the pulmonary artery. The great arteries have a markedly different orientation within the fetal thorax. The left ventricular outflow tract (LVOT) and aortic valve arise from the center of the heart with the ventricular septum in continuity with the anterior wall of the aorta and the anterior leaflet of the mitral valve in continuity with the posterior wall of the aorta (Fig. 32.6A, Video 32.5). They course cranially toward the right shoulder before curving posteriorly and leftwards to form the transverse aortic arch. Color flow Doppler and pulsed-wave Doppler are used to assess both the direction and velocity of blood flow through the aortic valve (Figs. 32.6B and 32.7A; see Video 32.5). It is useful when assessing the Doppler velocity to also assess the fetal heart rate by measuring the time interval between each systolic contraction (Fig. 32.7B).

Figure 32.4. A: The right and left pulmonary veins (R, L Pul. veins) are seen to be confluent with the left atrium (LA). B: Antegrade blood flow demonstrated from the pulmonary veins into the LA. C: Normal pulmonary vein Doppler, with S, D, and A wave patterns.

Figure 32.5. A: Hypoplastic left heart (HLH). The mitral valve is atretic with no discernible left ventricle. B: Tricuspid atresia (TAT) with a small right ventricle (RV) and ventricular septal defect. C: Atrioventricular septal defect (AVSD) with a common AV valve and associated ventricular and atrial septal defects. Note that there is no differential insertion of the atrioventricular valves and no visible “primum” atrial septum. D: Discordant atrioventricular connection. There is reversal of the normal pattern of offsetting of the atrioventricular valves. The left atrium connects to the morphologic right ventricle through the tricuspid valve which is more apically inserted than the mitral valve. The morphologic right ventricle is posterior to the morphologic left ventricle. The right atrium connects to the morphologic left ventricle via the mitral valve and the left ventricle is anterior.
Continuing to sweep cranially from the LVOT view allows assessment of the right ventricular outflow tract (RVOT) and pulmonary valve. The RVOT, pulmonary valve, and main pulmonary artery (MPA) arise anteriorly from the right ventricular mass and course straight back toward the spine, crossing anterior to the LVOT. (Fig. 32.8A, Video 32.6). It is important to note that in the normal heart the great arteries cannot be seen in the same plane and do not arise in parallel. This would raise the suspicion of transposition of the great arteries. As with the aortic valve, the addition of color flow Doppler will delineate direction of flow through the pulmonary valve and the velocity of blood flow measured with PW Doppler (Fig. 32.8B). Gestationally appropriate normative values are available for both aortic and pulmonary valve Doppler velocities. Sweeping cranially, the arterial duct is a continuation of the MPA into the descending aorta and is seen to travel directly back toward the left of the spine, dividing proximally into the left and right branch pulmonary arteries (PA) (Fig. 32.9, Video 32.7). In this projection, both PAs are not usually seen in the same plane as the arterial duct. More commonly, the duct and the right PA are seen together at a 45° angle and the left PA may be visualized in a longitudinal projection.
If the plane of insonation continues cranially in a near transverse plane cut through the superior mediastinum it will delineate the relationship, from left to right, of the MPA, aorta, and SVC. This is termed the three-vessel view (3VV). The relative sizes of the vessels seen in this projection is normally MPA > aorta > SVC, but the differences in size are usually quite small (Fig. 32.10A). This 3VV will also identify a left SVC or bilateral SVCs, which can be associated with other structural cardiac or extracardiac abnormalities, but may also be a variant of normal (Fig. 32.10B, Video 32.8, Tables 32.5 and 32.6).

Figure 32.6. A: The left ventricular outflow tract (LVOT) is seen arising from the left ventricle (LV), with the aortic valve (AoV) in continuity with the mitral valve. B: Color flow Doppler demonstrates antegrade flow through the LVOT and aortic valve.
In a slightly more superior plane, the arterial duct and transverse aortic arch are seen to course back toward the left of the spine and meet in a “V” shape to become the descending aorta. The trachea lies to the right of the “V”—this view is termed the three-vessel tracheal view (Fig. 32.11, Video 32.9). In a right-sided aortic arch the transverse arch courses to the right of the trachea, and if the duct is left-sided these structures meet in a “U” shape with the trachea lying between the aorta and arterial duct. (Fig. 32.12, Video 32.10, Table 32.7) A double aortic arch or aberrant subclavian arteries may also be identified in this view.

Figure 32.7. A: Pulsed-wave Doppler through the aortic valve, maximum velocity (V Max) B: The fetal heart rate is assessed by measuring the time interval between each systolic contraction.
The most distal aspect of the transverse arch as it meets the arterial duct is termed the aortic isthmus and it is in this area that coarctation of the aorta may develop postnatally. Assessing the diameter of the transverse aortic arch, measuring the aortic isthmus in the 3VV tracheal view and longitudinal view, and comparing them to normative values for gestation may aid diagnostic accuracy. Additional assessment with color flow Doppler will confirm antegrade blood flow in both the ductal and aortic arch. Reversal of flow in the aortic arch or ductal arch is suggestive of significant left or right heart obstruction, respectively. Some characteristic abnormalities of the outflow tracts, including transposition of the great arteries, tetralogy of Fallot, and common arterial trunk, are illustrated in Figure 32.13. (Video 32.11).

Figure 32.8. A: The main pulmonary artery (MPA) from right ventricle (RV) divides into the left branch pulmonary artery (LPA). Aorta (Ao) to the right of the MPA. B: Pulsed-wave Doppler through the pulmonary valve, maximum velocity (V Max).

Figure 32.9. A: The main pulmonary artery (MPA) is seen to continue toward the left of the spine as the arterial duct, joining the descending aorta (Desc Ao). The MPA is seen to divide proximally into the right pulmonary artery (RPA). The aorta and superior vena cava (SVC) lie to the right of the MPA, respectively. B: Antegrade flow through the MPA and arterial duct, visualized on color flow Doppler. C: The main pulmonary artery (MPA) is seen to divide into the right and left pulmonary arteries (RPA, LPA), with the aorta lying to the right.

Figure 32.10. A: 3VV from right to left, superior vena cava (SVC), aorta (Ao), and main pulmonary artery (MPA) are of equal size. B: Bilateral superior vena cava, to the right of the aorta lies the right SVC and to the left of the MPA, the left SVC.

Longitudinal Views
Examining the fetal heart in the longitudinal plane can provide additional information to an experienced scanner and is more easily viewed when the fetal spine lies at the top or the bottom of the imaging screen.
The distinct course of both venae cavae is visualized by rotating the probe 90° into the longitudinal view. The SVC descends from the head, entering the roof of the right atrium, and the inferior vena cava (IVC) is seen to traverse through the upper abdomen, before passing through the diaphragm and entering the floor of the right atrium (Fig. 32.14, Video 32.12A). This is termed the bicaval view, and sometimes can be described as a set of “bull horns.”
Disorders of laterality should be suspected if there is interruption of the connection between the IVC and right atrium. In this situation, azygous continuation of the IVC should be sought. This can be identified in the longitudinal plane as a vessel running parallel and posterior to the descending aorta. The addition of color flow will demonstrate blood flowing cranially, in the opposite direction to the descending aorta (Video 32.12B). Dilation of either vena cava should also alert the scanner of a distal structural abnormality; for example, dilated IVC—agenesis of the ductus venosus with direct communication of the umbilical vein to the systemic veins [44]; dilated SVC—supracardiac total anomalous pulmonary venous drainage (TAPVD) or vein of Galen malformation.

The transverse aortic arch and transverse ductal arch are viewed in the longitudinal projection. The aortic arch lies superior to the ductal arch, arching cranially with a “candy cane” curve (Fig. 32.15). The head and neck vessels can also be visualized arising from the transverse arch. The ductal arch lies more inferior and courses directly back toward the spine in a “hockey stick” curve (Fig. 32.16). Similar to the transverse views, the great arches will not be seen together in the longitudinal projection, as parallel great arches suggest transposition of the great arteries.

Figure 32.11. A: The left-sided aortic arch (L Ao Arch) traverses to the left of the trachea (Tr), joining a left-sided arterial duct (L duct) at the aortic isthmus, forming a “V” shape. B: Color flow Doppler demonstrates antegrade flow in both arches.
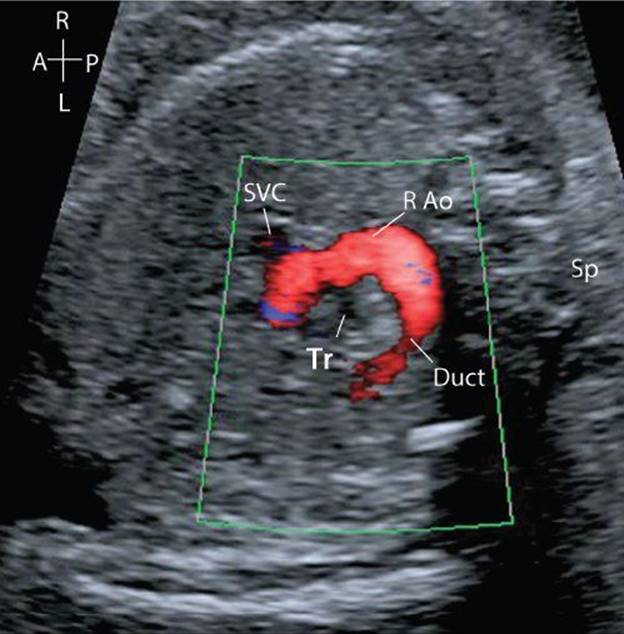
Figure 32.12. Color flow Doppler demonstrating antegrade flow in the aortic arch as it passes to the right of the trachea. It joins a left-sided arterial duct to form the characteristic “U” shape.
Rotating the probe 90° from a normal four-chamber view allows assessment of the AV valves in short-axis, similar to a postnatal short-axis view. This allows identification of two separate AV valve orifices and a mitral valve with two papillary muscles.


Figure 32.13. A: Transposition of the great arteries: the great arteries arise in parallel from the ventricular mass. B: Tetralogy of Fallot: The aorta arises astride a ventricular septal defect. C: A common arterial trunk (truncus arteriosus): A single great artery arises from the heart, which gives rise to both the aortic arch and branch pulmonary arteries. In this image a branch pulmonary artery is seen to arise distal to the dysplastic truncal valve.
DETECTION RATES OF FETAL CARDIAC ABNORMALITIES
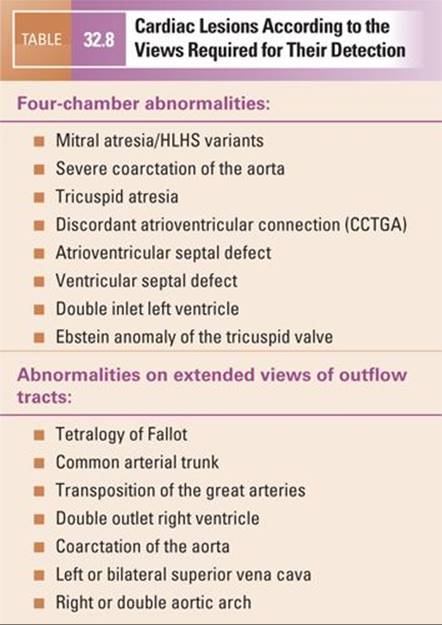
The detection rates for different cardiac abnormalities vary widely according to the different types of cardiac lesion. Some cardiac lesions can be detected because the four-chamber view of the heart is abnormal. These cardiac lesions tend to have better detection rates during screening examinations than those lesions which are compatible with a normal four-chamber view and whose detection depends on assessment of the great arteries. These lesions are summarized in Table 32.8. There are, however, some cardiac lesions which pose major challenges for their accurate diagnosis even in very experienced hands. Furthermore, disease progression during fetal life can mean that a lesion is not readily apparent during the midtrimester but becomes progressively more severe with advancing gestational age. Prominent examples include coarctation of the aorta, total anomalous pulmonary venous drainage (TAPVD), and stenosis of the aortic or pulmonary valve. Coarctation of the aorta can be suspected prenatally if there is ventricular or great artery asymmetry with dominance of the right- compared to left-sided structures. However, ductal patency during fetal life makes it very difficult to categorically confirm or refute the diagnosis prenatally and false positive and negative diagnoses may occur. Isolated TAPVD can be difficult to diagnose, as the four-chamber view may be balanced and a confluence behind the heart may not be easily visualized due to relatively low pulmonary artery flow during prenatal life. Stenosis of the pulmonary and aortic valves has the potential to progress in severity with advancing gestation. Thus, in the midtrimester, there may be few, if any, signs of an abnormality even when color and pulsed-wave Doppler interrogation of the outflow tracts are employed.
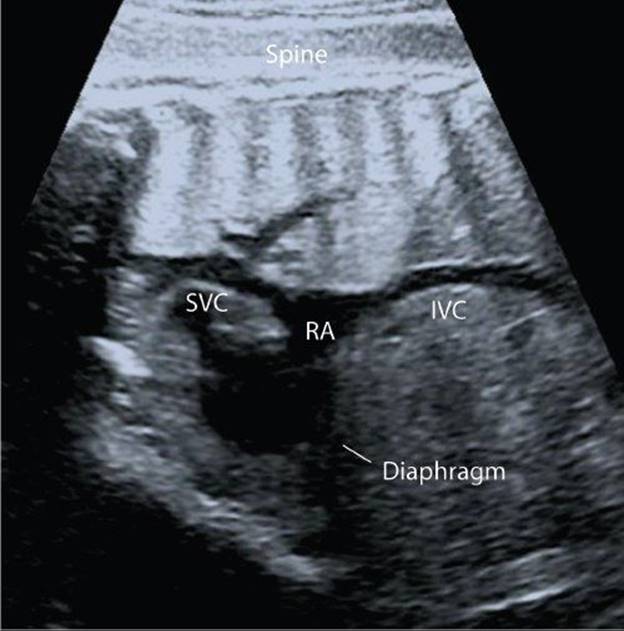
Figure 32.14. The superior and inferior venae cavae (SVC, IVC) enter the roof and floor of the right atrium (RA) to form the bicaval view.
MEASUREMENTS OF THE FETAL HEART
In many clinical settings measurements are made of the fetal heart structures to determine whether there is deviation from normality. For example, asymmetry between left and right heart structures may be seen in fetuses who prove to have coarctation of the aorta. Some of the more common measurements include left and right ventricular end systolic and diastolic dimensions, mitral and tricuspid annulus diameter, and left and right ventricular length. With respect to the great arteries, the aortic valve, pulmonary valve, and relative diameters of the aortic isthmus and ductus are often made in normal clinical practice. Examples of these measurements are illustrated in Figures 32.17, 32.18, 32.19, and 32.20.

Figure 32.15. A: Longitudinal view of the aortic arch. Ascending aorta (AscAo) continuing as the transverse arch in a “candy cane” shape. Aorta gives rise to the head and neck vessels and continues as the descending aorta (DAo), anterior to the spine. B: Antegrade flow in the aortic arch as demonstrated on color flow Doppler.

Figure 32.16. A: Longitudinal view of the “hockey stick” ductal arch continuing as the descending aorta (DescAo) B: Antegrade flow in the ductal arch demonstrated on color flow Doppler.
Given that the fetus is rapidly growing, measurements have to be related to fetal size. Z-scores are a means of relating a fetal measurement to a size or gestationally specific mean value and reflect how far above or below a population mean an individual measurement lies. Reference ranges are available for fetal cardiac structures as well as online tools for computing z-scores. The echocardiographic method should remain consistent with that employed to construct the reference data to ensure valid comparison. Ideally, the same operator should analyse sequential scans to minimise operator error.
FETAL CARDIAC FUNCTION
Quantitative assessment of fetal cardiac function is challenging. There are a variety of techniques which can be used to assess fetal cardiac function ranging from those which are purely subjective to those which are quantitative but which involve more extensive postprocessing. Normal data have been published for cardiothoracic ratio, Doppler inflow, and outflow patterns, myocardial performance index (MPI), tissue Doppler, 2D strain, and 3D estimation of ventricular volumes. In order to integrate these individual techniques, scoring systems have been devised, such as the fetal cardiovascular profile score. Each echocardiographic technique has specific advantages and limitations which are summarized in Table 32.9.
The aspect of ventricular function which is assessed depends on the technique. For example, M-mode determines the ventricular ejection fraction and therefore is a marker of ventricular systolic function. In contrast, MPI is defined as the sum of the isovolumetric relaxation time (IRT) and the isovolumetric contraction time (ICT), divided by the ejection time (ET). Importantly, MPI is a marker of time, and its measurement is not dependent on ventricular geometry.

Figure 32.17. Measurements in the four-chamber view during ventricular diastole.
FETAL ARRHYTHMIAS
In postnatal practice, the electrocardiogram (ECG) is the gold standard for assessment of arrhythmias. Obtaining a fetal ECG is technically demanding, involving either magnetocardiography or more complex signal processing to extract the fetal from maternal ECG. Thus, echocardiography remains the dominant technique for assessing arrhythmias in the fetus, with electrical events inferred from mechanical assessment. M-mode echocardiography can be employed for the assessment of fetal arrhythmias by aligning the cursor through the atrial wall and the ventricular wall, thus permitting simultaneous display of ventricular and atrial contractions (Fig. 32.21A). The M-mode technique can be used to confirm normal sinus rhythm, tachycardias, and bradycardias such as complete heart block. Fetal arrhythmias can broadly be classified into irregular fetal rhythms, tachycardias, and bradycardias. Irregular fetal heart rhythms are most commonly due to atrial extrasystoles, although ventricular extrasystoles may also occur. Fetal tachycardias are most commonly due to supraventricular tachycardia (the majority), atrial flutter, chaotic atrial rhythms, and, rarely, ventricular tachycardia. M-mode echocardiography can be used to display the atrial and ventricular rates of contraction but the technique can be limited by the adequacy of acoustic windows. Doppler techniques are also appropriate in the assessment of fetal tachycardias, particularly supraventricular tachycardia, where measurement of atrioventricular (AV) and ventriculoarterial (VA) time intervals can be used to differentiate between short VA tachycardias due to accessory conduction pathways and long VA tachycardias which make a diagnosis of permanent junctional reciprocating tachycardia more likely. This differentiation has implications for fetal therapy. Alternative techniques such as tissue Doppler imaging have also been used because the atrial and ventricular contraction patterns can be interrogated separately during postprocessing. Fetal bradycardia can be due to sinus bradycardia, multiple blocked atrial ectopic beats, or complete atrioventricular block. Heart block is most commonly due to transplacental transfer of anti-Ro and/or anti-La antibodies but may also be due to underlying structural disease, notably isomerism of the left atrial appendages or discordant atrioventricular connections. M-mode echocardiography is probably the most commonly used technique to interrogate atrial and ventricular contraction patterns to identify atrioventricular dissociation, atrial ectopic beats, or sinus bradycardia. Echocardiographic techniques cannot be used to measure time intervals such as the QT interval, which depends on magnetocardiography for its measurement.
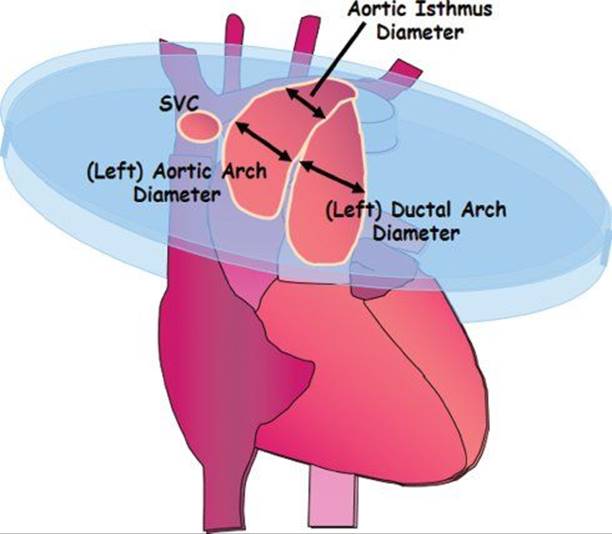
Figure 32.18. Measuring the aortic valve in ventricular diastole.

Figure 32.19. Measuring the left aortic arch and left arterial duct in the 3VV.
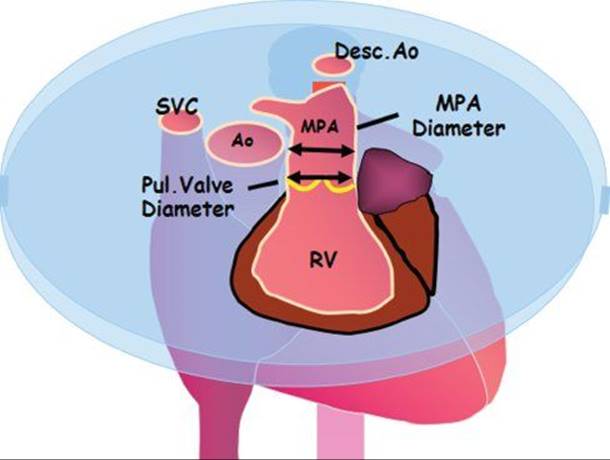
Figure 32.20. Measuring the pulmonary valve and MPA in ventricular diastole.

Recently, attention has focused on the measurement of the mechanical PR interval by Doppler techniques, including pulsed Doppler and tissue Doppler, in fetuses at increased risk of developing heart block because of maternal anti-Ro or and anti-La antibodies. The time (m/s) between atrial and ventricular systole is known as the atrioventricular contraction time interval (AVCTI) and is a mechanical representation of the PR interval (Fig. 32.21B). AVCTI can be obtained by placing the PW cursor simultaneously across an inflow and outflow tract, for example, LVOT and mitral valve, pulmonary vein and RPA, or ascending aorta and SVC. The role of these measurements in preventing progression to heart block remains controversial.
MANAGEMENT FOLLOWING A PRENATAL DIAGNOSIS OF CHD
Comprehensive echocardiographic information is essential to be able to reach a full and accurate diagnosis of the cardiac lesion. This permits explanation to affected parents about the nature and prognosis of the cardiac lesion. Prenatal management includes a wider assessment of the fetus than simply identification of the cardiac lesion. Some cardiac lesions, for example, AVSDs, have a strong association with chromosomal abnormalities and other extracardiac abnormalities which may impact the fetal prognosis. The full extent of potential associated abnormalities should be investigated, which may involve other subspecialties including fetal medicine, obstetrics, and clinical genetics. Cardiac lesions vary in the strength of association with other anomalies. Simple transposition of the great arteries is seldom associated with extracardiac abnormalities, whereas tetralogy of Fallot is frequently associated. Prenatal identification of karyotypic abnormalities by chorionic villus sampling (CVS) or amniocentesis should be considered and discussed with parents where appropriate. Depending on the nature of the cardiac lesion, delivery may need to be planned at or near to a high level cardiac unit to optimize care and postnatal outcome.

Figure 32.21. A: M-mode: the cursor is placed through the atrial (A) and ventricular (V) myocardium demonstrating 1:1 AV conduction. B: Atrioventricular contraction time interval (AVCTI), mechanically represents the PR interval.
IMPACT ON OUTCOME
Prenatal diagnosis allows for planned delivery in dedicated congenital cardiac units, with immediate access to obstetricians, neonatologists, and pediatric intensivists experienced in treating babies with congenital heart disease.
Antenatal detection of duct-dependent conditions such as transposition of the great arteries, hypoplastic left heart syndrome, coarctation of the aorta, and pulmonary atresia is associated with a reduction in postnatal morbidity and mortality. In these duct-dependent lesions, prostaglandin E infusion is initiated promptly in the NICU, allowing time for detailed cardiac assessment and postnatal echocardiography.
In the majority of prenatal cardiac diagnoses a vaginal delivery is possible. In select cases which may require immediate postnatal cardiac intervention, for example, TGA or HLHS with intact or restrictive atrial septum, a cesarean section (CS) will be required. Similarly, in cardiac conditions associated with complete heart block or tachycardia, CS is required due to an inability to adequately monitor fetal wellbeing during labor.
FETAL INTERVENTION
Prenatal intervention for fetal congenital heart disease has advanced significantly over the past decade. Intervention has been undertaken for cardiac lesions which progressively deteriorate during gestation with the aim of halting or reversing such deterioration. The dominant lesion for which it has been performed is critical aortic stenosis because in this condition the size and function of the left ventricle and other left heart structures are known to deteriorate with time. The growth of heart structures has been shown to be better following intervention but this has not directly translated into a uniformly positive postnatal outcome with a biventricular circulation. Debate has centered on whether the risks of the procedure outweigh the potential benefits. Other lesions for which intervention has been undertaken include pulmonary atresia with intact ventricular septum (in cases with incipient hydrops) and hypoplastic left heart with severely restrictive or intact atrial septum where the postnatal prognosis is extremely guarded. Fetal intervention remains a controversial area of research, involving techniques such as balloon valvuloplasty for critical aortic or pulmonary stenosis and stenting of a restrictive atrial septum.The ability to intervene in the appropriate subset of patients, at the optimal time, with minimal complications and maximal benefit is the eventual goal. Work is continuing to ultimately improve the long-term outcome and prognosis of fetuses with these conditions.
SUGGESTED READING
Allan L, et al. Recommendations for the practice of fetal cardiology in Europe. Cardiol Young. 2004;14(1):109–114.
Berg C, et al. Prenatal diagnosis of persistent left superior vena cava and its associated congenital anomalies. Ultrasound Obstet Gynecol. 2006;27(3):274–280.
Bull C. Current and potential impact of fetal diagnosis on prevalence and spectrum of serious congenital heart disease at term in the UK. British Paediatric Cardiac Association. Lancet. 1999;354(9186):1242.
Carvalho JS, et al. ISUOG practice guidelines (updated): sonographic screening examination of the fetal heart. Ultrasound Obstet Gynecol. 2013;41(3):348–359.
Chan LY, et al. Reference charts of gestation-specific tissue Doppler imaging indices of systolic and diastolic functions in the normal fetal heart. Am Heart J. 2005;150(4):750–755.
Comas M, Crispi F. Assessment of fetal cardiac function using tissue Doppler techniques. Fetal Diagn Ther. 2012;32(1–2):30–38.
Eidem B, Edwards J, Cetta F. Quantitative assessment of fetal ventricular function: establishing normal values of the myocardial performance index in the fetus. Echocardiography. 2001;18(1):9–13.
Fetal Echocardiography Task Force, et al. AIUM practice guideline for the performance of fetal echocardiography. J Ultrasound Med. 2011Jan;30(1):127–136.
Fouron JC. Fetal arrhythmias: the Saint-Justine hospital experience. Prenat Diagn. 2004;24(13):1068–1080.
Franklin O, et al. Prenatal diagnosis of coarctation of the aorta improves survival and reduces morbidity. Heart. 2002;87(1):67–69.
Germanakis I, Matsui H, Gardiner HM. Myocardial strain abnormalities in fetal congenital heart disease assessed by speckle tracking echocardiography. Fetal Diagn Ther. 2012;32(1–2):123–130.
Ghi T, et al. Incidence of major structural cardiac defects associated with increased nuchal translucency but normal karyotype. Ultrasound Obstet Gynecol. 2001;18(6):610–614.
Gil M, et al. Implementation of maternal blood cell-free DNA testing in early screening for aneuploidies. Ultrasound Obstet Gynecol. 2013;42(1):34–40.
Godfrey M, et al. Functional assessment of the fetal heart: a review. Ultrasound Obstet Gynecol. 2012;39(2):131–144.
Hornberger LK, et al. Antenatal diagnosis of coarctation of the aorta—a multicenter experience. J Am Coll Cardiol. 1994;23(2):417–423.
Jaeggi ET, et al. Prolongation of the atrioventricular conduction in fetuses exposed to maternal anti-Ro/SSA and anti-La/SSB antibodies did not predict progressive heart block. A prospective observational study on the effects of maternal antibodies on 165 fetuses. J Am Coll Cardiol. 2011;57(13):1487–1492.
Jowett VC, et al. Foetal congenital heart disease: obstetric management and time to first cardiac intervention in babies delivered at a tertiary centre. Cardiol Young. 2014 Jun;24(3):494–502.
Lee W, et al. Fetal echocardiography: z-score reference ranges for a large patient population. Ultrasound Obstet Gynecol. 2010;35(1):28–34.
Makrydimas G, et al. Nuchal translucency and fetal cardiac defects: a pooled analysis of major fetal echocardiography centers. Am J Obstet Gynecol. 2005;192(1):89–95.
McElhinney D, Tworetzky W, Lock J. Current status of fetal cardiac intervention. Circulation. 2010;121(10):1256–1263.
Nii M, et al. Assessment of fetal atrioventricular time intervals by tissue Doppler and pulse Doppler echocardiography: normal values and correlation with fetal electrocardiography. Heart. 2006;92(12):1831–1837.
Pasquini L, et al. Z-scores of the fetal aortic isthmus and duct: an aid to assessing arch hypoplasia. Ultrasound Obstet Gynecol. 2007;29(6):628–633.
Rychik J, et al. American Society of Echocardiography guidelines and standards for performance of the fetal echocardiogram. J Am Soc Echocardiogr. 2004;17(7):803–810.
Seale AN, et al. Total anomalous pulmonary venous connection: impact of prenatal diagnosis. Ultrasound Obstet Gynecol. 2012;40(3):310–318.
Sharland G. Fetal cardiac screening: why bother? Arch Dis Child Fetal Neonatal Ed. 2010;95(1):8.
Simpson, J. Echocardiographic evaluation of cardiac function in the fetus. Prenat Diagn. 2004;24(13):1081–1091.
Simpson JM. Fetal arrhythmias. Ultrasound Obstet Gynecol. 2006;27(6):599–606.
Strasburger JF, Cheulkar B, Wakai RT. Magnetocardiography for fetal arrhythmias. Heart Rhythm. 2008;5(7):1073–1076.
Tulzer G, et al. Diastolic function of the fetal heart during second and third trimester: a prospective longitudinal Doppler-echocardiographic study. Eur J Pediatr. 1994;153(3):151–154.
Tworetzky W, et al. Improved surgical outcome after fetal diagnosis of hypoplastic left heart syndrome. Circulation. 2001;103(9):1269–1273.
Vogel M, et al. Prevalence of increased nuchal translucency in fetuses with congenital cardiac disease and a normal karyotype. Cardiol Young. 2009;19(5):441–445.
Yagel S, Cohen SM, Achiron R. Examination of the fetal heart by five short-axis views: a proposed screening method for comprehensive cardiac evaluation. Ultrasound Obstet Gynecol. 2001;17(5):367–369.
Question
1.In the transverse plane at the level of the fetal stomach, which findings would be compatible with normal cardiac situs?
A.Aorta to the right of the spine, IVC anterior and to the left
B.Aorta to the left of the spine, IVC anterior and to the left
C.Aorta to the right of the spine, IVC anterior and to the right
D.Aorta to the left of the spine, IVC anterior and to the right
E.IVC to the right of the spine, aorta anterior and to the left
2.Assuming that the fetal stomach and cardiac apex are to the left, what abnormality is demonstrated in this video?
[Insert Video Question 2 Chapter 32]
A.There is Ebstein malformation of the tricuspid valve.
B.There is mirror image atrial arrangement.
C.The atrioventricular connections are discordant.
D.The findings are within normal limits
E.The inferior vena cava is interrupted
3.Assuming that the fetal stomach and cardiac apex are to the left, what abnormality is demonstrated in this video?
[Insert Video Question 3 Chapter 32]
A.There is transposition of the great arteries.
B.There is an atrioventricular septal defect.
C.There is hypoplastic left-heart syndrome.
D.There is tricuspid atresia.
E.There is total anomalous pulmonary venous drainage.
4.Assuming that the fetal stomach and cardiac apex are to the left, what abnormality is demonstrated in this video?
[Insert Video Question 4 Chapter 32]
A.There is a primum atrial septal defect.
B.There is an aortopulmonary window.
C.There is an atrioventricular septal defect.
D.There is a ventricular septal defect.
E.The atrioventricular connections are discordant.
5.Assuming that the fetal stomach and cardiac apex are to the left, what abnormality is demonstrated in this video?
[Insert Video Question 5 Chapter 32]
A.The findings are within normal limits.
B.There is a ventricular septal defect.
C.There is a left superior vena cava draining to the coronary sinus.
D.The ventriculoarterial connections are discordant.
E.There is an atrioventricular septal defect.
6.Assuming that the fetal stomach and cardiac apex are to the left, what abnormality is demonstrated in this video?
[Insert Video Question 6 Chapter 32]
A.There is a sinus venous atrial septal defect.
B.There is a ventricular septal defect.
C.There is double inlet left ventricle.
D.There is agenesis of the ductus venosus.
E.There is an atrioventricular septal defect.
7.Assuming that the fetal stomach and cardiac apex are to the left, what abnormality is demonstrated in this video?
[Insert Video Question 7 Chapter 32]
A.There is a ventricular septal defect with an overriding aorta.
B.There is an apical ventricular septal defect.
C.There is an atrioventricular septal defect.
D.There is double outlet right ventricle.
E.There is transposition of the great arteries.
8.Assuming that the fetal stomach and cardiac apex are to the left, what abnormality is demonstrated in this video?
[Insert Video Question 8 Chapter 32]
A.There is a left superior vena cava.
B.There are bilateral superior vena cava.
C.There is an interrupted aortic arch.
D.The findings are within normal limits.
E.There is transposition of the great arteries.
9.Assuming that the fetal stomach and cardiac apex are to the left, what abnormality is demonstrated in this video?
[Insert Video Question 9 Chapter 32]
A.There is Tetralogy of Fallot.
B.There is transposition of the great arteries.
C.There is pulmonary atresia.
D.The findings are within normal limits.
E.There is truncus arteriosus.
10.What is the demonstrated by this M mode?
[Insert Video Question 10 Chapter 32]
A.There are multiple atrial ectopic beats.
B.There is first degree heart block.
C.There is ventricular tachycardia.
D.There is sinus bradycardia.
E.There is complete heart block.
Answers
1.Answer: D. Aorta to the left of the spine, IVC anterior and to the right.
2.Answer: C. The atrioventricular connections are discordant. There is reversal of the normal pattern of offsetting of the atrioventricular valves.
3.Answer: C. There is hypoplastic left-heart syndrome. The pulmonary veins drain to a left atrium, but there is absence of a left-sided AV valve and no discernible left ventricle. In this example, the pulmonary veins are dilated due to a restrictive atrial septum.
4.Answer: C. There is a ventricular septal defect. The defect is demonstrated on 2-D and color-flow Doppler. This defect is in the muscular portion of the ventricular septum, in contrast to perimembranous defects, which are seen adjacent to the crux of the heart.
5.Answer: A. The findings are within normal limits.
6.Answer: E. There is an atrioventricular septal defect. There is a common atrioventricular junction with loss of the “primum” component of the atrial septum. The atrioventricular valves insert at the same level so that there is loss of the normal differential insertion of the mitral and tricuspid valves.
7.Answer: A. There is a ventricular septal defect with an overriding aorta. It important to work sequentially to delineate the entire cardiac anatomy to confirm the diagnosis. The differential diagnosis would include: pulmonary atresia/VSD; Tetralogy of Fallot; maligned VSD; or common arterial trunk. One must confirm that the great artery is an aorta because otherwise this would be TGA with VSD.
8.Answer: B. There are bilateral superior vena cavae. Four vessels are seen instead of the normal three vessels. This demonstrates (from top of screen) left SVC, PA, aorta, and right SVC.
9.Answer: B. There is transposition of the great arteries. The image sweeps cranially from the left ventricle, which is connected to the pulmonary artery. Continuing cranially, the aorta is more anterior and arising from the right ventricle. Note only two vessels are visualized in the upper mediastinum.
10.Answer: E. There is complete heart block. There is atrioventricular dissociation, with a faster atrial rate and a slower ventricular rate. There is no consistent relationship between the atrial and ventricular beats, i.e. the atria and ventricles are contracting independently of each other.