Jane A. Leopold ![]() David P. Faxon
David P. Faxon
Diagnostic cardiac catheterization and coronary angiography are considered the gold standard in the assessment of the anatomy and physiology of the heart and its associated vasculature. In 1929, Forssmann demonstrated the feasibility of cardiac catheterization in humans when he passed a urological catheter from a vein in his arm to his right atrium and documented the catheter’s position in the heart by x-ray. In the 1940s, Cournand and Richards applied this technique to patients with cardiovascular disease to evaluate cardiac function. These three physicians were awarded the Nobel Prize in 1956. In 1958, Sones inadvertently performed the first selective coronary angiography when a catheter in the left ventricle slipped back across the aortic valve, engaged the right coronary artery, and power-injected 40 mL of contrast down the vessel. The resulting angiogram provided superb anatomic detail of the artery, and the patient suffered no adverse effects. Sones went on to develop selective coronary catheters, which were modified further by Judkins, who developed preformed catheters and allowed coronary artery angiography to gain widespread use as a diagnostic tool. In the United States, cardiac catheterization is the second most common operative procedure, with nearly 3 million procedures performed annually.
CARDIAC CATHETERIZATION
INDICATIONS, RISKS, AND PREPROCEDURE MANAGEMENT
Cardiac catheterization and coronary angiography are indicated to evaluate the extent and severity of cardiac disease in symptomatic patients and to determine if medical, surgical, or catheter-based interventions are warranted (Table 13-1). They are also used to exclude severe disease in symptomatic patients with equivocal findings on noninvasive studies and in patients with chest-pain syndromes of unclear etiology for whom a definitive diagnosis is necessary for management. Cardiac catheterization is not mandatory prior to cardiac surgery in some younger patients who have congenital or valvular heart disease that is well defined by noninvasive imaging and who do not have symptoms or risk factors that suggest concomitant coronary artery disease.
TABLE 13-1
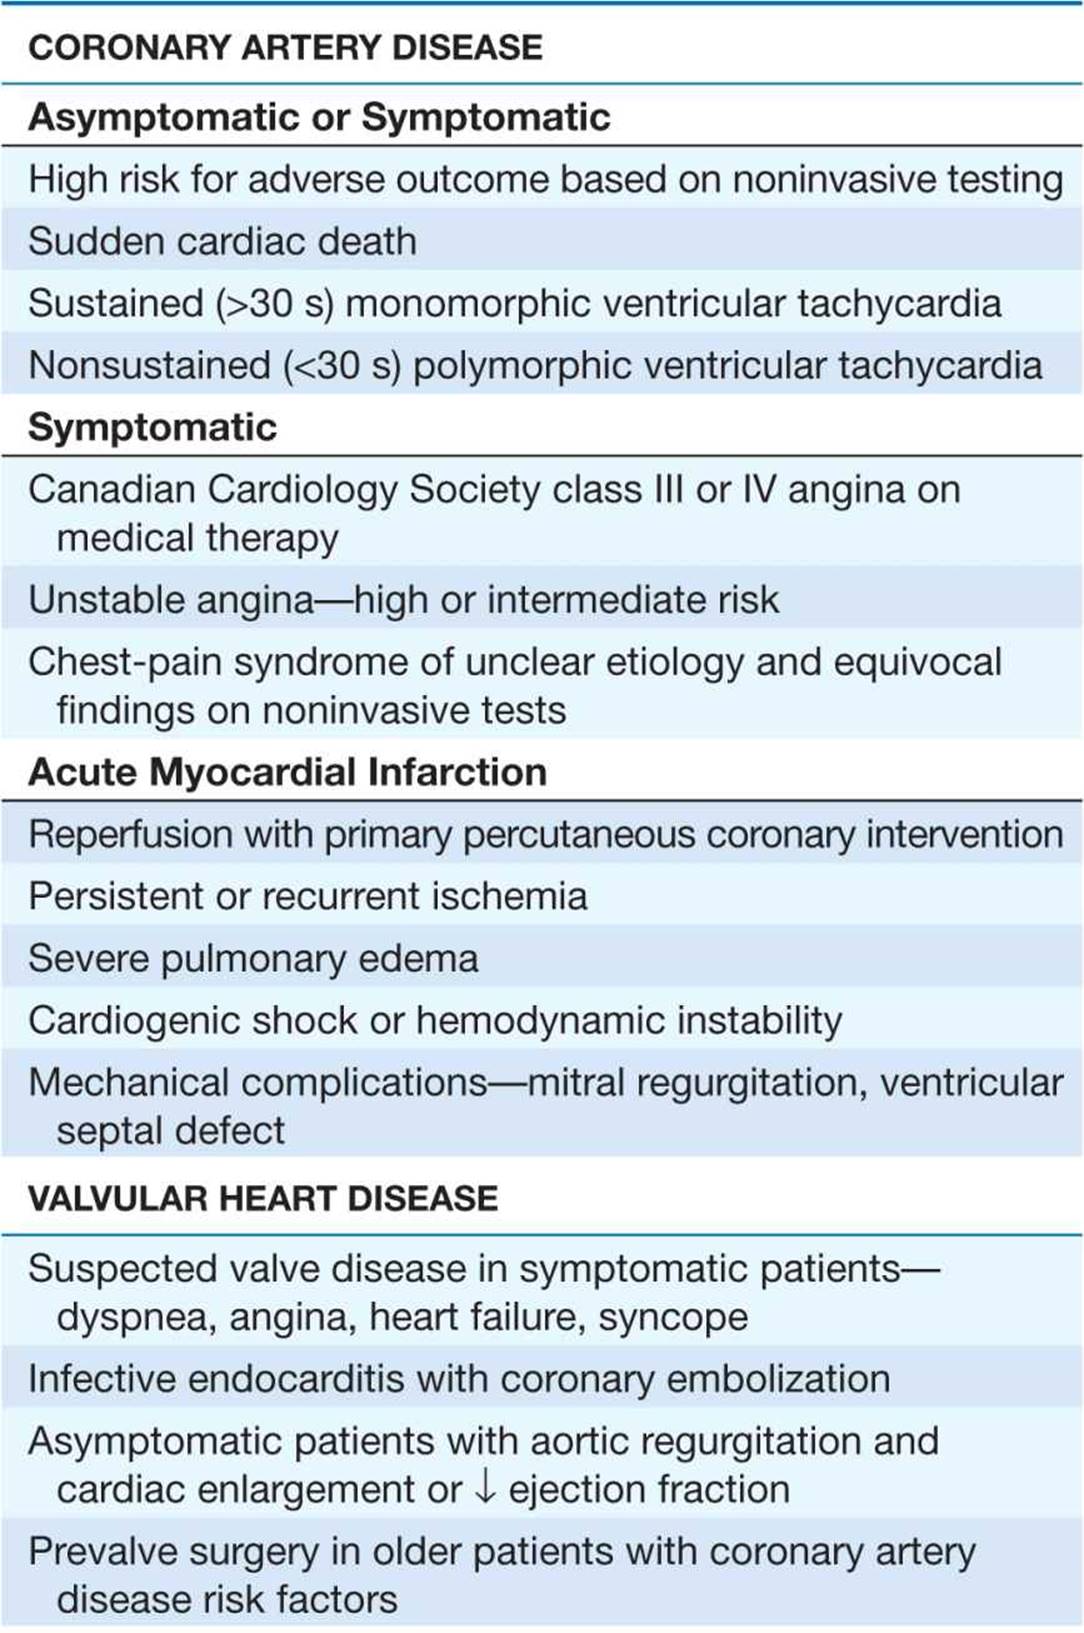
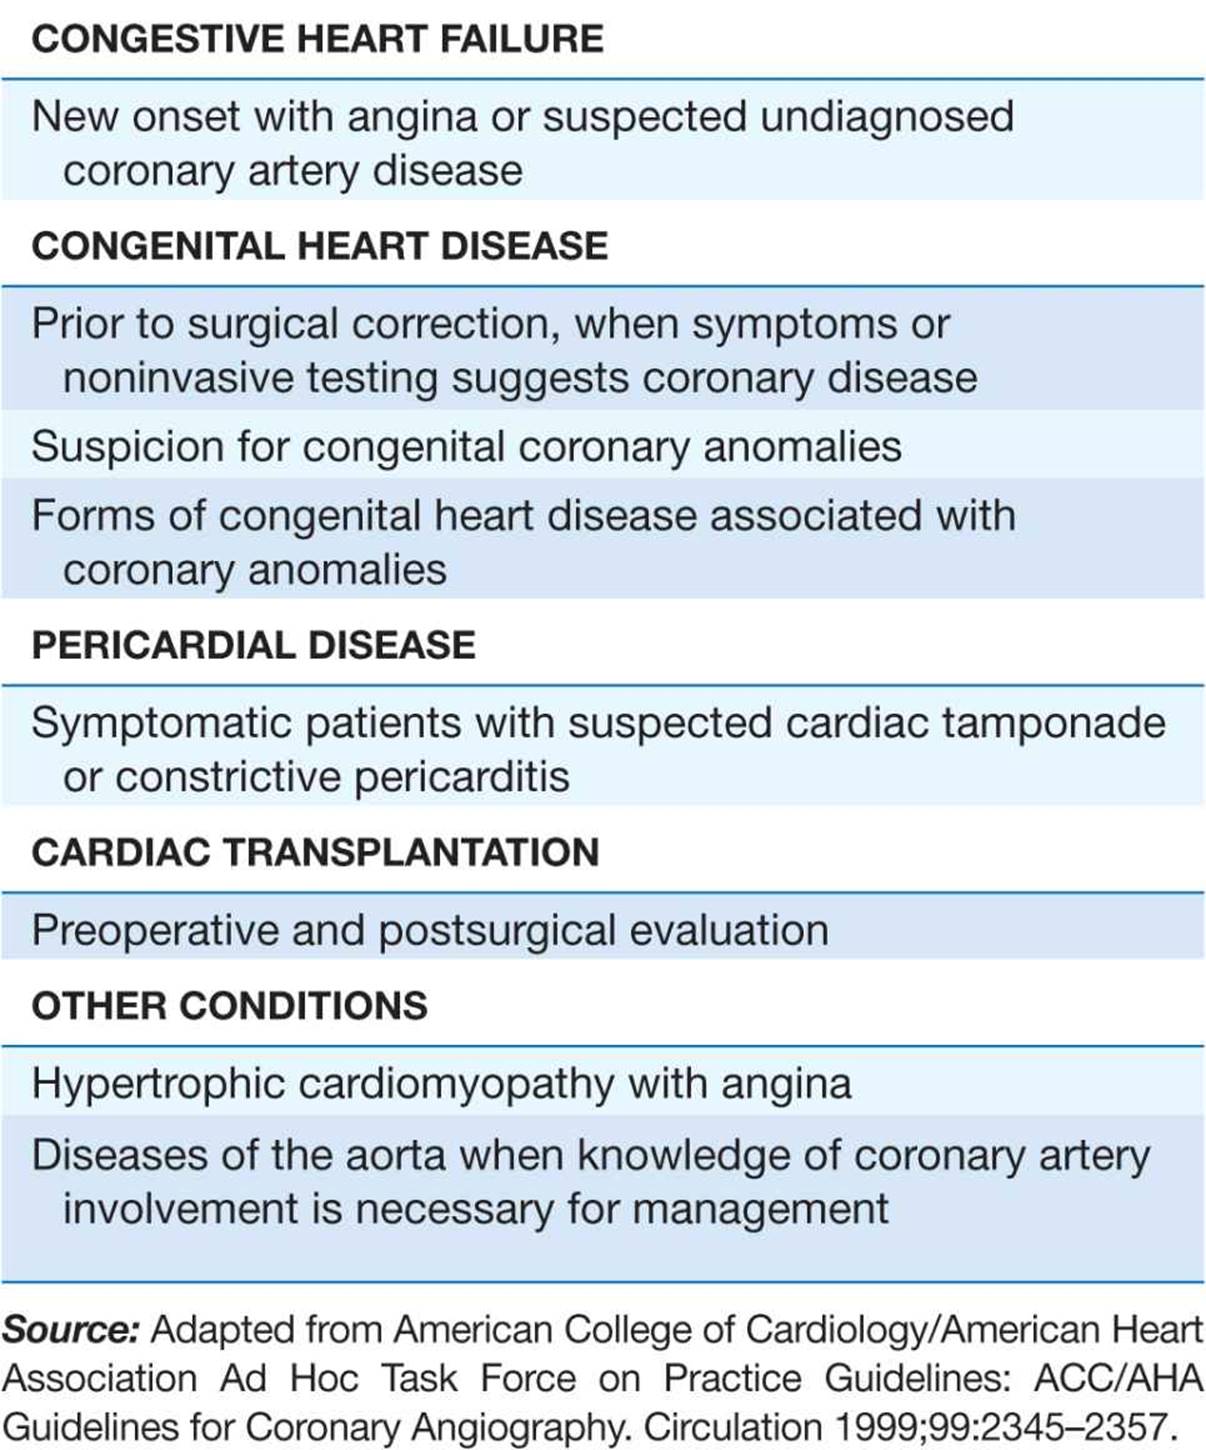
INDICATIONS FOR CARDIAC CATHETERIZATION AND CORONARY ANGIOGRAPHY
The risks associated with elective cardiac catheterization are relatively low, with a reported risk of 0.05% for myocardial infarction, 0.07% for stroke, and 0.08–0.14% for death. These risks increase substantially if the catheterization is performed emergently, during acute myocardial infarction, or in hemodynamically unstable patients. Additional risks of the procedure include tachy- or bradyarrhythmias that require countershock or pharmacologic therapy, acute renal failure leading to transient or permanent dialysis, vascular complications that necessitate surgical repair, and significant access-site bleeding. Of these risks, vascular access-site bleeding is the most common complication, occurring in 1.5–2.0% of patients, with major bleeding events associated with a worse short- and long-term outcome.
In patients who understand and accept the risks associated with cardiac catheterization, there are no absolute contraindications when the procedure is performed in anticipation of a life-saving intervention. Relative contraindications do, however, exist; these include decompensated congestive heart failure; acute renal failure; severe chronic renal insufficiency, unless dialysis is planned; bacteremia; acute stroke; active gastrointestinal bleeding; severe, uncorrected electrolyte abnormalities; a history of an anaphylactic/anaphylactoid reaction to iodinated contrast agents; and a history of allergy/bronchospasm to aspirin in patients for whom progression to a percutaneous coronary intervention is likely.
Contrast allergy and contrast-induced renal failure merit further consideration, because these adverse events may occur in otherwise healthy individuals and prophylactic measures exist to reduce risk. Allergic reactions to contrast agents occur in <5% of cases with severe anaphylactoid (clinically indistinguishable from anaphylaxis, but not mediated by an IgE mechanism) reactions occurring in 0.1–0.2% of patients. Mild reactions manifest as nausea, vomiting, and urticaria, while severe anaphylactoid reactions lead to hypotensive shock, pulmonary edema, and cardiorespiratory arrest. Patients with a history of significant contrast allergy should be premedicated with corticosteroids and anti-histamines (H1- and H2-blockers) and studies performed with nonionic, low-osmolar contrast agents that have a lower reported rate of allergic reactions.
Contrast-induced nephropathy, defined as an increase in creatinine >0.5 mg/dL or 25% above baseline that occurs 48–72 h after contrast administration, occurs in ~2–7% of patients with rates of 20–30% reported in high-risk patients, including those with diabetes mellitus, congestive heart failure, chronic kidney disease, anemia, and older age. Dialysis is required in 0.3–0.7% of patients and is associated with a five-fold increase in in-hospital mortality. For all patients, adequate intravascular volume expansion with intravenous 0.9% saline (1.0–1.5 mL/kg per hour) for 3–12 h before and continued 6–24 h after the procedure limits the risk of contrast-induced nephropathy. In patients with chronic kidney disease, additional pretreatment with N-acetylcysteine (Mucomist, 600 mg bid orally before and two days after catheterization) also decreases risk. Diabetic patients treated with metformin should stop the drug 48 h prior to the procedure to limit the associated risk of lactic acidosis. Other strategies to decrease risk include the administration of sodium bicarbonate, although there is conflicting data regarding its efficacy; use of low- or iso-osmolar contrast agents; and limiting the volume of contrast to <100 mL per procedure.
Cardiac catheterization is performed after the patient has fasted for 6 h and has received IV conscious sedation to remain awake but sedated during the procedure. All patients with suspected coronary artery disease are pretreated with 325 mg aspirin. In patients in whom the procedure is likely to progress to a percutaneous coronary intervention, a clopidogrel 600-mg loading dose followed by 75 mg daily should be started. Warfarin is held starting 48 h prior to the catheterization to allow the international normalized ratio (INR) to fall to <2.0 and limit access-site bleeding complications. Cardiac catheterization is a sterile procedure, so antibiotic prophylaxis is not required.
TECHNIQUE
Cardiac catheterization and coronary angiography provide a detailed hemodynamic and anatomic assessment of the heart and coronary arteries. The selection of procedures is dependent upon the patient’s symptoms and clinical condition, with some direction provided by noninvasive studies.
Vascular access
Cardiac catheterization procedures are performed using a percutaneous technique to enter the femoral artery and vein as the preferred access sites for left and right heart catheterization, respectively. A flexible sheath is inserted into the vessel over a guidewire, allowing diagnostic catheters to be introduced into the vessel and advanced toward the heart using fluoroscopic guidance. The brachial or radial artery may also be used as an arterial access site in patients with peripheral arterial disease that involves the abdominal aorta, iliac, or femoral vessels; severe iliac-artery tortuosity; morbid obesity; or preference for early postprocedure ambulation. Use of radial-artery access is gaining popularity owing to a lower rate of access-site bleeding complications. A normal Allen’s test confirming dual blood supply to the hand from the radial and ulnar arteries is a prerequisite to access this site. The internal jugular vein serves as an alternate access site to the right heart when the patient has an inferior vena cava filter in place or requires prolonged hemodynamic monitoring.
Right heart catheterization
This procedure measures pressures in the right heart. Right heart catheterization is no longer a routine part of diagnostic cardiac catheterization, but it is reasonable in patients with unexplained dyspnea, valvular heart disease, pericardial disease, right and/or left ventricular dysfunction, congenital heart disease, and suspected intracardiac shunts. Right heart catheterization uses a balloon-tipped flotation catheter that is inserted into the femoral or jugular vein. Using fluoroscopic guidance, the catheter is advanced sequentially to the right atrium, right ventricle, pulmonary artery, and pulmonary wedge position (as a surrogate for left atrial pressure); in each cardiac chamber, pressure is measured and blood samples are obtained for oxygen-saturation analysis to screen for intracardiac shunts.
Left heart catheterization
This procedure measures pressures in the left heart as a determinant of left ventricular performance. With the aid of fluoroscopy, a catheter is guided to the ascending aorta and across the aortic valve into the left ventricle to provide a direct measure of left ventricular pressure. In patients with a tilting-disc prosthetic aortic valve, crossing the valve with a catheter is contraindicated and the left heart may be accessed from the right atrium using a needle-tipped catheter to puncture the atrial septum at the fossa ovalis. Once the catheter crosses from the right to the left atrium, it can be advanced across the mitral valve to the left ventricle. This technique is also used for mitral valvuloplasty. Heparin is given for prolonged procedures to limit the risk of stroke from embolism of clots that may form on the catheter.
HEMODYNAMICS
A comprehensive hemodynamic assessment involves obtaining pressure measurements in the right and left heart and peripheral arterial system and determining the cardiac output (Table 13-2). The shape and magnitude of the pressure waveforms provide important diagnostic information; an example of normal pressure tracings is shown in Fig. 13-1. In the absence of valvular heart disease, the atria and ventricles are “one chamber” during diastole when the tricuspid and mitral valves are open while in systole, when the pulmonary and aortic valves are open, the ventricles and their respective outflow tracts are considered “one chamber.” These concepts form the basis by which hemodynamic measurements are used to assess valvular stenosis. When aortic stenosis is present, there is a systolic pressure gradient between the left ventricle and the aorta; when mitral stenosis is present, there is a diastolic pressure gradient between the pulmonary capillary wedge (left atrial) pressure and the left ventricle (Fig. 13-2). Hemodynamic measurements also discriminate between aortic stenosis and hypertrophic obstructive cardiomyopathy where the asymmetrically hypertrophied septum creates a dynamic intraventricular pressure gradient during ventricular systole. The magnitude of this obstruction is measured using an end-hole catheter positioned at the left ventricular apex that is pulled back while recording pressure; once the catheter has passed the septal obstruction and is positioned in the apex of the left ventricle, a gradient can be measured between the left ventricular apex and the aorta. Hypertrophic obstructive cardiomyopathy is confirmed by the Brockenbrough-Braunwald sign: following a premature ventricular contraction, there is an increase in the left ventricular–aorta pressure gradient with a simultaneous decrease in the aortic pulse pressure. These findings are absent in aortic stenosis.
FIGURE 13-1
Normal hemodynamic waveforms recorded during right heart catheterization. Atrial pressure tracings have a characteristic “a” wave that reflects atrial contraction and a “v” wave that reflects pressure changes in the atrium during ventricular systole. Ventricular pressure tracings have a low pressure diastolic filling period and a sharp rise in pressure that occurs during ventricular systole. RA, right atrium; RV, right ventricle; PA, pulmonary artery; PCWP, pulmonary capillary wedge pessure; s, systole; d, diastole.
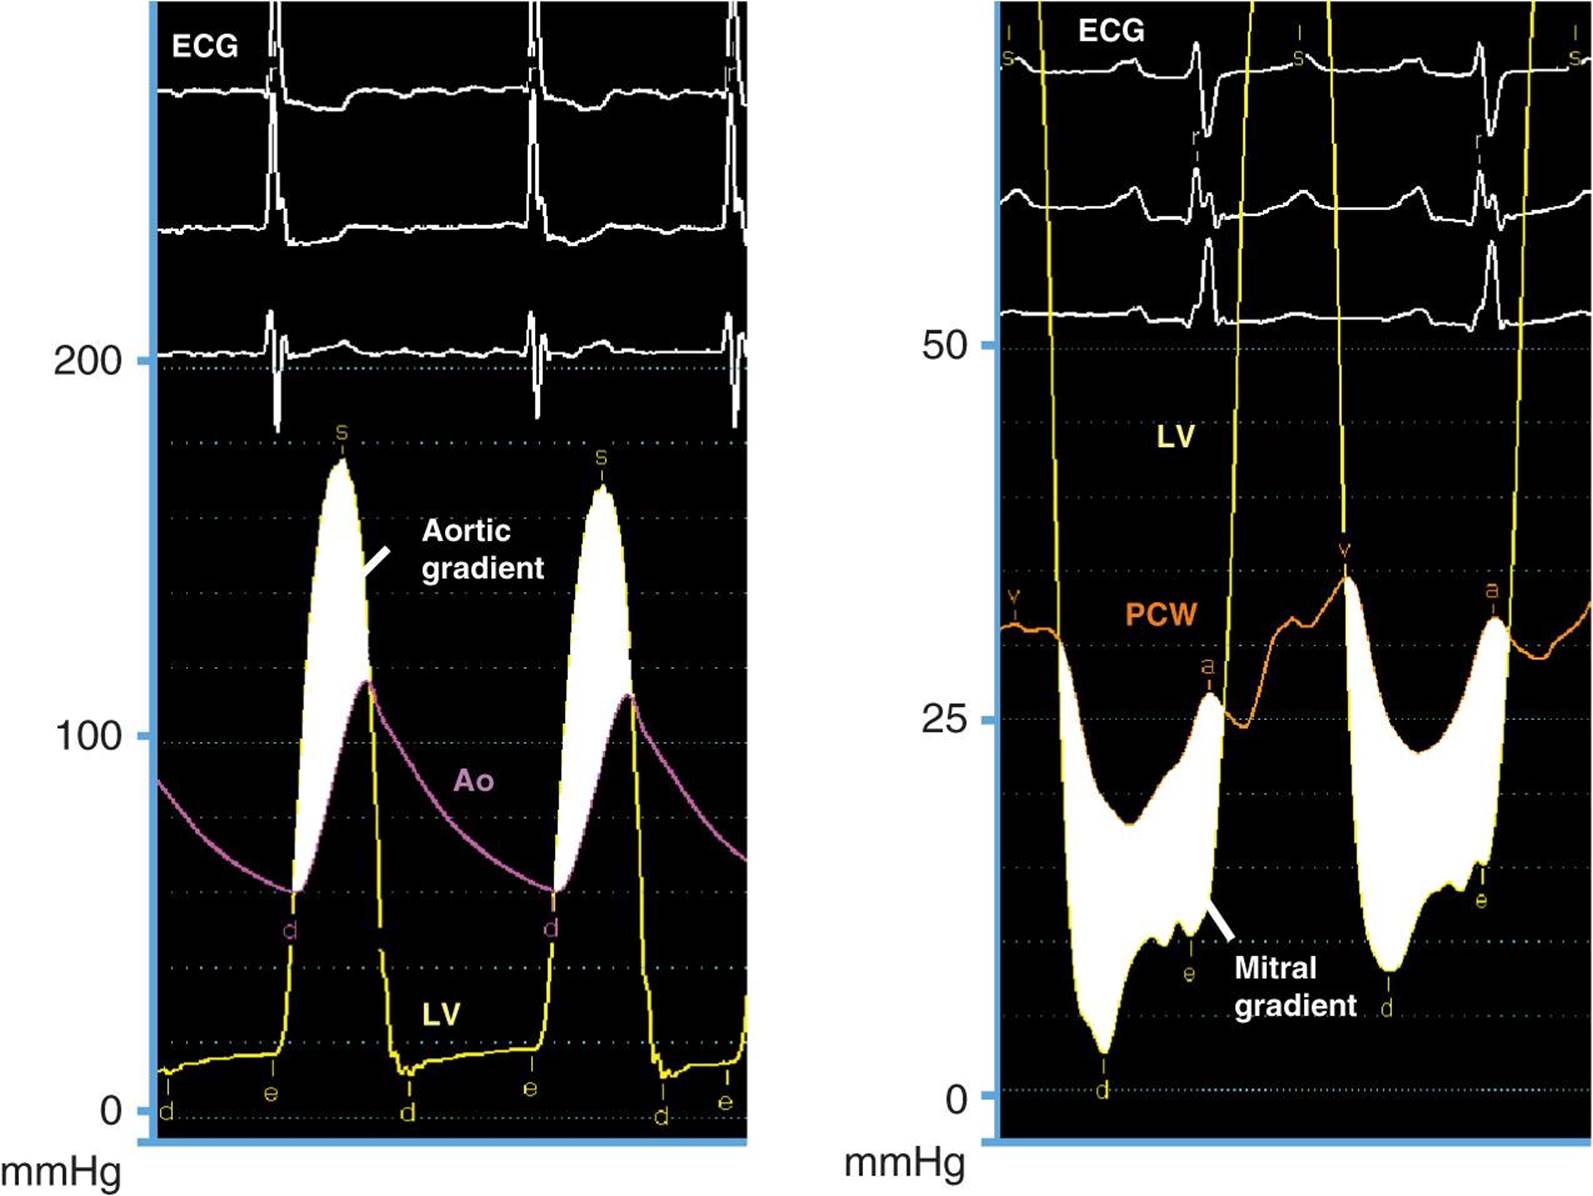
FIGURE 13-2
Severe aortic and mitral stenosis. Simultaneous recording of left ventricular (LV) and aortic (Ao) pressure tracings demonstrate a 62-mmHg mean systolic gradient (shaded area) that corresponds to an aortic valve area of 0.6 cm2(left). Simultaneous recording of LV and pulmonary capillary wedge (PCW) pressure tracings reveal a 14-mmHg mean diastolic gradient (shaded area) that is consistent with critical mitral stenosis (mitral valve area = 0.5 cm2). s, systole; d, diastole; e, end diastole.
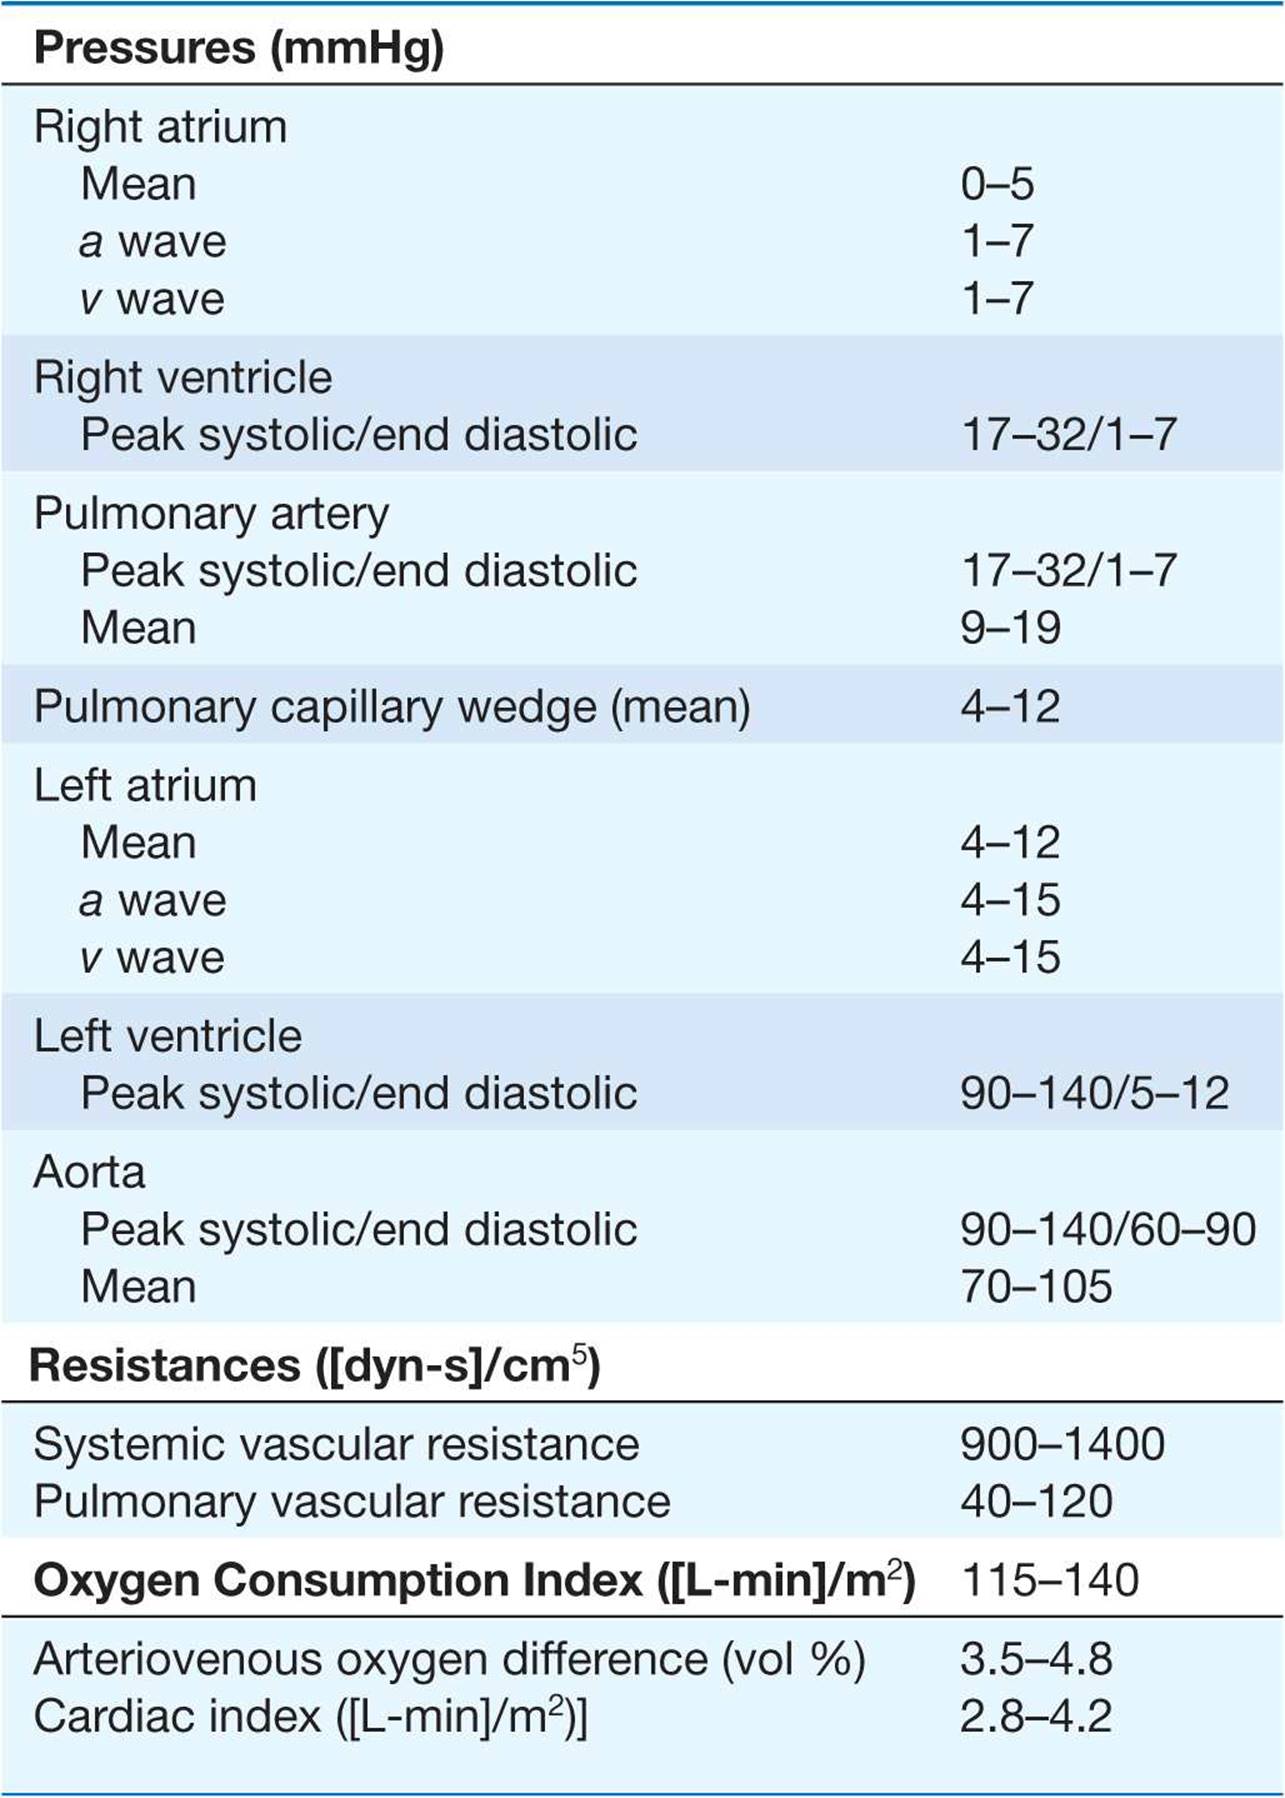
TABLE 13-2
NORMAL VALUES FOR HEMODYNAMIC MEASUREMENTS
Regurgitant valvular lesions increase volume (and pressure) in the “receiving” cardiac chamber. In severe mitral and tricuspid regurgitation, the increase in blood flow to the atria takes place during ventricular systole, leading to an increase in the v wave (two times greater than the mean pressure). Severe aortic regurgitation leads to a decrease in aortic diastolic pressure with a concomitant rise in left ventricular end-diastolic pressure, resulting in equalization of pressures between the two chambers at end diastole.
Hemodynamic measurements are also used to differentiate between cardiac tamponade, constrictive pericarditis, and restrictive cardiomyopathy. In cardiac tamponade, right atrial pressure is increased with a decreased “y” descent, indicative of impaired right atrial emptying in diastole, and there is diastolic equalization of pressures in all cardiac chambers. In constrictive pericarditis, right atrial pressure is elevated with a prominent “y” descent, indicating rapid filling of the right ventricle during early diastole. A diastolic dip and plateau or “square root sign,” in the ventricular waveforms due to an abrupt halt in ventricular filling during diastole; right ventricular and pulmonary artery pressures are elevated; and discordant pressure changes in the right and left ventricles with inspiration (right ventricular systolic pressure increases while left ventricular systolic pressure decreases) are observed. The latter hemodynamic phenomenon is the most specific for constriction. Restrictive cardiomyopathy may be distinguished from constrictive pericarditis by a marked increase in right ventricular and pulmonary artery systolic pressures (usually >60 mmHg), a separation of the left and right ventricular diastolic pressures by >5 mmHg (at baseline or with acute volume loading), and concordant changes in left and right ventricular diastolic filling pressures with inspiration (both increase).
Cardiac output
Cardiac output is measured by the Fick method or the thermodilution technique or calculated from left ventricular angiography. Typically, the Fick method and thermodilution technique are both performed during cardiac catheterization, although the Fick method is considered more reliable in the presence of tricuspid regurgitation and in low-output states. The Fick method uses oxygen as the indicator substance and is based on the principle that the amount of a substance taken up or released by an organ (oxygen consumption) is equal to the product of its blood flow (cardiac output) and the difference in the concentration of the substance in the arterial and venous circulation (arterial-venous oxygen difference). Thus, the formula for calculating the Fick cardiac output is:
Cardiac output (L/min) = (oxygen consumption [mL/min])/(arterial-venous oxygen difference [mL/L])
Oxygen consumption is estimated as 125 mL oxygen/minute × body surface area, and the arterial-venous oxygen difference is determined by first calculating the oxygen-carrying capacity of blood (hemoglobin [g/100 mL] × 1.36 [mL oxygen/g hemoglobin] × 10) and multiplying this product by the fractional oxygen saturation. The thermodilution method measures a substance that is injected into and adequately mixes with blood. In contemporary practice, thermodilution cardiac outputs are measured using temperature as the indicator. Measurements are made with a thermistor-tipped catheter that detects temperature deviations in the pulmonary artery after the injection of 10 mL of room-temperature normal saline into the right atrium. Cardiac output may also be calculated from the left ventriculogram by first determining left ventricular volumes in end diastole and end systole using the area-length method. Cardiac output is equal to the heart rate × stroke volume, which is the difference between the end-diastolic volume and the end-systolic volume.
Vascular resistance
Resistance across the systemic and pulmonary circulations is calculated by extrapolating from Ohm’s law of electrical resistance and is equal to the mean pressure gradient divided by the mean flow (cardiac output). Therefore, systemic vascular resistance is ([mean aortic pressure – mean right atrial pressure]/cardiac output) multiplied by 80 to convert the resistance from Wood units to dyn-s-cm–5. Similarly, the pulmonary vascular resistance is ([mean pulmonary artery – mean pulmonary capillary wedge pressure]/cardiac output) × 80. Pulmonary vascular resistance is lowered by oxygen, nitroprusside, calcium channel blockers, prostacyclin infusions, and inhaled nitric oxide; these therapies may be administered during catheterization to determine if increased pulmonary vascular resistance is fixed or reversible.
Valve area
Hemodynamic data may also be used to calculate the valve area using the Gorlin formula that equates the area to the flow across the valve divided by the pressure gradient between the cardiac chambers surrounding the valve. The formula for the assessment of valve area is: Area = (cardiac output [cm3/min]/[systolic ejection period or diastolic filling period][heart rate])/44.3 C × square root of the pressure gradient, where C = 1 for aortic valve and 0.85 for the mitral valve. A valve area of <1.0 cm2 and a mean gradient of greater than 40 mmHg indicate severe aortic stenosis, while a valve area of <1.5 cm2 and a mean gradient >5–10 mmHg is consistent with moderate-to-severe mitral stenosis; in symptomatic patients with a mitral valve area >1.5 cm2, a mean gradient >15 mmHg, pulmonary artery pressure >60 mmHg, or a pulmonary artery wedge pressure >25 mmHg after exercise is also considered significant and may warrant intervention. The modified Hakki formula has also been used to estimate aortic valve area. This formula calculates the valve area as the cardiac output (L/min) divided by the square root of the pressure gradient. Aortic valve area calculations based on the Gorlin formula are flow-dependent and, therefore, for patients with low cardiac outputs, it is imperative to determine if a decreased valve area actually reflects a fixed stenosis or is overestimated by a low cardiac output and stroke volume that is insufficient to open the valve leaflets fully. In these instances, cautious hemodynamic manipulation using dobutamine to increase the cardiac output and recalculation of the aortic valve area may be necessary.
Intracardiac shunts
In patients with congenital heart disease, detection, localization, and quantification of the intracardiac shunt should be evaluated. A shunt should be suspected when there is unexplained arterial desaturation or increased oxygen saturation of venous blood. A “step up” or increase in oxygen content indicates the presence of a left-to-right shunt while a “step down” indicates a right-to-left shunt. The shunt is localized by detecting a difference in oxygen saturation levels of 5–7% between adjacent cardiac chambers. The severity of the shunt is determined by the ratio of pulmonary blood flow (Qp) to the systemic blood flow (Qs), or Qp/Qs = ([systemic arterial oxygen content – mixed venous oxygen content]/pulmonary vein oxygen content – pulmonary artery oxygen content). For an atrial septal defect, a shunt ratio of 1.5 is considered significant and factored with other clinical variables to determine the need for intervention. When a congenital ventricular septal defect is present, a shunt ratio of ≥2.0 with evidence of left ventricular volume overload is a class I indication for surgical correction.
VENTRICULOGRAPHY AND AORTOGRAPHY
Ventriculography to assess left ventricular function may be performed during cardiac catheterization. A pigtail catheter is advanced retrograde across the aortic valve into the left ventricle and 30–45 mL of contrast is power-injected to visualize the left ventricular chamber during the cardiac cycle. The ventriculogram is usually performed in the right anterior oblique projection to examine wall motion and mitral valve function. Normal wall motion is observed as symmetric contraction of all segments; hypokinetic segments have decreased contraction, akinetic segments do not contract, and dyskinetic segments appear to bulge paradoxically during systole (Fig. 13-3). Ventriculography may also reveal a left ventricular aneurysm, pseudoaneurysm, or diverticulum and can be used to assess mitral valve prolapse and the severity of mitral regurgitation. The degree of mitral regurgitation is estimated by comparing the density of contrast opacification of the left atrium with that of the left ventricle. Minimal contrast reflux into the left atrium is considered 1+ mitral regurgitation while contrast density in the left atrium that is greater than that in the left ventricle with reflux of contrast into the pulmonary veins within three beats defines 4+ mitral regurgitation.
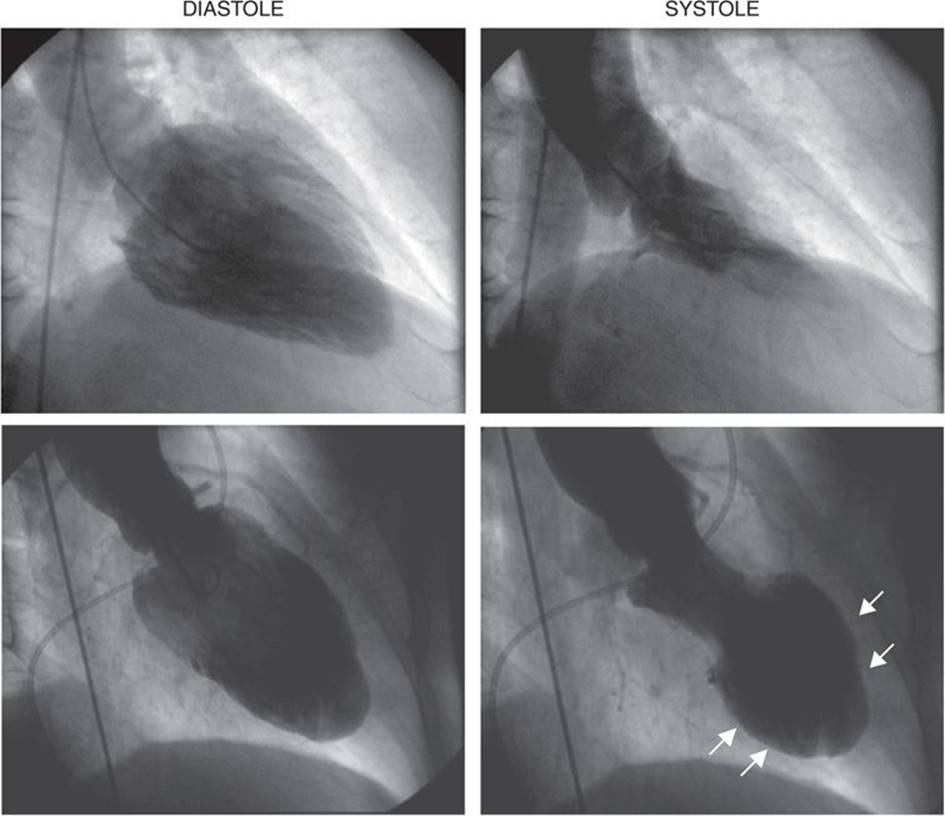
FIGURE 13-3
Left ventriculogram at end diastole (left) and end systole (right). In patients with normal left ventricular function, the ventriculogram reveals symmetric contraction of all walls (top). Patients with coronary artery disease may have wall motion abnormalities on ventriculography as seen in this 60-year-old male following a large anterior myocardial infarction. In systole, the anterior, apical, and inferior walls are akinetic (white arrows) (bottom).
Aortography in the cardiac catheterization laboratory visualizes abnormalities of the ascending aorta, including aneurysmal dilation and involvement of the great vessels, as well as dissection with compression of the true lumen by an intimal flap that separates the true and false lumina. Aortography can also be used to identify patent saphenous vein grafts that elude selective cannulation, identify shunts that involve the aorta such as a patent ductus arteriosus, and provide a qualitative assessment of aortic regurgitation using a 1+ – 4+ scale similar to that used for mitral regurgitation.
CORONARY ANGIOGRAPHY
Selective coronary angiography is almost always performed during cardiac catheterization and is used to define the coronary anatomy and determine the extent of epicardial coronary artery and coronary artery bypass graft disease. Specially shaped coronary catheters are used to engage the left and right coronary ostia. Hand injection of radiopaque contrast agents create a coronary “luminogram” that is recorded on a radiographic images (cine angiography). Because the coronary arteries are three-dimensional objects that are in motion with the cardiac cycle, angiograms of the vessels using several different orthogonal projections are taken to best visualize the vessels without overlap or foreshortening.
The normal coronary anatomy is highly variable between individuals, but, in general, there are two coronary ostia and three major coronary vessels—the left anterior descending, the left circumflex, and the right coronary arteries with the left anterior descending and left circumflex arteries arising from the left main coronary artery (Fig. 13-4). When the right coronary artery is the origin of the A-V nodal branch, the posterior descending artery, and the posterior lateral vessels, the circulation is defined as right dominant; this is found in ~85% of individuals. When these branches arise from the left circumflex artery as occurs in ~5% of individuals, the circulation is defined as left dominant. The remaining ~10% of patients have a codominant circulation with vessels arising from both the right and left coronary circulation. In some patients, a ramus intermedius branch arises directly from the left main coronary artery; this finding is a normal variant. Coronary artery anomalies occur in 1–2% of patients, with separate ostia for the left anterior descending and left circumflex arteries being the most common (0.41%).
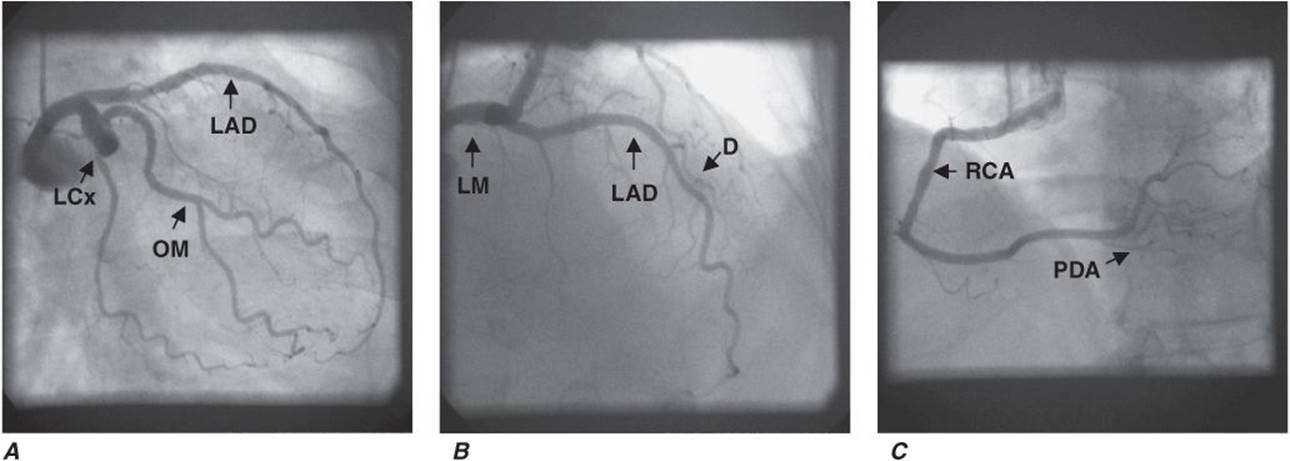
FIGURE 13-4
Normal coronary artery anatomy. A. Coronary angiogram showing the left circumflex (LCx) artery and its obtuse marginal (OM) branches. The left anterior descending artery (LAD) is also seen but may be foreshortened in this view. B. The LAD and its diagonal (D) branches are best seen in cranial views. In this angiogram, the left main (LM) coronary artery is also seen. C. The right coronary artery gives off the posterior descending artery (PDA) so this is a right-dominant circulation.
Coronary angiography visualizes coronary artery stenoses as luminal narrowings on the cine angiogram. The degree of narrowing is referred to as the percent stenosis and is determined visually by comparing the most severely diseased segment with a proximal or distal “normal segment” mg; a stenosis >50% is considered significant (Fig. 13-5). Online quantitative coronary angiography can provide a more accurate assessment of the percent stenosis and lessen the tendency to overestimate lesion severity visually. The presence of a myocardial bridge, which most commonly involves the left anterior descending artery, may be mistaken for a significant stenosis; this occurs when a portion of the vessel dips below the epicardial surface into the myocardium and is subject to compressive forces during ventricular systole. The key to differentiating a myocardial bridge from a fixed stenosis is that the “stenosed” part of the vessel returns to normal during diastole. Coronary calcification is also seen during angiography prior to the injection of contrast agents. Collateral blood vessels may be seen traversing from one vessel to the distal vasculature of a severely stenosed or totally occluded vessel. Thrombolysis in myocardial infarction (TIMI) flow grade, a measure of the relative duration of time that it takes for contrast to opacify the coronary artery fully, may provide an additional clue to the degree of lesion severity, and the presence of TIMI grade 1 or 2 flow suggests that a significant coronary artery stenosis is present.
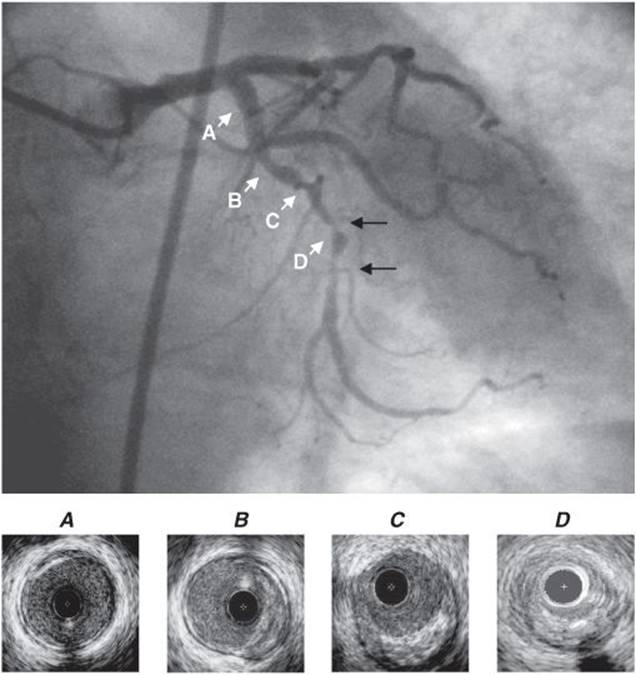
FIGURE 13-5
Coronary stenoses on cine angiogram and intravascular ultrasound. Significant stenoses in the coronary artery are seen as narrowings (black arrows) of the vessel. Intravascular ultrasound shows a normal segment of artery (A), areas with eccentric plaque (B, C), and near total obliteration of the lumen at the site of the significant stenosis (D). Note that the intravascular ultrasound catheter is present in the images as a black circle.
INTRAVASCULAR ULTRASOUND, FRACTIONAL FLOW RESERVE, AND CORONARY FLOW RESERVE
During coronary angiography, intermediate stenoses (40–70%), indeterminate findings, or anatomic findings that are incongruous with the patient’s symptoms may require further interrogation. In these cases, intravascular ultrasound provides a more accurate anatomic assessment of the coronary artery and the degree of coronary atherosclerosis (Fig. 13-5). Intravascular ultrasound is performed using a small flexible catheter with a 40-mHz transducer at its tip that is advanced into the coronary artery over a guidewire. Data from intravascular ultrasound studies may be used to image atherosclerotic plaque precisely, determine luminal cross-sectional area, and measure vessel size; it is also used during or following percutaneous coronary intervention to assess the stenosis and determine the adequacy of stent placement. Measurement of the fractional flow reserve provides a functional assessment of the stenosis. The fractional flow reserve is the ratio of the pressure in the coronary artery distal to the stenosis divided by the pressure in the artery proximal to the stenosis at maximal vasodilation. Fractional flow reserve is measured using a coronary pressure–sensor guidewire at rest and at maximal hyperemia following the injection of adenosine. A fractional flow reserve of <0.75 indicates a hemodynamically significant stenosis that would benefit from intervention. Measurement of coronary flow reserve is another technique to assess the functional severity of a stenosis, although this technique is used with less frequency than fractional flow reserve. The coronary flow reserve is the maximal coronary blood flow increase above resting conditions during maximal vasodilation and is a measure of both epicardial coronary artery and microvascular function. Coronary flow reserve is determined using a Doppler flow guidewire before and after the administration of adenosine to induce hyperemia. A coronary flow reserve <2:1 after maximal hyperemia is considered abnormal.
POSTPROCEDURE CARE
Once the procedure is completed, vascular access sheaths are removed. If the femoral approach is used, direct manual compression or vascular closure devices that immediately close the arteriotomy site with a staple/clip, collagen plug, or suture are used to achieve hemostasis. These devices decrease the length of bed rest (from 6 h to 2–4 h) and improve patient satisfaction but have not been shown definitively to be superior to manual compression with respect to access-site complications. When cardiac catheterization is performed as an elective outpatient procedure, the patient completes postprocedure bed rest in a monitored setting and is discharged home with instructions to liberalize fluids because contrast agents promote an osmotic diuresis, to avoid strenuous activity, and to observe the vascular access site for signs of complications. Overnight hospitalization may be required for high-risk patients with significant comorbidities, patients with complications occurring during the catheterization, or in patients who have undergone a percutaneous coronary intervention. Hypotension early after the procedure may be due to inadequate fluid replacement or retroperitoneal bleeding from the access site.