Frixos Paraskevas
![]() History
History
Flow cytometry (FC) is the measurement of numerous cell properties (cytometry) as the cells move in single file (flow) in a fluid column and interrupt a beam of laser light. The method allows the quantitative and qualitative analysis of several properties (multiparameter) of cell populations from body fluids.
Quantitative cytometry has its origins in the 1930s in the pioneering work of nucleic acid measurements of the cell by Caspersson and Schultz (1). The need to make measurements of large cell populations rapidly and accurately stimulated the development of instruments that were the forerunners of present-day flow cytometers. A significant discovery was the report by Coons and Kaplan of the conjugation of fluorescein to antibodies (2), which opened the field of detection of tissue antigens by specific antibodies using fluorescence. The next important development took advantage of the low electrical conductivity of a cell with respect to saline solutions. The rise of electrical impedance was used as a measure of cell volume as cells, suspended in saline, passed through an orifice (Coulter counters [Beckman Coulter, Hialeah, FL]) (3).
Modern Flow Cytometry
The need for multiparameter analysis was satisfied by the introduction of fluorescent dyes for measurement of total DNA content in the detection of cancer cells and fluorescent antibodies specific for cell-surface markers in the separation of cell subpopulations.
Fluorescent-activated Cell Sorter
The modern technology of FC is based on a seminal discovery borne of academic curiosity to obtain answers for fundamental questions in immunology. This provided the impetus for the construction of a fluorescent-activated cell sorter, which was used to separate plasma cells based on intracellular fluorescence, and the demonstration that antigen-binding lymphocytes are the precursors of antibody-producing cells (4) and human T and B cells (5).
The main light sources used today besides the argon lasers (488 nm) are krypton (407 nm) and dye lasers (595 nm). The number of dyes available allows the simultaneous measurement of up to 11 colors of fluorescence (6). In a clinical laboratory, the use of three or four fluorochromes provides sufficient information for diagnosis, avoiding great involvement in quality control, optimization, and color compensations. The name polychromatic FC has been suggested for the use of larger numbers of fluorochromes (7).
The modern flow cytometer is a remarkable instrument that combines a blend of modern technologies such as fluidics, lasers, optics, analog and digital electronics, and computer software. With such combinations, it can measure cell size, structure, and cellular contents, as well as any particle down to a size of approximately 0.1 μm. Its detection limit is approximately 1,000 molecules of a dye (i.e., 1 × 10-18 g/cell). It has been calculated that this is the amount of dye present in 1 g of water, if 1 g of the dye is evenly distributed in a volume of water with the dimensions of 3,000 km × 3,000 km × 300 m. The flow cytometer consists of three main compartments: (a) sample handling—flow cell and associated fluidics; (b) light sensing—light source, optics, and detectors of light scatter and fluorescence; and (c) signal processing—data collection and analysis (8).
Monoclonal Antibodies
The second important discovery complemented the first with the development of monoclonal antibodies by the Nobel Prize–winning discovery of Kohler and Milstein in 1975 (9). Fusion of an antibody-producing normal mouse spleen lymphocyte with a plasmacytoma (myeloma) cell generates a hybrid cell, called hybridoma, capable of producing unlimited quantities of monoclonal antibodies. Monoclonal antibodies revolutionized modern medicine from the laboratory to the bedside. Some of the problems related to the commercial impact of this discovery were briefly outlined (10).
The production of monoclonal antibodies is a relatively simple procedure, as shown in Figure 2.1. A mouse is injected with an antigen having several distinct epitopes. The mouse immune system responds to each epitope (A to D) by producing antibodies specific for each epitope (anti-A to anti-D). Each antibody is produced by the progeny of a single antigen-specific lymphocyte. The progeny of this lymphocyte is a clone, and, as a result, the antibody produced is monoclonal. Mouse spleen suspension is mixed in a test tube with plasmacytoma cells, which have no capacity to produce immunoglobulin (Ig). Addition of a fusion agent, such as polyethylene glycol, generates hybrids, each formed from the fusion of one antibody-producing lymphoid/plasmacytic cell and one plasmacytoma cell. The fused cell (hybridoma) inherits the property of producing an antibody of a single specificity (monoclonal) from the antibody-producing cell (parent I) and at the same time, it also inherits from parent II the property to be “immortal.” The fused cell is called hybridoma.
The advantages of monoclonal antibodies are their homogeneity, predictable specificity and affinity, and availability in very large quantities. Monoclonal antibodies have become an indispensable tool for diagnostic procedures, especially in FC, in bacteriology, for tumor localization by means of radioimmunoassays, and so forth.
The application of monoclonal antibodies by investigators created a crisis, which resulted from a plethora of designations given to the same molecule. A universal notation for cell antigens and the establishment of Workshops on Human Leukocyte Differentiation Antigens (HLAD) have brought some order in this field. The molecules are given a number following the designation CD (clusters of differentiation) (see Appendix). Multiple specificities are included under one designation (i.e., 13 for CD85 [CD85a to CD85m], the ILT/LIR family [Ig-like transcripts/leukocyte inhibitory receptors], and 14 for CD158, the KIR family of receptors [killer-cell Ig-like receptors]). In the last HLAD (2004) workshop 95 new designations were added (11).
![]() Principles and Instrumentation
Principles and Instrumentation
Fluidics
For reliable analysis, the specimen must be a monodisperse suspension. Failure to meet this requirement results in technical inaccuracies and causes blocking of the flow. From a reservoir, isotonic fluid under pressure is forced into a tubing that delivers it to the flow cell. The flow cell is called by some the “heart of the flow cytometer.” The isotonic fluid within the flow cell generates a fluid column with laminar flow and a high flow rate known as sheath fluid. The sample is introduced in the flow cell by a computer-driven syringe in the center of the sheath fluid, thus creating a coaxial stream within a stream, the sample core stream, with no mixing of the sheath and sample streams. The pressure of the sheath stream hydrodynamically aligns the cells so that they are presented to the light beam in single file (i.e., one at a time). The cells trigger the scattering of the light and, at the same time, are excited by the beam and emit fluorescent light. As the flow cell narrows, the velocity of the fluid increases and the diameter of the sample stream decreases to a very narrow cross section of the approximate size of the cells being measured. The velocity of the core stream is controlled by the sheath pressure, and its diameter is controlled by both the sheath pressure and the volumetric sample delivery rate. Resolution and sensitivity depend on both of these parameters, and their control is paramount for good analysis. Resolution is expressed as the coefficient of variation or CV (i.e., the relative standard deviation of the signal produced by identical cells or particles). Sensitivity, on the other hand, is a product of the intensity of the excitation, which is determined by the time spent by the cell in the excitation focus (which depends on the flow velocity) and the shape of the laser beam. Resolution is a function of the diameter of the sample core, whereas sensitivity changes with its velocity. Under constant sheath pressure, increasing the sample delivery increases the core diameter, resulting in poor resolution. Under constant sample delivery rate, an increase in the sheath pressure results in an increase of the velocity of the sample, which decreases the sensitivity.
|
|
|
Figure 2.1. Production of hybridomas. Ab, antibody; Ig, immunoglobulin; PEG, polyethylene glycol. |
Light Source and Light Beam
Sensitivity and resolution depend on the shape and intensity of the laser beam. The diameter of the beam is approximately 650 μm, but it is narrowed by two cylindric lenses that reduce the dimensions significantly. The first lens (vertical) results in an elliptical beam with a longer vertical dimension (perpendicular to the axis of flow) and a shorter horizontal dimension (along the axis of flow). The second lens (horizontal) changes the beam so that its horizontal dimension is longer than the vertical. Lengthening the horizontal axis increases the resolution of the instrument as determined by the CV and the amount of light illuminating the particle. Shortening the axis enhances sensitivity because the intensity of light over the sample core stream is increased. Thus, depending on whether resolution is more important (DNA quantitation) than sensitivity (immunophenotyping, platelet counts), the horizontal axis should be kept longer or shorter, respectively. The vertical axis controls the discrimination between two closely spaced cells such as doublets. Cells can be close together as a result of clumping or a fast-running sample. In such samples, the beam should be as narrow vertically as possible. The particles intersect the beam within the flow cell (closed flow) or after they exit the flow cell (sense-in-air). At the intersection (interrogation point), two events take place: Light scattering and emission of fluorescent light, assuming that the particle is tagged by a fluorescent dye.
Signals: Collection and Sensors
Alignment is critical because the light intensity is higher at the center of the beam, and the particle should intersect the beam at its center.
Light Scattering
Light scattering is the result of laser light reflecting and refracting off the cells (12). Light scatter signals are used to set the threshold for separating platelets, erythrocytes, and debris from viable leukocytes. Light scattered along the axis of the beam is known as forward angle scatter (FS), and light scattered at greater angles is known as 90-degree light scatter or side scatter (SS). Light scattering is related to the intrinsic properties of the cell such as size and granularity. It is not necessary to treat the cells with any reagents. Extrinsic properties of the cell are those requiring the aid of external reagents to be revealed, such as DNA content with the use of fluorescent dyes.
The FS has been shown to be proportional to the size of the cell. Typically, FS is light scattered between 1 and 10 degrees. FS is very useful in discriminating between cells and debris of cells. Other properties of the cell besides size may influence FS, such as the index of refraction and the absorptive properties of the cell. The index of refraction is higher in fixed and stained cells. Discrimination between live and dead cells is better at lower angles (0.5- to 12.5-degree). Live cells scatter more light than apoptotic cells, and best separation occurs between angles of 0.5 and 12.5 degrees. The sensor for FS is usually placed beside the flow cell on the other side of the entry of the beam.
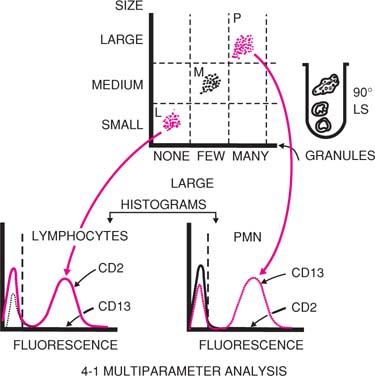
SS is due to light reflected from internal structures of the cell and correlates with granularity of the cell. The SS is collected together with the fluorescent light at right angles to the beam. The light collection optics and sensors for SS and fluorescence are described later in this chapter. As a result of differences in cell size and granularity, light scattering (FS and SS) separates blood cells into three major populations: Lymphocytes, monocytes, and granulocytes. In a two-parameter histogram (Fig. 2.2) of FS versus SS (when red blood cells have been lysed during sample preparation), we distinguish the three main leukocyte populations. For routine flow cytometric analysis of peripheral blood and bone marrow, this histogram can be used to gate for a particular cell population under study, or either one of these parameters could be used in combination with a fluorochrome (see below).
|
|
|
Figure 2.2. Analysis of human peripheral blood cells by flow cytometry. Blood cells are separated on the basis of their size, which scatters light in a forward direction, as well as on the basis of their granularity, which scatters light at a 90-degree angle (LS). Lymphocytes (L) (small and nongranular) occupy the lower left area of the screen; polymorphonuclear leukocytes (P) (large with many granules), the upper right. The monocytes (M) are detected in an intermediate position. Identification of these populations is achieved with monoclonal antibodies specific for markers present in one but not the other population. For example, the lymphocyte population shows strong fluorescence for the antibody to CD2 (a T-cell marker) (continuous line) but not for the CD13 (a myeloid cell marker) (interrupted line). The opposite is true for the polymorphonuclear neutrophil (PMN) population. The vertical interrupted line separates the background fluorescence (at left) from specific fluorescence (at right) in the histogram. |
Fluorescent Light: Multicolor Analysis
Certain dyes (fluorochromes) absorb the laser light and emit light at longer wavelengths. This is known as fluorescence. Various fluorochromes have distinct wavelengths for excitation (absorption of light) and emission. The flow cytometers used in clinical laboratories usually have two lasers; one is an argon ion laser that emits light at 488-nm wavelength (blue to blue-green). The argon laser is capable of exciting several commonly used fluorochromes and dyes. A second laser can include a helium-neon (633 nm), helium-cadmium (325 nm), or red diode laser (634 nm). With increase in laser power, the fluorescence signal increases (and thus sensitivity). However, with very high power, the signal to background difference may be reduced, and, thus, sensitivity is reduced. For the fluorochrome to be useful, the fluorescent wavelength must be longer than the excitation light (the difference is known as Stoke shift) so that it can be separated.
The light that is scattered at wide angles (SS) and the fluorescent light are collected together at right angles to the laser beam by a pickup lens/spatial filter assembly. Optical filters are used in a flow cytometer to separate the light collected into usable spectral components for the quantitation of the respective fluorescence or scatter signals. Two types of optical filters are used in FC: Absorption and interference filters. Absorption filters are usually made of colored glass. They absorb the unwanted light and pass the light with the desired wavelength. As a result of light absorption, these filters tend to fluoresce, especially after light absorption of short wavelengths. Interference filters attenuate or reflect the unwanted light. This is accomplished by depositing specific series of metals and dielectrics onto the substrate. There are five types of interference filters: The band pass, notch, long pass, short pass, and dichroic filters. The dichroic filters are designed to reflect a specific range of light wavelengths and to pass all others.
The individual components of light are separated using the appropriate combination of filters that pass light of a certain wavelength (long and short pass filters) and dichroic filters, which reflect some wavelengths while allowing others to pass. A dichroic filter at a 45-degree angle to the collected light path reflects the SS (488 nm) to the SS sensor while allowing the fluorescent light (higher wavelength) to pass. Subsequently, the light passes through a filter that absorbs any remaining 488-nm light that may have passed through the first dichroic filter. The fluorescent light is then separated successively by a series of dichroic filters. Each dichroic filter reflects to a sensor light of a certain wavelength while allowing the remaining light to pass to the next dichroic filter, and so on. By this method, the light is separated progressively into bands of increasing wavelength (yellow, green, red), which correspond to fluorochromes used to tag the cells.
The sensors convert the photons to electrical impulses that are proportional to the number of photons received, which in turn are proportional to the number of fluorochrome molecules bound to the cell. The fluorescent emissions are of low intensity and thus necessitate the use of photomultiplier (PMT) tubes to be detected. The PMT produces photoelectrons, which are released by the interaction of photons with the photocathode. The photoelectrons are accelerated onto the surface of a dynode through a voltage potential and successively release enough electrons to generate an electrical impulse.
Signal Processing
The electrical impulses are analog signals that are converted to digital signals with converters. The sensor may process either the brightest signal emitted from the cell or all signals, which measure total cell fluorescence. Electrical pulses are very weak and must be amplified either linearly or logarithmically.
The linear form of data presentation more accurately represents differences in fluorochrome concentrations between cells. In linear amplification, the output signal is directly proportional to the input signal. Each channel represents the same increment in signal value. Thus, a peak at channel 200 represents an intensity twice that of a histogram peak at channel 100. Histograms using linear amplification find applications in quantitation of fluorescence of DNA, RNA, and light scatter of cell size and granularity.
In logarithmic amplification, the output is proportional to the logarithm of the input pulse. This is important when we need to review cell populations that vary widely in their characteristics, such as cell-surface markers. Because the logarithmic amplification compresses a wide input range, populations with similar intensities cannot be resolved. Immunophenotyping is the most common application of logarithmic amplification.
The digitized data are stored either as histograms or as list mode. When data are collected as histograms, the abscissa represents a preassigned parameter (i.e., intensity of fluorescence), and the ordinate represents the number of cells analyzed. More widely used is the list-mode method of data collection. In this method, various parameters (e.g., scatter, fluorescence, and so forth) are stored as a list. The software then allows the data to be reanalyzed and presented as histograms. This form of analysis allows for the reprocessing of data, especially in complex specimens with heterogeneous cell populations.
An important aspect of FC is the selection of only a certain cell population for analysis. This is called gating and is done electronically. In other words, the software allows the selection of cells within a limited range of certain parameters to be analyzed. Gates are rectilinear, amorphous, or numeric. The amorphous are the most versatile because they can be of any shape or form and allow better selection of cells.
Cell Sorting
Some flow cytometers may physically separate the cells (sorting) based on differences of any measurable parameter. Sorting is achieved by droplet formation. The basic components of any sorter are a droplet generator, a droplet charging and deflecting system, a collection component, and the electronic circuitry for coordinating the timing and generation of droplet-charging pulses. Fundamentally, the flow chamber is attached to a piezoelectric crystal, which vibrates at a certain frequency so that when the fluid carrying the cells passes through the nozzle, forming a jet in air with a velocity of 15 m/second, the vibration causes the jet to break up in precisely uniform droplets, typically 30,000 to 40,000 per second. Each droplet, when separated from the jet, can be charged and then deflected by a steady electric field and is collected to a receptacle. Almost every cell is isolated in a separate droplet.
When a cell is analyzed and a decision for sorting is made, until the proper electrical charge pulse is applied to the droplet containing this cell, there is a transit time that is determined by several factors, such as flow velocity, droplet separation, and the cell preparation that sometimes may cause perturbations of the jet. Sophisticated circuitry coordinates all functions during this transit time so that the electrical charge pulse is applied to the selected droplet. If two cells are so close together in flow that they cannot be isolated, the sorting is aborted. Poor sample preparation may cause doublets or coincident cells that cannot be recognized as separate cells.
Fluorochromes and Conjugates
For a fluorochrome to be used in clinical practice, it must meet certain requirements. The light absorption spectrum should match the wavelength of the light emitted from the argon ion laser, which is 488 nm (Table 2.1). It should have a reasonably high extinction coefficient, a measure of the probability of absorbing a photon of light and therefore being “bright.” Extinction coefficients vary between fluorochromes. They should have a high quantum yield, a measure of the efficiency of the conversion of the absorbed light to emitted light. For example, the quantum yield of fluorescein is 0.50 (i.e., fluorescein has a probability of emitting one photon, on average, for two photons absorbed), whereas the quantum yield of R-phycoerythrin is 0.98 (i.e., it emits one photon for every photon absorbed). Because R-phycoerythrin also has a very high extinction coefficient (2 × 10⁶ L/mole·cm at maximum absorption) as compared to fluorescein (67,000 L/mole·cm), it is a much more sensitive fluorochrome. The fluorescence intensity from a fluorochrome is proportional to the product of the extinction coefficient and quantum yield. Other desirable properties are lack of interaction with cellular or biologic components and very little overlap with the spectrum of other fluorochromes to be used concomitantly. Fluorochromes that bind to organic matter give high background or nonspecific fluorescence, which sometimes may create problems in analysis of weakly fluorescent cells. For fluorochromes with spectral overlaps, a careful selection and appropriate filters minimize the problem. Furthermore, compensation (i.e., subtraction of signals [fluorescence] from detectors that are not supposed to detect this fluorochrome) minimizes the problem.
|
Table 2.1 Spectral Properties of Certain Fluorochromes |
||||||||||||||||||||||||||||||||||||||||||||||||||||||||||||||||
|
||||||||||||||||||||||||||||||||||||||||||||||||||||||||||||||||
The fluorochromes most commonly used for conjugation with monoclonal antibodies are as follows:
1. Fluorescein isothiocyanate (FITC) has a molecular weight of 389 d and an absorption maximum at 495 nm. With excitation by 488 nm, it emits fluorescence with a maximum around 520 nm. Three to five molecules of FITC are usually conjugated for each antibody molecule. Higher numbers result in fluorescence quenching, which occurs when fluorochromes are in close proximity and reduces the brightness of the labeled species. FITC is a popular fluorochrome because of its reasonably high extinction coefficient and quantum yield, its water solubility, and its emission at 515 to 520 nm, which can even be detected by the human eye. Among its disadvantages are its relative photoinstability, loss of fluorescence below a pH of 8, and its wavelength of excitation, which produces autofluorescence.
2. Phycoerythrin is a member of the natural dyes of phycobiliproteins, which derive from Cyanobacteria or red algae. In nature, it transfers light energy to chlorophyll during photosynthesis. It has a molecular weight of 240 kd (larger than the antibody molecule) with 34 phycoerythrobilin fluorochromes per molecule. Its absorption maximum is 564 nm, and its emission maximum is approximately 576 nm. R-phycoerythrin is more suitable than the B form because it is more efficiently excited at 488 nm. For conjugation to the antibody molecule, certain cross-linking groups are used. Phycobiliproteins are water soluble, fluorescent at neutral pH, and readily conjugated with antibodies and have high quantum yields.
3. Texas red is a sulfonyl chloride derivative of sulforhodamine 101 with a molecular weight of 605 d. It is a more soluble rhodamine derivative with an absorption maximum of 596 nm. Its emission maximum is 620 nm. In multicolor analysis using Texas red and phycoerythrin, it is recommended that a dual-laser flow cytometer be used.
4. Allophycocyanin is a member of the phycobiliprotein family. It has a 105-kd molecular weight and six phycocyanobilin chromophores per molecule, which are similar to phycoerythrobilin, the chromophore of phycoerythrin. Allophycocyanin absorbs maximally at 650 nm and emits at 660 nm. It can be excited by a dye laser or a helium-neon laser.
5. Peridinin-chlorophyll-a protein is a dinoflagellate protein, that can be excited at 488 nm, and emits light at >600 nm. It is easily bleached and can be used only by low-power bench-top instruments.
New fluorochromes are continuously introduced, such as Cas B and Cas Y excited by krypton lasers (407 nm), APC, the Alexa series (430 nm, 595 nm), and ECD (or Red 613nm). ECD has some overlap with PE channel but is brighter than Cy5PE.
Tandem fluorochromes are two fluorochromes covalently conjugated. Only one of them absorbs light at 488 nm from the argon ion laser that is most commonly used in single-laser flow cytometers. Energy from this fluorochrome is transferred to the second fluorochrome, which cannot be directly excited at 488 nm. This second fluorochrome, in turn, emits fluorescent light at a wavelength higher than that of the first one. For example, in a covalent conjugate of cyanin with phycoerythrin, 488-nm light excites phycoerythrin, which transfers the energy to the cyanin molecule. Cyanin, in turn, emits light at a longer wavelength than phycoerythrin (at 670 nm). The efficiency of energy transfer between the two fluorochromes is very effective, with <5% of the light absorbed by phycoerythrin being lost as fluorescence at 575 nm. These tandem fluorochromes allow the use of one argon ion laser (488 nm), and, thus, the need for dual lasers is eliminated. Tandem fluorochromes have opened the way for three-color fluorescence systems in combination with FITC and phycoerythrin using one laser light source. Texas red can also be conjugated to phycoerythrin, giving a tandem fluorochrome with an emission maximum above 600 nm.
Monoclonal antibodies with exquisite specificity are conjugated with fluorochromes. The structure recognized by the antibody is known as an epitope; any complex protein possesses several epitopes, and it is possible that several monoclonal antibodies produced against the same protein may detect different epitopes and give different results. These antibodies are recognized as being specific for a marker, but their binding may be different, and the number of cells detected may also differ.
Sensitivity of immunophenotyping depends on qualities of the monoclonal antibody, such as its specificity and affinity, and on the properties of the fluorochromes. Minimizing the background fluorescence by decreasing the nonspecific binding of the conjugates to the cells is mandatory. Nonspecific binding of the antibody is mediated through its Fc fragment and is especially prominent on cells expressing Fc receptors (natural killer cells, monocytes, neutrophils, B cells). Interaction of Fc receptors with Igs is non–species specific. Therefore, all monoclonal antibodies (usually mouse Igs) bind to human cells to different extents depending on their class. The nonspecific binding may be reduced by pretreating the samples with human plasma to saturate the Fc receptors with human Ig. Strong nonspecific binding can occur with samples containing malignant cells, such as lymphoma cells in lymph node preparations. Nonspecific binding may also be the result of conjugates with high dye-to-antibody ratio, which results in the formation of aggregates. Each antibody molecule has an optimum number of fluorochrome molecules that yields maximum fluorescence as a result of specific binding with minimum nonspecific binding. The size of the conjugate is also important, particularly with the phycobiliproteins. Conjugates with large size are insoluble. Thus, conjugation of phycoerythrin (240 kd) to IgM (900 kd) has not been successful.
Flow Cytometer Settings
In modern flow cytometers, basic features are not adjustable. However, a number of variables need to be set by the operator, such as setting the PMT sensitivity, the gains, selection of linear versus logarithmic amplification, color compensation, and so forth (13).
Increasing the voltage applied to the PMTs increases the sensitivity and the value of the signal collected. When the voltage changes, all populations change by the same number of channels; thus, there is no change in the relationship of two peaks or populations.
Changing the gain settings, however, alters the relationship of different populations. Increase of the gains spreads populations located close together farther apart. Although this may appear as an advantage, it is a disadvantage for certain populations with relatively bright fluorescence. It may push them to the maximum channel (i.e., 1,024 channel) and thus make them unable to be included in the analysis. At the maximum channel, the value measured is equal to or greater than the maximum.
Color compensation is required when two fluorochromes used have overlapping spectral properties. For example, FITC emits light over a wide range of wavelengths and thus is detected by other than the green PMT (i.e., the yellow and the red PMTs). Subtraction of the color detected by other than the green PMTs is known as color compensation. Compensation is usually done by compensation beads labeled by individual fluorochromes.
The voltages are set first with individual beads, followed by a run with all beads mixed. It is then determined whether the voltages are accurate.
Finally, it is important to set the thresholds, which exclude small-sized particles such as erythrocytes, platelets, and cell debris. Occasionally, debris with strong SS and weak FC signals is encountered, probably from disintegrated neutrophils.
Reporting Results
One method of reporting the results for specific subpopulations, such as CD4+ cells, is as a percentage of the total lymphocytes. This presupposes that lymphocytes can be well separated from monocytes by FC and SS. If the total CD3+ population can be determined, then the subpopulation can be reported as a percentage of that population. Most flow cytometers cannot provide absolute numbers because they do not measure fluid volumes. A computerized system has been used to report results in an attempt to obtain diagnostic and prognostic information in leukemias (14).
![]() Flow Cytometry in Hematology
Flow Cytometry in Hematology
Some common practical applications of FC in hematology are described briefly here. Detailed descriptions of these and other applications can be found in monographs (15,16,17).
Sample Preparation
For cell-surface marker analysis, the sample is incubated with the appropriate monoclonal antibodies, and the red blood cells are lysed with lysing reagents (several are commercially available; some also contain fixatives). Nonspecific binding of the monoclonal antibody is determined by a species- and isotype-matched Ig without antibody activity that is conjugated to the same fluorochrome. This control is set to exclude 98 to 99% of all cells. The data are usually collected in list mode. In a routine analysis, the first histogram displays the data of FS versus SS. In normal blood or bone marrow samples, three main leukocyte types are distinguished: Lymphocytes, monocytes, and granulocytes (Fig. 2.3). On simple inspection, this histogram also shows whether the sample is normal or abnormal. Appropriate gating (rectangular or amorphous) allows the analysis of the various populations. In the presence of one large population (as in cases of leukemias or lymphomas), detailed analysis is possible by selecting with small gates (“bitmaps”) cells that are small or large (FS) versus cells that are nongranular, moderately granular, or heavily granular (SS). Thus, a differential count based on “intrinsic” cell properties is achieved. Although in the majority of cases cell separation based on light scattering is adequate, to answer special questions, it is necessary to combine other approaches such as a combination of one light scatter parameter with fluorescent antibodies against a cell-surface marker. Frequently, CD45, a marker expressed by mature leukocytes, is used.
|
|
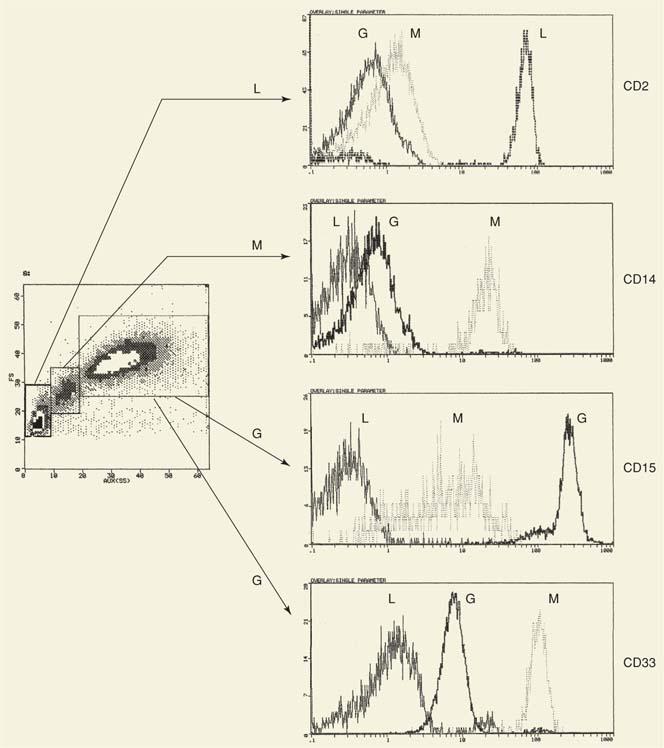
|
Figure 2.3. Two-parameter analysis (forward angle scatter vs. side scatter) of normal peripheral blood. Three populations are distinctly separated. These populations can be identified as lymphocytes (L), monocytes (M), and granulocytes (G) using lineage-specific (or associated) markers such as CD2 (lymphocytes), CD14 (monocytes), and CD15 and CD33 (granulocytes). Expression of CD15 is weaker in monocytes (vs. granulocytes) and varies widely among them (broad peak, i.e., large coefficient of variation). In contrast, expression of CD33 is stronger and more homogeneous (narrow peak, small coefficient of variation) in monocytes as compared with granulocytes. Thus, a marker not only identifies a cell simply as a result of its presence or absence, but also as a result of its intensity and heterogeneity of expression as defined by the coefficient of variation. The horizontal line separates the positive cells (to the right) from the negative (to the left). For comparison, each histogram to the right shows all three cell populations. |
Immunophenotyping
Normal Hematopoiesis
The development of monoclonal antibodies against cell-surface markers of blood cells and their conjugation with certain fluorochromes markedly contributed to the application of FC to the study of normal hematopoiesis. Multiparameter FC has been used for characterization of normal hematopoietic differentiation. The changes in the expression of lineage-specific or lineage-associated cell-surface and cytoplasmic markers provided data for the reconstruction of the differentiation pathways along distinct lineages. Uncommitted hematopoietic progenitors reside within the population of bone marrow cells that are strongly CD34+ and CD38-. CD38 is expressed in early progenitors with potential for lineage commitment as assessed functionally and by lineage-associated antigens (18).
This chapter provides a brief outline of the appearance of lineage-specific and lineage-associated markers detected by flow cytometry.
Lymphocytic Differentiation
B Lineage
Commitment to B-cell differentiation is indicated by the appearance of CD19 and CD10 (Chapter 15). Expression of CD19 is B cell specific, whereas CD10 is also expressed at the early stages of T-cell differentiation. Expression of CD34 and CD10 ceases by the time the cell expresses IgM on its surface. Appearance of surface IgM is also associated with other B-cell markers such as CD20, CD21, and CD22. B cells make up approximately 20% of peripheral blood lymphocytes, and the typical phenotype is CD19+, CD20+, CD21+, and CD22+. B-cell activation is associated with the reappearance of the CD10 marker in B cells of the germinal center. CD23 is also considered an activation marker. With further differentiation, expression of CD45 declines and disappears at the stage of plasma cell. Plasma cells may also lose expression of CD19, while at the same time becoming strongly positive for CD38. A phenotype CD45-/CD383+/CD138+/CD19- is the signature of a plasma cell.
T Lineage
Pre–T cells express CD34, CD7, and CD2 while still in the bone marrow. When these T-cell progenitors migrate to the thymus, the characteristic phenotype of the subcortical thymocyte develops in contact with thymic stroma. T cells in the subcapsular cortex are the most immature, and their phenotype is CD34+/CD2+/CD7+/CD4-/CD8- (“double negatives”). Coexpression of CD4 and CD8 with CD1 is detected in the next stage (“double positives”) (Chapter 16), followed by the gradual appearance of CD3 and the α/β T-cell receptors (TCR). Subsequently, the CD4+/CD8+thymocytes give rise to the single-positive CD4 and CD8 cells. The majority of peripheral blood lymphocytes (60 to 80%) are CD2+/CD3+/CD7+and express either CD4 or CD8. A small number are CD4-/CD8-, but these are not immature cells because they express the TCR. Recently a subpopulation of CD4+ T cells expressing strongly CD25 has been detected in human peripheral blood. These CD4+ CD25high T cells are regulatory T cells (see Chapter 16) that represent 1 to 2% of the total CD4+ T cells (19,20). Their function is related to maintenance of tolerance and loss or interference of their function is associated with the development of autoimmune diseases.
Erythroid Differentiation
On commitment to the erythroid lineage, CD71 appears on the cell surface with loss of CD34 and CD33 and decrease of CD45 (21). With further differentiation, expression of CD71 declines as the expression of glycophorin is up-regulated. CD45 disappears in the final stages.
Myeloid Differentiation
CD33 is one of the earliest antigens to appear (22). The CD34+/CD33+ cells can give rise to burst-forming erythroid unit and colony-forming unit granulocyte-monocyte. Immature myeloid cells become CD13+ followed by the appearance of CD15 and CD11b. Only at the final stages are CD16 and CD10 expressed. Granulocytes are strongly positive for CD15 and only weakly positive for CD33, with a heterogeneous distribution or large CV. CD13 and CD11b are of intermediate expression.
|
|
|
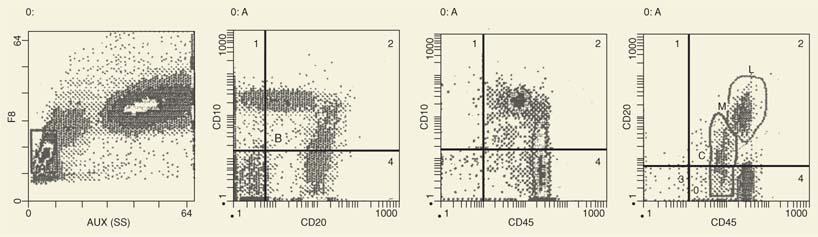
Figure 2.4. The patient had idiopathic thrombocytopenic purpura, and the bone marrow showed increased numbers of immature lymphoid cells (23%). By flow cytometry, these cells are CD10+. Some are CD10-, whereas the remaining cells express CD20. As CD10 expression declines, the expression of CD20 increases and merges with the cells, which are CD20+ but CD10-. This is a pattern characteristic of B-cell maturation. A similar pattern is shown with expression of CD45. SS, side scatter. |
In contrast, monocytes are strongly CD33+ (with small CV [i.e., homogeneous expression in the population]) but weakly CD15+ and CD4+. Expression of CD4 easily distinguishes monocytes from CD4+T cells. In the monocytes, expression of CD4 is weak with a large CV, whereas in the T cells, expression of CD4 is strong with a small CV.
Thus, intensity of fluorescence and CV are important parameters, in our experience, for cell identification. The signature phenotype for monocytes is CD33high, CV-small; CD15low, CV-large; CD4low, CV-large.
Immunophenotyping of Hematologic Malignancies
Markers specific for hematologic malignancies exist when a new protein is encoded by a gene resulting from the fusion of two normal genes (i.e., BCR/ABL). However, diagnosis by immunophenotype can still be accurately made by the usual leukocyte antigens and other proteins expressed on the cell surface (Ig light chains). It is based on the presence of a marker in numbers significantly larger than normal or on the presence of an aberrant phenotype resulting from (a) expression of a marker on a lineage on which it is not normally expressed, or (b) asynchronous antigen expression (i.e., presence of a marker at a stage of differentiation where it does not normally belong). Diagnosis based on large numbers of cells expressing a specific marker may lead to erroneous diagnoses. For example, common acute lymphocytic leukemia (ALL) antigen or CALLA (CD10) is also found on normal bone marrow B-cell progenitors as well as on peripheral B cells (germinal center), and even on cells from other lineages or nonhematopoietic cells. For a certain marker that normally is detected on a small number of cells, diagnosis of a condition that may suggest a proliferative process can be more accurately made if a second marker is used.
For example, the number of CD10+ cells in normal adult bone marrow is <5% of the lymphoid cells. Earlier, some investigators accepted a number of CD10+ cells >20 to 30% of the bone marrow cells as an abnormal finding suggestive or diagnostic of ALL. It has been shown, however, that in children with thrombocytopenic purpura, the number of CD10+ cells may be up to 60% in the absence of ALL (23). As shown in Figure 2.4, the bone marrow contains large numbers of CD10+ cells, which are heterogeneous in terms of expression of CD10, CD20, or CD45. Furthermore, with the decline of CD10 expression, the CD20 and CD45 density increases, which is evidence of maturation not seen with acute lymphoblastic leukemia. Therefore, high levels of one particular marker may not necessarily indicate a neoplastic disease. The same applies for the CD34 marker associated with immature hematopoietic cells.
More than the high percentage of a rare cell marker, it is the composite phenotype that should be considered. The association of CD34 with another marker not normally seen, such as CD7, CD4, or CD56, is more suggestive of a proliferative disorder (see Appendix). These very rare phenotypes confirm the diagnosis whether one accepts that leukemia is a “frozen window” of normal hematopoiesis, and therefore the cells with the unusual phenotype correspond to normally infrequent cells, or whether one believes that the phenotype is aberrant as a result of interlineage or intralineage “infidelity” indicative of misprogramming or illegitimate gene expression. These rare markers, however, have a very important application after diagnosis if they can be used as patient-specific probes for monitoring minimal residual disease. For example, the expression of CD56 on CD34+ blasts could be readily identified in 1 out of 104 blasts in 20% of cases of childhood acute myelogenous leukemia (AML) (24). In progenitor cells of chronic myelogenous leukemia in chronic, accelerated, and blastic phases, CD56 is again coexpressed with CD34 (25).
Despite these difficulties, immunophenotypic diagnosis of leukemia has increasingly become an indispensable tool in laboratories, although the morphologic diagnosis and classification still remain the indisputable standard for the study of patients with hematopoietic malignancies (26).
In the following situations, immunophenotyping is clearly important: (a) determination of lineage (myeloid vs. lymphoid) if it cannot be decided on the basis of morphology and cytochemistry, (b) distinction between B- and T-cell acute leukemias, (c) detection of mixed lineage leukemias, and (d) detection of monoclonality in B-cell lymphoproliferative disorders on the basis of expression of Ig light chains. The application of increasingly greater numbers of monoclonal antibodies allows a more precise classification and will make it possible to associate genetic subgroups with a distinct immunophenotype such as leukemias with t(8;21), and t(15;17) (27).
Light scattering can also provide useful information. Figure 2.5 shows representative examples of AML of the first four French/American/British (FAB) classifications, FAB M0 to M3. The light scattering histograms show gradual increase of SS from M0 to M3, indicative of the gradual increase in the granularity of the leukemic cells. Immunophenotyping reveals that expression of the stem cell marker (CD34) is retained even in some M2 leukemias. Furthermore, the M2 group is immunophenotypically heterogeneous in the expression of other markers, such as CD4. The significance of these immunophenotypic findings remains to be determined. As new monoclonal antibodies become available, discovery of new markers further facilitate precise identification of cell lineage. A C-type lectinlike protein has been detected only on AML cells, and not on normal CD34+/CD38- or CD34+/CD33- stem cells (28). Furthermore, it identifies myeloid lineage since it is detected on 67% of CD33-AML cases.
|
|
|
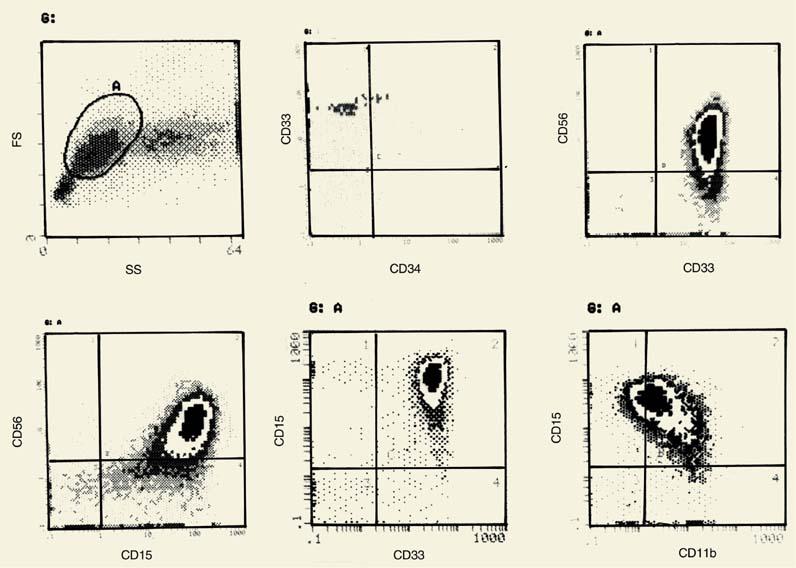
Figure 2.5. Light scatter histograms and the phenotype are shown using the main myeloid markers with examples from the four French/ American/British (M0 to M3) classes of acute myelogenous leukemia. The phenotype refers to the main cell population (A) in each forward angle scatter (FS) versus side scatter (SS) histogram. Numbers are percentages. |
Immunophenotypic analysis of acute leukemias allows the identification of mixed lineage leukemias. Figure 2.6 shows the phenotype of a patient with AML-FAB M1 with the aberrant expression of CD2 and CD7. Rare forms of leukemia can only be identified by analysis of cell-surface markers. Figure 2.7 shows the phenotype of a case of ALL of B lineage with the expression of CD2. This case of biphenotypic leukemia reveals the existence of common lymphoid precursors that have also been detected in fetal liver (29) (see below). Immunophenotyping has advanced our understanding of the origin of acute leukemias, but the impact on various clinical aspects, such as prognosis and therapy, still needs to be better evaluated.
The use of three or more monoclonal antibodies permits a more precise identification of the phenotype of a cell population. This is particularly important when a marker is expressed not only on the leukemic cells, but also on normal cells. For example, CD33 is expressed on all stages of myeloid differentiation. Gating on the basis of light scattering, which excludes the most granular (and, therefore, the most mature) cells, is not sufficient. Combination of CD33 with CD34 identifies the most immature cells (those likely to represent the leukemic blasts), and their identification may further be improved with the addition of a third marker such as CD4, CD7, or HLA-DR, which have now been identified as markers of primitive hematopoietic progenitors (stem cells) (30,31). The use of CD45 with a combination of two other monoclonal antibodies further facilitates the identification of blasts because it is known that CD45 is either lacking or expressed only weakly in the most immature hematopoietic cells and increases in density with maturation (33,34).
|
|
|
Figure 2.6. Phenotype of bone marrow cells from a patient with acute myelogenous leukemia (French/American/British M1). The bone marrow contains one main population (98%) of cells that are heterogeneous in size, and only the larger cells are slightly granular. These cells show distinct evidence of myeloid differentiation and the coexpression of two lymphoid (T-cell) markers, CD2 and CD7. Although CD7 may be accepted here as a stem cell marker, the expression of CD2 is certainly aberrant. TCR, T-cell receptor. |
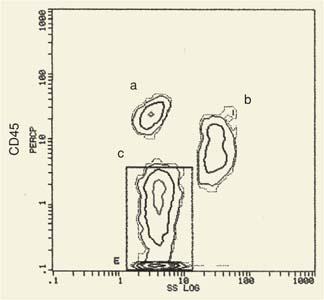
In Figure 2.8A, the blasts from a case of ALL show weak expression of CD45. The presence of relatively large numbers of CD10+ cells after treatment may indicate residual disease or bone marrow regeneration. A combination of CD10 with CD45 in this case reveals that, in contrast to the diagnostic pattern, CD10 expression is heterogeneous, and, as CD10 is down-regulated, expression of CD45 is up-regulated, suggesting bone marrow regeneration (Fig. 2.8B). A two-parameter histogram of CD45 versus SS (Fig. 2.9) allows the selection of all immature cells that are low in CD45 and that are also low in SS because they lack granularity.
|
|
|
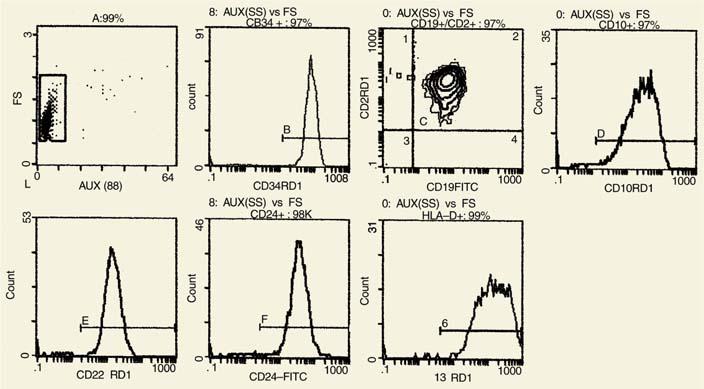
Figure 2.7. The phenotype of a case of acute lymphocytic leukemia that shows the expression of CD2 on all blasts. Mixed lineage leukemias can only be identified by immunophenotyping. The clinical significance of such cases remains to be evaluated. FITC, fluorescein isothiocyanate; FS, forward angle scatter; SS, side scatter. |
The combination of two to three monoclonal antibodies may be used for the detection of residual disease. Combinations of monoclonal antibodies must be used cautiously because, for certain markers, the presence of one antibody may interfere with the detection of another, probably on the basis of steric hindrance.
Evaluation of the density of a specific marker has been attempted to determine whether it can be used as a prognostic indicator. Quantitative variation of CD10 in ALL has been demonstrated (35). Patients with levels of CD10 less than the median of the CD10+ group had a higher rate of failure. Overexpression of CD10 suggested the diagnosis of ALL even with low CD10+ numbers. Different CD10 levels were associated with different chromosomal abnormalities; for example, high CD10 levels were associated with hyperdiploid cells and low CD10 levels with the t(4;11) translocation. Quantitative ratios of two markers may also be used to identify stage of differentiation. Parallel quantification of CD24 and CD45 allows identification of B-cell differentiation stage and may also be relevant clinically (36). High CD24 and low CD45 values are found in ALL, and, in these patients, low CD24-to-CD45 ratios were associated with a good prognosis.
Acute Lymphocytic Leukemia
Immunophenotyping of cases of ALL is a very important application of FC and provides an easy and definite diagnosis and a distinction between precursor B-cell ALL (B-ALL) and T-cell ALL (T-ALL) (37).
Precursor B-cell Acute Lymphocytic Leukemia
Diagnosis of ALL in children by FC is based primarily on the expression of CD34, CD19, HLA-DR, and CD10. Expression of CD45 (low or negative) and CD24 (strong) is particularly useful not only at diagnosis but also during the follow-up period of bone marrow regeneration for detection of residual disease. From an earlier study, 69% of the cases are CD34+ and 75% are CD10+ (38). In our experience, the combination of CD45, CD34, CD10, and CD24 is particularly useful in two-parameter histograms for the identification of normal B blasts of regenerating cells versus leukemic blasts.
|
|
|
Figure 2.8. A two-parameter histogram, CD10 and CD45, identifies two different populations of CD10+ cells. A: CD10+ blasts from a patient with acute lymphocytic leukemia show no or little coexpression of CD45. B: CD10+ cells after chemotherapy show progressive increase of CD45 as CD10 is down-regulated. These cells are normal, regenerating CD10+ cells. |
Other B-lineage–specific markers are cytoplasmic detection of CD79a (mb1) (39), CD22, and terminal deoxynucleotidyl transferase (TdT). Monoclonal antibodies specific for the V–pre-B and λ5subunits of the pre-BCR reacted with cells in 53 of 56 cases classified as non–B- non–T-ALL, thus identifying them as B-cell ALL (40). In a small number of cases, CD2 is coexpressed with other B-cell markers (41). CD2+ B-cell precursors have been identified in fetal life (29). These leukemias may represent malignancies derived from such an early B-lymphocytic precursor. 1 to 2% of B-ALL in children express surface Ig absence of CD34 and TdT, with some expressing an L3 morphology. These are now more appropriately termed Burkitt leukemias.
T-cell Acute Lymphocytic Leukemia
T-cell ALL comprises 15 to 20% of childhood ALL. The phenotype of T-ALL corresponds to early stages of T-cell differentiation within the thymus. Cases corresponding to stage I of T-cell differentiation are CD34+/CD7+/CD2+, and some of them are also CD10+. This phenotype corresponds to the pre–T cell, a precursor detected in the bone marrow. More mature phenotypes are characterized by lack of CD34 and CD10, and, through a transitional stage, which is negative for CD4 and CD8 (stage II), the cell normally becomes double positive (i.e., CD4+/CD8+ and CD1+) (stage III). The cells are also TdT positive. Expression of cytoplasmic CD3 is specific for T-cell lineage. Expression of several T-cell markers may not be detected (i.e., CD2, CD4, or CD8). CD7 is the most important marker for T-ALL, but, in our experience, it is the composite phenotype that is important for diagnosis. It has been suggested that diagnosis of T-ALL should not be made in the absence of CD7 expression (37).
|
|
|
Figure 2.9. A two-parameter histogram (CD45 vs. side scatter [SS]) shows the presence of cells with low CD45 expression and low SS, which represent immature cells from a patient with acute leukemia. The ungated histogram clearly shows three main populations: (a) small numbers of cells with strong CD45 expression and low SS (lymphocytes); (b) high to intermediate CD45 expression and high SS (granulocytes); and (c) low SS with decreasing expression of CD45. These are immature cells, and gating can be used to determine their phenotype. |
Acute Myelogenous Leukemia
Markers useful for the diagnosis and classification of AML are CD34, CD117, CD33, CD13, CD15, CD4, CD11b, HLA-DR, and cytoplasmic myeloperoxidase. Immunophenotyping contributes to diagnosis in cases that are difficult to diagnose morphologically.
Acute Myelogenous Leukemia with Minimal Myeloid Differentiation
The cells are agranular and show low FS and SS. They strongly express CD34, HLA-DR, and usually CD38 and CD117 (c-kit), as well as CD33, CD13, or both (42).
Acute Myelogenous Leukemia without Maturation
The blasts have low FS and SS, they are CD45+ and HLA-DR+, and a high proportion of them are CD38+ and CD117+. Antigens associated with more mature stages of myeloid differentiation (i.e., CD15, CD11b, CD16) are not expressed. A minimum of 3% of blasts demonstrate expression of myeloperoxidase.
Acute Myelogenous Leukemia with Granulocyte Differentiation
Maturation at least to the level of promyelocytes and myelocytes is evident. The cells show a stronger SS pattern, and CD45 is moderately to weakly positive, whereas HLA-DR is negative. If there are small numbers of immature cells, they can be separated by their FS/SS properties with or without CD45 combination from the more mature leukemic cells. CD33 expression decreases as more mature markers gain in intensity (i.e., CD15, CD11b). Intracellular myeloperoxidase is strong.
Acute Myelogenous Leukemia with Monocytic Differentiation
In the monocytic type of AML, the blasts are large with strong FS signal. They are strongly CD33+ and express CD13 and HLA-DR. They are usually negative for CD34, CD117, and CD11b. CD64 and CD14 are monocytic-related markers and may help in diagnosis, as does expression of CD4.
In the myelomonocytic type of leukemia, markers of immature cells often are negative. The typical phenotype is expression of CD33, CD13, CD11b, CD4, and HLA-DR.
Megakaryoblastic Leukemia
The blasts are positive for CD41 (αIIb) and CD61 (β3), which are the α- and β-chains, respectively, of integrin αIIb/β3, one of the main platelet integrins.
Acute Myelogenous Leukemia with Recurrent Genetic Abnormalities
In a group of AMLs, there are certain genetic abnormalities that recur regularly. These forms of AML often have a high rate of complete remission and favorable prognosis.
Most commonly identified abnormalities are reciprocal translocations: t(8;21), inv (16) or t(16;16), t(15;17).
Acute Myelogenous Leukemia: t(8;21)(q22;q22), RUNXI/RUNXITI
In some patients (diagnosed as M2 AML by the FAB classification), there is a translocation t(8;21)(q22;q22), one of the most common karyotypic abnormalities in AML. The blast cells in these cases are CD34+ CD19+ and HLA-DR+ and express weakly CD13 and CD33 (43). CD56 is often expressed but not as often as CD19. The nonblastic cells have a more mature phenotype (i.e., CD11+/CD15+) without immature markers.
In AML with a similar translocation in children, CD19 was detected in 81% of the cases and CD56 in 63% (44). The CD19/CD56 markers are coexpressed. This translocation involves the RUNXI (AML1) gene at 21q22 and RUNXITI (ETO) in 8q22.
Acute Promyelocytic Leukemia (AML t(15;17))(q22;q12))
Acute promyelocytic leukemia (APL) is diagnosed in <10% of all AML cases. A variant of APL is known as microgranular M3 (or hypogranular) because the granulation is significantly less than in the traditional M3. Accurate diagnosis of APL is important because of the danger of potentially fatal disseminated intravascular coagulation, which can be initiated by procoagulants contained in the granules. Background fluorescence is high, probably as a result of proteins associated with the granules.
In APL, the CD33 expression is strong, whereas CD13 is heterogeneous. The early myeloid markers, CD34 and HLA-DR, are usually negative, as well as the mature marker CD15. Frequently, there is coexpression of CD2 or CD19.
CD7+ Leukemia
Leukemias positive for CD7 but negative for CD4/CD8 were identified as hematopoietic malignancies involving immature cells (45). Subsequently, CD7 expression was identified in patients with classical AML phenotype (46). CD7 expression was detected in cases of undifferentiated cells with only CD13+ expression (47), and in rare cases CD7 is the only marker.
It is now clear that CD7 is a marker of very primitive hematopoietic precursors detected during the stages of liver hematopoiesis (48) and on normal human myeloid progenitors (30,49,50), as well as on B-lineage precursors (51). Cell lines derived from fetal bone marrow B-cell precursors transformed by the Epstein-Barr virus express CD7 and correspond to the pre-B or early B stage of differentiation (52).
Down Syndrome
Children with Down syndrome have an increased incidence of acute leukemia, commonly AML (10 to 20 times that of the general population). Some patients, however, develop myeloproliferation that resembles leukemia and undergoes spontaneous durable remission (53). A unique myelodysplastic syndrome referred to as transient abnormal myelopoiesis (TAM) has been reported in children with Down syndrome. The phenotypic characteristic of TAM is the expression of platelet-associated antigens, CD9, CD36, CD41, and CD42 (54). In some cases, CD33 and HLA-DR or CD3 and CD7 are also detected, whereas the TCRB is clonally rearranged (55). TAM sometimes meet criteria for acute megakaryocytic leukemia. The phenotype is frequently mixed with expression of megakaryocytic/platelet myeloid or T-cell markers. The abnormality in TAM seems to involve a multilineage precursor (56).
|
|
|
Figure 2.10. A two-parameter histogram of peripheral blood from a patient with B-cell chronic lymphocytic leukemia. A: At the time of diagnosis, all cells are CD5+/CD19+. B: Four months after treatment, a very small number of CD5+/CD19+ cells still remains. |
Myelodysplastic Syndrome
The FAB classification proposes five subgroups of myelodysplastic syndrome (MDS) based on the percentage of blasts in the bone marrow. A scoring algorithm has been proposed for more accurate diagnosis, based on a method by flow cytometry. This score is based on measurements of side scatter of peripheral blood neutrophils (low) and expression of CD66 and CD11a (higher) than the controls. Expression of CD116 and CD10 on neutrophils is also taken into account. The score is much more sensitive for diagnosis with 73% sensitivity and 90% specificity (57). Flow cytometry provides a reliable method for diagnosis of sideroblastic anemia based on high expression of cytosolic H-ferritin and CD105, combined with low expression of CD71 (58). Blasts harvested from high-risk patients with MD5 (i.e., having refractory anemia with excess blasts [RAEB] or RAEB in transformation) are positive for immature markers, CD7, and CD117, and the expression of CD7 is an independent variable with poor prognosis (59). Aberrant expression of various antigens on CD34+ cells in low-grade MDS without ringed sideroblasts helps in the diagnosis, which is morphologically difficult (60). As the number of immature cells increases, they express CD95 and CD95 ligand and become less susceptible to apoptosis (61).
Lymphoproliferative Disorders
FC contributes significantly to the study of lymphoproliferative disorders through (a) identification of clonality and (b) identification of cell lineage (62,63). Clonality for B cells requires the demonstration of light-chain restriction if surface Ig is expressed. A panel of lineage-specific antibodies provides the answer to the question of cell lineage.
B-cell Chronic Lymphocytic Leukemia
In B-cell chronic lymphocytic leukemia (B-CLL), there are two important and characteristic markers in the majority of the cases (i.e., CD5 and CD23), usually used in combination with CD19 (to exclude T-cell lineage). CD23 expression differentiates B-CLL from mantle cell lymphoma. The combination of CD5/CD23 could also be used for easy identification of residual disease. As shown in Figure 2.10A, all cells are CD5+/CD19+ at diagnosis. These cells are monoclonal, as shown in Figure 2.11, because they express only κ light chains. During therapy, however, residual leukemic cells can be detected easily by FC. As shown in Figure 2.10B, the majority of the cells in this patient are normal T cells (i.e., CD5+/CD19-). However, a small cluster of cells with the CD5+/CD19+ cells located in the same position as the leukemic cells at diagnosis indicates residual disease. The antibody FMC-7 is useful for identification of prolymphocytic leukemia or prolymphocytoid changes of B-CLL. The term prolymphocytoid transformation has been applied to cases of CLL with increased numbers of nucleolated lymphocytes (64). Increased numbers of FMC-7+ cells are sometimes noted in patients with B-CLL in the absence of morphologic changes of prolymphocytic leukemia. It appears that immunologic changes are regulated independent of morphology. In 78 cases of B-CLL with atypical phenotypes, 61% showed increased FMC-7 expression (64).
|
|
|
Figure 2.11. Two-parameter histogram (λ vs. κ) identifies a monoclonal population of B cells from a patient with B-cell chronic lymphocytic leukemia. There are no λ+ cells. The small number of cells weakly coexpressing λ-chains together with strong κ expression is likely due to artifacts (passive immunoglobulin adsorption or nonspecific binding of the anti-λ monoclonal antibody). |
Somatic mutations of the CD79b gene in patients with B-CLL affect the expression of its protein (65). CD79b is one of the chains that, together with CD79a, form the coreceptor for surface Ig. Surface Ig is not expressed in the absence of the coreceptor. This may explain the fact that (membrane) mIg expression is markedly decreased or even undetectable in B-CLL. Expression of CD11c in B-CLL is somewhat controversial and may indicate variants of B-CLL, as is the case with FMC-7 (66,67). Recently, the expression of CD38 in B-CLL has raised significant discussion about whether it can be used as a prognostic factor and whether it identifies a group of patients in whom Ig VH genes in the B cell have undergone somatic hypermutation. It was first reported that patients with high percentages of CD38+ cells had V genes that were unmutated (68) and that these patients had a more aggressive form of disease (69). The majority of the reports consider CD38 expression as a predictor of poor clinical outcome and an important prognostic marker (70,71,72,73,74). High levels of CD38 and unmutated genes predicted shorter survival (69,75). Others pointed out that p53 dysfunction has predictive value and all CD38+ patients had p53 dysfunction, but the two are not associated (76). Another prognostic marker for B-CLL has recently been added to the list (i.e., expression of ZAP-70) (77).
Patients with high ZAP-70 have a shorter time to disease progression (p = 0.0005) and a more advanced clinical stage (p = 0.0018) as compared to patients with low ZAP-70 levels.
In a multivariate analysis of prognostic factors in B-CLL, deletion of chromosome 11q23, atypical morphology, and more than 30% CD38+ cells are associated with the presence of unmutated Ig VH genes and poor prognosis (78). CD27 has been shown to be expressed in normal memory B cells, which carry somatically mutated Ig VH genes (79). CD27 is also expressed in B-CLL (80), but whether CD27 in B-CLL is associated with mutated genes has not been examined.
High-grade lymphoma developing in patients with B-CLL is known as Richter transformation or Richter syndrome lymphoma. It is considered to be clonally related to, or evolving from, the original B-CLL clone, but phenotypically, the cells are usually CD5- (81).
Hairy Cell Leukemia
Hairy cell leukemia shows a unique phenotype with characteristic expression of CD103, the αE-chain, which forms a heterodimer with the β7-chain. Expression of the integrin αEβ7 is important for homing of lymphocytes to the Peyer patches. A small subpopulation of B cells expresses αEβ7. CD11c may not be unique to hairy cell leukemia, but its expression is strong. The hairy cell leukemia cells are CD5-/CD23- and express CD25 (Fig. 2.12).
Mantle Cell Lymphoma
Mantle cell lymphoma has a characteristic genetic marker as well as an immunophenotype. In our experience and in that of others (83), FC has shown that the distinguishing phenotype is CD5+/CD23-. CD10 distinguishes mantle cell lymphoma (CD10-) from follicular cell lymphoma (CD10+).
Marginal Cell Lymphoma
The majority of the B cells in the marginal zone of the spleen are memory B cells (both T-dependent and T-independent specific for type I antigens). The marginal zone of the lymph node is a rim of lymphocytes located in the outer zone of the mantle of the secondary lymphoid follicles. Marginal zone B cells are larger than naïve B cells and express high levels of IgM. These lymphocytes are negative for CD5, CD23, and CD10, which differentiate marginal lymphoma from other B-cell lymphomas (84). The marginal zone B cells are hypermutated, indicative of their postfollicular center nature (85). A B cell known as monocytoid B cell is detected in large numbers in Hodgkin disease and in lymphadenopathies caused by Toxoplasma gondii. It has the same phenotype as the marginal zone B cell but has not undergone mutations (i.e., is a naïve B cell) (86).
Follicular Cell Lymphoma
Follicular lymphoma (FL) is characterized by the t(14;18)(q32;q21) translocation. The BCL2 oncogene at chromosome 18q21 is juxtaposed to the Ig heavy-chain gene locus at 14q32. As a result of the translocation, the BCL2 is deregulated (87). The phenotype that distinguishes FL from other B-cell lymphomas in the majority of cases is CD10+/CD5-/CD23-. A combination of CD10 with antibodies to light chains provides evidence of monoclonality. A variant of FL known as floral FL has been shown to express CD5 (88).
Burkitt Lymphoma
In addition to the usual markers associated with B cells, the tumor cells are CD10+ and (surface) sIgM+.
Peripheral T-cell Lymphoma
The usefulness of FC in T-cell proliferative diseases is to confirm the nature of the lineage. Clonality markers for T cells, equivalent to light chains on B cells, do not exist (89). Clonality may be suspected by phenotypic abnormalities of major T-cell markers such as CD4, CD8, or both. For example, expression by all cells of only one of these markers instead of the normal ratio or the expression of both on the same cell is strong evidence of an “abnormal” population. Lack of CD7 is suggestive of malignancy but is not conclusive. In adult T-cell leukemia/lymphoma (human T-cell leukemia virus type 1 infection), CD25 is expressed in high levels.
In a study of 50 cases of peripheral T-cell lymphomas, one to five aberrations were detected in 92% of the cases. Abnormal expressions most frequently involved CD3 (66%), followed by CD7 (58%) (74). Unique expressions of a particular marker in other T-cell lymphoproliferative diseases include CD30 (large cell lymphoma, cutaneous or noncutaneous) and CD4 in Sézary syndrome.
However, immunophenotyping is only contributory to the diagnosis. A rare T-cell lymphoma, known as hepatosplenic T-cell lymphoma, is usually a malignancy of the γδ T cells and is CD4-/CD8-/ CD16+(90).
|
|
|
Figure 2.12. The phenotype of hairy cell leukemia differs from the phenotype of chronic lymphocytic leukemia in several aspects. The hairy cell leukemia cell is CD5-/CD23-, and it is positive for CD11c, CD25, and CD103. CD103 is the αE (E for epithelial associated) of the αEβ7 integrin. αEβ7 binds to E-cadherin on epithelial cells and is important for homing of lymphocytes to intestinal epithelia. APC, allophycocyanin; FITC, fluorescein isothiocyanate; PerCP, peridinin-chlorophyll-a protein. (Courtesy Dr. Carmen Morales.) |
Staging of B-cell Lymphoma
The standard practice for determining the stage of non-Hodgkin lymphoma is the morphologic examination of bone marrow. Results from the application of FC for this purpose remain controversial. One study questioned the usefulness of FC because in only 3 of 273 samples did FC improve the diagnosis, and two of these cases were morphologically suspicious (91). Considering the cost difference between FC and morphologic examination of bone marrow, FC does not offer significant advantages (92). In this study, FC on peripheral blood provided results that were as good as those from the bone marrow. On the other hand, FC was found to be superior to morphology in patients with low bone marrow involvement because the morphologic evaluation can detect only cases with >5% bone marrow involvement. These results need to be re-evaluated with larger numbers (93). It is likely that improvements in the protocols for FC evaluation are needed, as shown by another study in which CD19-based gating was successfully used to detect light-chain restriction (94). Although morphology and FC provided concordant results in 82% of the cases, all 18 samples were positive by FC except for one with discrepant results.
Minimal Residual Disease by Flow Cytometry
It is well known that, in patients with complete remission as shown by morphology, relapses frequently occur due to persistence of small numbers of leukemic cells that remain undetectable by morphology or cytochemistry (95). Several reports in the literature regarding the feasibility of FC for detection of minimal residual disease show a disappointing level of agreement. Some of the reasons are methodology, differences in interpretation, and, more specifically, the inability to identify clonogenic cells by immunophenotyping (95,96,97,98). There is also no consistency among centers in identification of leukemia-associated phenotypes. Expression of myeloid-associated antigens in ALL and lymphoid-associated antigens in AML varies greatly (i.e., 7 to 54% in the former case and 4 to 60% in the latter) (96). Another possibility is that the expression of lymphoid markers such as CD7, CD4, and CD2 in cases of AML is not, strictly speaking, an aberration, but rather leukemias arising from progenitors expressing these markers normally, as has been shown for CD7 and CD4. However, in some cases in which a “leukemic phenotype” can be confirmed, FC is a convenient method to detect rare leukemic cells. Asynchronous antigen expression is useful when two markers are normally well separated by their expression at distinct maturational stages but are coexpressed in the leukemic cell, such as CD34 and CD20 in B-ALL (38). This particular combination does not apply to all cases because only 38% of B-ALLs are CD20+ (38). In our experience with certain markers, their density and, therefore, intensity of fluorescence are strikingly higher in the leukemic population as compared to normal. For example, intensity of CD24 expression is much stronger in B-ALL blasts than in normal pre–B cells. In combination with CD10, the CD10+/CD24+ blasts are in a unique position on the histogram, well separated from CD10+/CD24+ normal B cells during bone marrow regeneration (unpublished observations). Fluorescence intensity has been used successfully to identify leukemic cells in B-ALL, and the leukemic nature of these cells was confirmed by polymerase chain reaction for Ig heavy-chain gene rearrangements (99).
In general, in spite of methodologic differences, FC is sensitive enough to detect small numbers of leukemic cells. Among 53 ALL patients, persistence of gradual increase of the number of leukemic cells in the bone marrow is associated with a higher incidence of relapse (90% vs. 22%) and a shorter disease-free survival (median of 12 months vs. not reached) (98).
Detection of minimal residual disease by FC requires carefully controlled technique, proper marker protocols, and significant expertise for definition of the leukemic phenotype at diagnosis, and the interpreter must be able to later identify this phenotype on rare residual leukemic cells.
Platelet Function
FC offers distinct advantages in the study of platelet activation in whole blood with minimal manipulation (100). Platelet activation is detected by antibodies specific for epitopes exposed after granule secretion (i.e., P selectin) or ligand binding. Ligands induce conformational changes to their receptors; fibrinogen, for example, induces conformational changes to its receptor GPIIb/IIIa (CD41/CD61) integrin (101). In either case, these activation- specific antibodies do not react with resting platelets. Antibodies against the GPIb-IX-V complex (CD42a, α, β), the receptor for von Willebrand factor, bind to resting platelets and only very weakly to activated platelets (102). On activation, there are changes in the size and granularity of platelets as reflected in the reduction of forward light scatter (size) and granularity (SS). Because activation of platelets may occur during preparation for FC, samples need to be handled with specific procedures and inhibitory compounds.
As a result of activation, intracellular Ca2+ increases rapidly, and binding of free intracellular Ca2+ to an indicator dye increases the intensity in green wavelengths and decreases wavelengths in the red range. The ratio between the two intensities gives the relative Ca2+ concentration (103). Microparticles frequently overlap with nonspecific background or “electronic” noise but technically may be separated with the use of an antiplatelet antibody and linear SS.
In thrombocytopenia patients, FC helps to determine whether the low platelet count is the result of accelerated destruction or decreased production. With normal bone marrow capacity, loss of platelets triggers compensatory platelet production. Newly released platelets are larger and contain RNA, which can be detected by thiazole orange (reticulated platelets) (104). Diagnosis of idiopathic thrombocytopenic purpura by detecting platelet-bound IgG is difficult because Ig bound to platelets is found in other conditions and because platelets have Fc receptors that may carry normal Ig (105).
Interaction of platelets with leukocytes is increased in inflammatory conditions and has also been detected in cardiopulmonary bypass and acute coronary syndrome. Such interactions are easily detected by FC because the “cluster” has the scatter properties of leukocytes that bear both leukocyte- and platelet-specific markers (106).
Platelet studies by FC have been used in clinical conditions, such as Glanzmann thrombasthenia, to demonstrate the degree of lack of GPIIb/IIIa on the cell surface (see Appendix for CDs, CD41 and CD61). In family members who may be heterozygotes, FC has the advantage of determining the subpopulation of platelets with lack of GPIIb/IIIa. Newly formed platelets are characterized by a high RNA content, which gives to platelets a reticulated appearance, and their measurement can be used to determine platelet turnover. Reticulated platelets are identified with thiazole orange that binds to intracellular RNA. Evaluation of platelet turnover by FC has been used in hematologic malignancies during aplasia induced by chemotherapy (107). It was found that measurement of circulating reticulated platelets has been useful in identifying patients who are likely to have posttherapy bone marrow regeneration as compared to those with persistent aplasia. Measurement of reticulated platelets by flow cytometry has also been used in other clinical conditions such as hepatic cirrhosis and lupus erythematosus. It can also be used for studies of the underlying mechanism of thrombocytopenia in general.
Erythropoiesis and Red Blood Cell Disorders
Reticulocytes can be differentiated from mature red blood cells on the basis of their RNA content, using thiazole orange. Analysis of data requires discrimination from mature red blood cells and platelets (108). The intensity of green fluorescence provides accurate estimates if the “discriminator” value is set appropriately to exclude fluorescence of mature erythrocytes. The threshold level, or discriminator, is set from normal blood with known reticulocyte values. The fluorescence increases on binding to RNA, with thiazole orange by a factor of 3,000 and with other dyes, such as thioflavin T, by a factor of 100. The excitation and emission maxima for thiazole orange in complex with RNA are 500 nm and 533 nm, respectively. Gating is usually set on size (FS), and fluorescence intensity is recorded on a logarithmic scale. Measurements of the immature reticulocyte fraction (IRF) provide an accurate assessment of erythropoietic activity. IRFs are reticulocytes recently released and have a higher RNA content. IRF measurements allow for detection of significant changes in red blood cell production after bone marrow transplantation or chemotherapy. Several methods, including FC, are used to obtain IRFs (109).
Fetomaternal hemorrhage can be detected by FC with the use of anti–hemoglobin F antibodies (F cells) (110). Enumeration of F cells is important in sickle cell anemia and thalassemia, in which patients receive treatment intended to stimulate increase of F cells, which is usually associated with clinical improvement. Monitoring levels of F cells is important for optimal treatment schedules because some of the drugs used have toxic side effects. F-cell levels may be of prognostic value in myelodysplasia, and, therefore, their levels need to be monitored (111).
In paroxysmal nocturnal hemoglobinuria, the glycosylphosphatidylinositol-anchored proteins CD55 (decay-accelerating factor) and CD59 (membrane inhibitor of reactive lysis) are decreased. The decay-accelerating factor is an inhibitor of the classical C3 convertase and inhibits its function by splitting C4b and C2a. CD59, on the other hand, is a regulator of the membrane attack complex. It prevents insertion of the C9 component during the formation of the membrane attack complex and blocks polymerization of C9 (see Chapter 17).
FC has distinct advantages over other methods in the study of red blood cells: Sensitivity, ability to quantitate fractions of red cells with defects, and accurate monitoring during the management of the patient (109). It can also identify the lack of markers on leukocytes at the same time. FC allows the analysis of markers on red blood cells and leukocytes with the use of triple-staining techniques (112). Decreased expression of CD55 does not always correlate with in vivo hemolysis, whereas loss of CD59 is associated with a high degree of hemolysis (113). Flow cytometry is now used for the detection and enumeration of residual red blood cells in mononuclear cell and platelet products (114).
Phosphospecific Flow Cytometry
Protein phosphorylation is a fundamental step in intracellular signaling cascades (see Chapters 15, 16, and 17). It can now be monitored by flow cytometry using monoclonal antibodies specific for the phosphate groups, known as phosphospecific antibodies.
Before staining, the cells require fixation and permeabilization, which often affects negatively the resolution of cell types based on surface marker analysis and light scatter characteristics (115,116). The sequence of the technical preparation may vary depending on the type of cells and stage of their differentiation and need to be optimized individually (117).
Three decades after the development of flow cytometry and the construction of the first cytometer (4,5), phosphospecific flow cytometry (PFC) opens a new field of single cell immunoproteomics, with identification of single cells in relation to their developmental stage, phenotype, and functional state (118).
PFC is especially suited to detect small numbers of residual cells in biopsy material from patients with lymphocytic malignancies (119) and thus accurately monitor residual disease or resistance to therapy (120,121). PFC has also been used with normal cell populations to uncover new molecular mechanisms in antigen presentation (122), signaling in individual cells (123) that determines its interaction with other cells in immune regulation (124). Cross-linking of BCR recruits and activates NOX5, a member of the nicotinamide adenine dinucleotide phosphate (NADPH) family, resulting in the production of H2O2. H2O2 inactivates membrane proximal protein tyrosine phosphatases including SHP-1 resulting in prolongation of BCR signaling (125). Thus, PFC provides a kinetic map of the events following BCR triggering, which may be useful in studies of diseases associated with prolonged B-cell activation (126).
Intracellular Cytokines
FC has recently been used in monitoring cytokine production; these methods have distinct advantages as well as several disadvantages (127). Functional subsets of T cells can be identified by this method, which allows the identification of cells producing more than one cytokine.
A disadvantage of this method is the permeabilization of the cells, which increases nonspecific fluorescence. Blocking the Fc receptors with polyclonal Ig tends to minimize the problem. A specificity control also requires blocking the intracellular cytokine by an unlabeled anticytokine antibody. Positive controls are available commercially. Cells are usually activated for increased production of cytokines. Usually, a polyclonal activator is used, such as phorbol myristate acetate (PMA) and ionomycin (128), but this raises the question of immunologic specificity. Cell-surface markers like CD4 are down-regulated during activation, which makes cell identification difficult. Because the amount of cytokines produced is small, it is customary to block their secretion with the use of brefeldin A so that the cytokine is retained within the Golgi apparatus. As compared to PMA-ionomycin, stimulation with phytohemagglutinin (PHA) limits in vitro artifacts and the cytokine production is more representative to physiologic conditions. For example, PHA stimulates secretion of tumor necrosis factor (TNF)-α and interleukin (IL)-10, which was not the case with PMA-ionomycin (129). However TNF-α–secreting cells may also be identified with the use of the TNF-α–converting enzyme (TACE) inhibitor compound (BB3103) (130). This method does not require prior stimulation of the cells fixation and permeabilization.
Activation of the cells is sometimes achieved with superantigens such as staphylococcal enterotoxin A with the addition of costimulation (i.e., anti-CD28 and anti-CD49d monoclonal antibodies) (131).
One of the main applications of this methodology is the identification of Th1 versus Th2 cell populations (132,133). Despite the limitations of this approach, the reported results seem to be consistent with pathogenic mechanisms of human disease.
Major Histocompatibility Complex–Peptide Tetramers
The innovation of HLA class I tetramers has revolutionized our understanding of cytotoxic T cells. Soluble HLA molecules are made in Escherichia coli by recombinant technology. A 15–amino acid peptide containing a single lysine residue is attached to the COOH terminus of an HLA-A2molecule. The lysine-containing peptide is biotinylated by the BirA enzyme. Folding of the HLA heavy chain is achieved in the presence of β2microglobulin and the ligand peptide of HLA-A2. Biotinylation of the tag peptide at the COOH terminus correctly orients the HLA molecule for recognition by the TCR, which binds to the NH2 terminus of the HLA. Tetramers are produced by mixing the HLA tagged with the biotinylated peptide with phycoerythrin-labeled deglycosylated avidin. Because avidin has four biotin-binding sites, it produces tetramers of HLA molecules that bind to the T cells with appropriate TCR (Fig. 2.13). The tetramers have far greater avidity for T cells than the sum of the individual affinities of the four HLA molecules (134,135,136). Variations of this method have been developed with covalently bound peptides (137) or using silent mutated sequences, which bacteria prefer in order to initiate synthesis of the HLA molecule (138). Tetramers for HLA class II are now available (139,140). Tetramer studies have been done mainly on major histocompatibility complex class I–mediated responses in viral infections (141) and malignancies (142,143). These studies have shown that the CD8+ T-cell antigen–specific responses involve 40 to 80% of the circulating CD8+ T cells, which persist for many years. Class I HLA tetramers are also used in bacterial infections and autoimmune diseases (144).
|
|
|
Figure 2.13. For formation of HLA class I or class II tetramers, the HLA molecules are tagged with a lysine-carrying peptide in their C-terminus. The molecules are biotinylated (i.e., biotin is attached on the lysine of the tag peptide). Addition of phycoerythrin-labeled avidin, which has four biotin-binding sites, associates four HLA molecules to form a tetramer. |
Low-frequency cytotoxic T cells have been detected by this method in some individuals who lyse chronic myelogenous leukemia cells (145). The HLA tetramer assay has been applied to detect cytotoxic T lymphocytes specific for Epstein-Barr virus (146) or cytomegalovirus (147) in recipients and donors of stem cell transplants. The technique can also be used in situ (148) to detect with exquisite specificity cytotoxic T cells in Epstein-Barr virus–exposed individuals (149). A new application of the tetramer technology is the simultaneous detection of antigen-specific T cells and identification of cytokine secretion. Tetramers with proper agonist peptides have the capacity to stimulate T-cell activation programs secreting interferon-γ, TNF-α, or both (150).
In an important new application, tetramers conjugated with a tumor-specific antibody targeted tumor cells (CEA+ cell lines, CD20+ B-cell lymphoma cells) to be attacked and lysed by antigen-specific cytotoxic T lymphocytes (151). These studies open the field for use of tetramers for specific immunotherapy. Tetramer assays can be combined with detection of intracellular cytokine, opening the way for the study of antigen-specific immune responses (152,153).
Tetramers made from CD1d have been tested for the detection of CD1-restricted T cells. CD1 is an HLA-like molecule that presents lipids or glycolipids to T cells. CD1d tetramers identified natural killer T cells unambiguously (154). Natural killer T cells have been implicated in the defense against certain infectious diseases as well as in the regulation of insulin-dependent diabetes mellitus.
Phagocytosis
All aspects of phagocytosis can be studied by FC (i.e., opsonization of the particle to be phagocytosed, engulfment, and oxidative burst) (155). The particles used are bacteria, zymosan, fungi, or latex labeled with FITC. For opsonization, the particles are incubated in serum that is normal or from a patient who has recovered from a specific infection. Oxidative burst is studied with substances that are converted from nonfluorescent to fluorescent products under the influence of the intracellular reactive oxygen radicals. This conversion reflects the amount of oxidative burst induced. Among the most common substances are 2′,7′-dihydrochlorofluorescein diacetate, dichlorofluorescein, and dihydrorhodamine-123/rhodamine-123.
Dihydrorhodamine-123/rhodamine-123 is a more sensitive indicator system. Lymphocytes and nonlymphocytes are discriminated by FS and SS. The number of phagocytosing nonlymphoid cells is calculated as a percentage of gated cells. The parameter phagocytosis product is defined as the percentage of phagocytosing nonlymphocytes multiplied by the mean number of targets per phagocytosing nonlymphocyte.
Cell Cycle Analysis
Cell cycle analysis is the simplest method to reveal the frequency of cells in each cell cycle phase. Cells are permeabilized and stained with the nucleic and specific fluorochrome propidium iodide or 4′6′-diamidino-2-phenylindole. The results are displayed as DNA content–frequency histograms, which show the proportions of cells in the respective phases of the cell cycle. Univariate analysis of DNA content is most frequently used in clinical studies of tumors or proliferative disorders. The proportion of cells in the S and G2/M phases is considered indicative of the increased proliferative potential, which in tumors is accepted as a poor prognostic feature. This simple analysis does not provide information about cell kinetics (i.e., the duration of cell cycle or doubling time). Cells in the G2 and M phases have the same DNA content and cannot be discriminated by univariate analysis. For this purpose, mitotic markers can be used (156). DNA replication is measured by a bivariate analysis of DNA content versus incorporation of 5-bromo-2′-deoxyuridine (BrdU) (157). Live cells are exposed to this thymidine analog, which is incorporated into DNA as the cell divides. BrdU is detected by a monoclonal antibody tagged by fluorescein. The DNA content is measured by propidium iodide. In the histogram, green versus red fluorescence provides information not only on the DNA content, but also on the number of cells in division.
Detection of Apoptosis
During apoptosis, there are changes in the cell size (smaller) and nuclear fragmentation. Shrinkage of the cell, which occurs early in apoptosis, can be detected by FS (158). Late in apoptosis, the SS also decreases. However, light scatter is not specific for apoptosis, and it should be combined with other methods.
Detection of phosphatidylserine in the outer leaflet of the cell membrane can be determined with annexin-V conjugated with fluorescein, which binds with high affinity to phosphatidylserine (159).
Other methods of evaluation of the apoptotic process by FC include measurements of mitochondrial transmembrane potential, Δψm. This is measured by rhodamine-123, a lipophilic green fluorochrome that permeates normal membranes and accumulates in the mitochondria. High intensity of green fluorescence indicates normal mitochondrial transmembrane potential. The combination with propidium iodide discriminates apoptotic from live cells. The permeable membrane of apoptotic cells allows penetration of propidium iodide (red staining), whereas rhodamine-123 penetrates only normal membranes (green staining) (160).
Another method is based on the detection of DNA fragmentation. The 3′-OH ends of the DNA breaks are detected by a fluorochrome-tagged deoxynucleotide. The 5-bromo-2′-deoxyuridine 5′-triphosphate (BrdUTP) is the most advantageous, and when it is attached to the DNA breaks, it is detected by a specific antibody (161). The attachment of BrdUTP is mediated by the enzyme TdT. The method is known as TUNEL (TdT-mediated deoxyuridine triphosphate-biotin nick-end labeling).
HLA Cross-Match by Flow Cytometry
For a successful cross-match, the detection of anti-donor antibodies in the recipient and antirecipient antibodies in the donor is critical. FC is one of the most sensitive techniques for the detection of IgG antibodies (162,163). Another advantage of FC versus the cytotoxic method, in addition to sensitivity, is the multiparameter analysis. T and B cross-matches for antibody activity against class I or class II can effectively be distinguished. T and B cells are identified by appropriate monoclonal antibodies. A human IgG anti-HLA antibody, bound to the cells, is detected by anti–human IgG antibody conjugated with fluorescein (Fig. 2.14). A significant shift of fluorescence over the control is a positive result, indicating that anti-HLA human IgG is bound to the cells. If both T and B cells are positive, transplantation is contraindicated (164).
In earlier years, a panel of cells of known HLA type was tested against the patient’s serum. This was known as panel-reactive antibody, or PRA. The percentage of positive reactions (i.e., the number of cells in the panel that reacted with the serum) was called percentage PRA. By this method, the specificity of the antibody is known as well as the possibility of obtaining a negative cross-match. PRA values predict the possibility of a positive cross-match between the recipient and prospective donors (i.e., a PRA value of 50% indicates that a positive cross-match will occur with 50% of organ donors). Thus, PRA value and specificity would exclude certain potential donors and expedite organ allocation.
Flow cytometric PRA using cells was introduced in an attempt to replace the serologic method, but several problems were encountered. Recently, microparticles coated with purified HLA class I or class II proteins have been introduced instead of cells (165,166). In the test, 20 to 50 μl of the patient’s serum is added to a mixture of HLA class I and class II beads. After 30 minutes of incubation, they are washed, and a goat anti–human IgG fluorescein-conjugated reagent is added. The mixture is washed again after a
P.37
short incubation, and the beads are passed through the cytometer. The beads of class I and class II antigens can run simultaneously (Fig. 2.15).
|
|
|
Figure 2.14. Flow cross-match. Testing for antidonor HLA antibodies is based on incubation of the recipient’s serum with donor cells expressing HLA class I or class II antigens. The binding of the antibody is detected by fluorescein-conjugated anti–human immunoglobulin (Ig) by flow cytometry. FITC, fluorescein isothiocyanate; MHC, major histocompatibility complex; PE, phycoerythrin; PerCP, peridinin-chlorophyll-a protein. (Courtesy of Dr. Peter Nickerson, Director, Immunogenetics Laboratory, Winnipeg Centre, Manitoba, Canada.) |
The flow cytometric PRA can detect more antibody than the cytotoxic method and, in addition, can detect class I and especially class II antibodies simultaneously, which is difficult with the customary methods. Once the presence of anti-HLA antibody is established, the identification of the specificity can be accomplished with flow-specific beads (i.e., expressing a particular HLA antigen) (164). These improvements in detection of anti-HLA antibodies have also shown that detection of anti-donor antibody during the posttransplant period has a poor prognosis (167) and identifies patients in need of new approaches to treatment (168).
The last step in the evolution of this technology is the use of single–antigen bead panel. These single antigen beads are coated with different colors and are mixed in one tube for the simultaneous detection of HLA antibodies against eight different antigens per test (169). In a group of ten patients who had rejected a kidney transplant, this method identified antibodies to 31 of 35 antigens that were mismatched in the donor.
Three methods, antiglobulin-enhanced complement-dependent cytotoxicity (AHG-CDC), enzyme-linked immunosorbent assay, and FC, were compared in 264 sera from 88 patients (170). Discordant results were found in 32 sera. None of the 32 sera was positive by AHG-CDC, 20 of 32 were positive by enzyme-linked immunosorbent assay, and 32 of 32 were positive by FC. In another group of 302 patients who exhibited 0% PRA by AHG-CDC, 25% had class I or class II antibodies detectable by FC. These striking differences between the two methods will certainly redefine the concept of sensitization in organ transplantation.
|
|
|
Figure 2.15. Flow panel–reactive antibody (PRA). Beads coated with purified HLA class I or class II molecules are incubated with the patient’s serum. After washing, fluorescein-conjugated anti–human immunoglobulin (Ig) is added (A). The beads are examined by flow cytometry for identification of the presence of anti-HLA antibodies (B).Multiple single-antigen–coated beads of different colors are now mixed in the same tube for the simultaneous detection of anti-HLA antibodies of different specificities. FITC, fluorescein isothiocyanate. (Courtesy of Dr. Peter Nickerson, Director, Immunogenetics Laboratory, Winnipeg Centre, Manitoba, Canada.) |
![]() Appendix: Immunophenotyping Hematologic Malignancies in the Future: Defining the Immunophenotypic Signature
Appendix: Immunophenotyping Hematologic Malignancies in the Future: Defining the Immunophenotypic Signature
Clinical flow cytometry has been in existence for over 30 years, but its applications are still growing (13). At this point, it has gone from the cell surface deep inside the cell to intracellular molecules and signaling pathways and is poised to explore the genome. The prospects for combinations of immunophenotyping with molecular phenotyping have been reviewed (171).
|
|
|
Figure 2.16. Immunophenotypic analysis of CD8+ human T cells by ten-color 12-parameter fluorescent-activated cell sorter analysis. Human peripheral blood mononuclear cells were incubated with phorbol acetate, myristate, ionomycin, and monensin and then stained for detection of several markers and intracellular cytokines. The analysis demonstrates the separation of naïve versus memory CD8+ T cells by phenotype and their differences in production of interleukin (IL)-2, IL-4, and interferon (IFN)-γ. Naïve CD8+ T cells do not produce IFN-γ. However, separation by two markers shows IFN-γ–producing cells in the naïve T cells as a result of contamination by memory cells. EMA, ethidium monoazide bromide. (Courtesy of Dr. Leonard A. Herzenberg, Professor, Department of Genetics, Stanford University School of Medicine, CA. From Herzenberg LA, DeRosa SC, Herzenberg LA. Monoclonal antibodies and the FACS: complementary tools for immunobiology and medicine. Immunol Today 2000;21:383–390, with permission.) |
In the clinical setting of studying hematologic disorders, flow cytometry has not yet reached its potential, mainly because of the limitations of the number of fluorochromes used with the one-laser or two-laser cytometers. Some laboratories have now reached the concomitant use of 11 or 12 markers (6) combined with the two parameters of light scattering. Less information is obtained when reagents are used alone or combined in small sets (i.e., “two two-color stains are not equivalent to one four-color stain”) (6).
The possibility of identifying larger numbers of cell-surface markers combined with the identification of intracellular molecules is exemplified in Figure 2.16. It shows the analysis of naïve and memory CD8+ T cells activated by phorbol myristate acetate, ionomycin, and monensin. Dead cells were separated by ethidium monoazide bromide, and the viable cells were examined for 10-color 12-parameter (two scatters) cytometric analysis (6).
Analysis to this extent is not yet available in most of the clinical laboratories. However, with the development of new instruments and new fluorochromes, flow cytometry is poised to define precisely the immunophenotypic signature for the disease or for the patient. This will be a kind of proteomics by flow cytometry to complement the new technology of functional genomics by the microarrays. The examples presented here are an attempt to outline, albeit crudely, some of the principles that may significantly add to a complete immunophenotype. In the future, immunophenotype will include not only protein identification, but also quantitative and functional aspects of their expression. Figure 2.16 is a glimpse into the future. In the examples shown here, we have used two- to four-color analysis with two scatter parameters. We define (a) the lineage of the malignant cell (not always possible with the available data); (b) “asynchronous” intralineage expressions (i.e., detected in a stage of differentiation in which it does not belong) or “aberrant” interlineage expressions; (c) intensity of fluorescence, which provides a gross but still useful parameter of expression of a particular marker; and (d) degree of homogeneity in the expression of the marker as measured by the CV. This distinguishes the homogeneous expression of a marker by the clonal malignant cell from the usually heterogeneous expression by the normal cells as a result of their normal differentiation. As some examples show, however, there is frequently a differentiation potential within the malignant clone, and the heterogeneity of the marker could be used as a unique characteristic of the patient rather than of the lineage or the stage of differentiation.
Case 1: Acute Myelogenous Leukemia
|
|
|
Size |
Small to medium |
|
Granularity |
Nongranular with only the larger cells weakly granular |
|
Immunophenotypic signature |
Stem cell: CD34+, CD117+, CD7+; myeloid: CD33+, CD15+, CD11b+ |
|
Comments |
Immature myeloid precursor with expression of CD7. Asynchronous expression of markers (i.e., coexpression of CD117+/CD15+) constitutes an important component of the signature for this patient. |
Case 2: Acute Myelogenous Leukemia with Maturation
|
|
|
Size |
Medium |
|
Granularity |
Medium (monocytic area) |
|
Immunophenotypic signature |
Stem cell: CD34-, CD117-; myeloid: CD33+/CD15+, CD11b+; others: CD56+ |
|
Comments |
AML with maturation. Aberrant expression of CD56. Heterogeneous expression of CD15 (CV 102.6) as compared to CD33 (CV 46.7). Probably indicates some degree of differentiation and forms an important component of identification of this clone. |
Case 3: Precursor B-cell Acute Lymphocytic Leukemia
|
|
|
Size |
Small to medium |
|
Granularity |
None in small cells; rare in larger cells |
|
Immunophenotypic signature |
Stem cell: CD34±, CD38+; B-lymphoid: CD103+, CD242+, CD19-, CD20-; other: HLA-DR2+, CD45- |
|
Comments |
Very strong CD10 expression (small CV). Most of the cells are CD34- and CD19-, and all of them are CD20- and CD45-. Heterogeneous HLA-DR expression (large CV). Double: CD10/CD24, CD10/CD20, and CD10/CD38 (not shown) will be very useful for minimal residual disease. |
Case 4: Precursor B-cell Acute Lymphocytic Leukemia
|
|
|
Size |
Heterogeneous |
|
Granularity |
None |
|
Immunophenotypic signature |
Stem cell: CD34-; B-lymphoid: CD102+, CD242+, CD19+, CD22+, CD20-; other: HLA-DR3+, CD45+ |
|
Comments |
Some evidence of maturation (i.e., CD34-, intermediate CD10 and CD24 expression with expression of CD45). Comparison with Case 3 makes the point. |
Case 5: Precursor B-cell Acute Lymphocytic Leukemia
|
|
|
Size |
Small |
|
Granularity |
None |
|
Immunophenotypic signature |
Stem cell: CD342+, HLA-DR2+, CD71-; B-lymphoid: CD102+, CD19+, CD24+, CD22+, CD20-, cCD79a-; myeloid: CD33+, CD13±, CD11b- |
|
Comments |
The striking heterogeneity (very large CV) of CD10 expression is the most characteristic point in this patient. For comparison, see single-parameter histograms with the usual acute lymphocytic leukemia. CD24 expression is also heterogeneous and, relative to the usual cases, weak. The striking type of CD10/CD24 expression combined with CD33 is the main characteristic of this case. |
Case 6: Precursor B-cell Acute Lymphocytic Leukemia
|
|
|
Size |
Small to large |
|
Granularity |
Light on the larger cells |
|
Immunophenotypic signature |
Stem cell: CD342+, CD117-; B-lymphoid: CD103+, CD242+, CD19+, CD22+, CD20-; myeloid: CD33+ |
|
Comments |
Characteristic feature is the strikingly strong expression of CD10 and CD34, placing the cell in the upper right corner of the histogram where no normal cells are usually located. Therefore, the CD10/CD34 combination will be very useful for minimal residual disease, as will the almost total lack of CD45. Expression of CD33 is another characteristic of this immunophenotype. The combinations CD10/20 and CD10/45 are shown for both diagnosis and remission. Although CD10 intensity is lower in remission as compared to diagnosis, the most critical criterion is the pattern of differentiation in remission, which does not exist in the leukemic population. |
Case 7: Acute Monocytic Leukemia
|
|
|
Size |
Heterogeneous |
|
Granularity |
Heterogeneous; large cells, heavily granular |
|
Immunophenotypic signature |
Stem cell: CD34+, CD117±, CD382+; myeloid: CD332+, CD15+, CD13±, CD11b+ (not shown); monocytic: CD14+, CD4+, HLA-DR2+; others: CD45+, CD2+ (not shown) |
|
Comments |
Acute leukemia with monocytic phenotype. Characteristics in this case are the two cell populations: (a) CD342+, CD4-, CD15-; and (b) CD34+, CD4+, CD15+, CD452+. Heterogeneity of CD34 expression (CV 166.7). CD4 and CD41 expression show pattern of differentiation. |
Case 8: Bone Marrow Regeneration versus Acute Lymphocytic Leukemia
|
|
|
Size |
Small |
|
Granularity |
None |
|
Immunophenotypic signature |
Stem cell: CD34+; B-lymphoid: CD102+, CD10+, CD22+, CD21+, CD20+, cCD79+ |
|
Comments |
This 3-month-old child was suspected to have leukemia by morphology. However, the strong regeneration pattern by immunophenotype could not support the diagnosis. In addition, expression of CD45 and CD20 is strong, which is not usually seen in precursor B-cell acute lymphocytic leukemia. This case shows that strong pattern of differentiation by several markers is very helpful in distinguishing normal bone marrow regeneration from a proliferative disease, especially when morphology indicates a relatively large number of immature cells. The child is now 4 years old and has no signs of leukemia. |
References
1. Caspersson TO, Schultz J. Nucleic acid metabolism of the chromosomes in relation to gene reproduction. Nature 1938;142:294.
2. Coons AH, Kaplan MH. Localization of antigen in tissue cells. II. Improvements in a method for the detection of antigen by means of fluorescent antibody. J Exp Med 1950;91:1.
3. Coulter WH. High speed automatic blood cell counter and cell size analyzer. Proc Natl Electronics Conf 1956;12:1034.
4. Julius MH, Masuda T, Herzenberg LA. Demonstration that antigen-binding cells are precursors of antibody-producing cells after purification with a fluorescence-activated cell sorter. Proc Natl Acad Sci U S A 1972;69:1934–1938.
5. Kreth HW, Herzenberg LA. Fluorescence-activated cell sorting of human T and B lymphocytes. I. Direct evidence that lymphocytes with a high density of membrane-bound immunoglobulin are precursors of plasmacytes. Cell Immunol 1974;12:396–406.
6. Herzenberg LA, DeRosa SC, Herzenberg LA. Monoclonal antibodies and the FACS: complementary tools for immunobiology and medicine. Immunol Today 2000;21:383–390.
7. Baumgarth N, Roederer M. A practical approach to multicolor flow cytometry for immunophenotyping. J Immunol Methods 2000;243:77–97.
8. Boek G. Current status of flow cytometry in cell and molecular biology. Int Rev Cytol 2001;204:239–298.
9. Kohler G, Milstein C. Continuous cultures of fused cells secreting antibody of predefined specificity. Nature 1975;256:495–497.
10. Milstein C. With the benefit of hindsight. Immunol Today 2000;21:359–364.
11. Zola H, Swart B, Nicholson I, et al. CD molecules 2005; human cell differentiation molecules. Blood 2005;106:3123–3126.
12. McCoy JP Jr. Basic principles of flow cytometry. Hematol Oncol Clin North Am 2002;16:229–243.
13. Redelman D. Flow cytometric analyses of cell phenotypes. In: Stewart CC, Nicholson JKA, eds. Immunophenotyping. New York: Wiley-Liss, 2000:49–81.
14. Valet GK, Hoffkes HG. Automated classification of patients with chronic lymphocytic leukemia and immunocytoma from flow cytometric three color immunophenotypes. Cytometry 1997;30:275–288.
15. Stewart CC, Nicholson JKA, eds. Immunophenotyping. New York: Wiley-Liss, 2000.
16. Keren DF, McCoy JP Jr, Carey JL, eds. Flow cytometry in clinical diagnosis, 3rd ed. 2001.
17. Watson JV. Introduction to flow cytometry. Cambridge University Press, 2004.
18. Terstappen LW, Huang S, Safford M, et al. Sequential generations of hematopoietic colonies derived from single nonlineage-committed CD34+ CD38- progenitor cells. Blood 1991;77:1218–1227.
19. Baecher-Allan C, Brown JA, Freeman GJ, et al. CD4+ CD25high regulatory cells in human peripheral blood. J Immunol 2001;167:1245–1253.
20. Baecher-Allan C, Viglietta V, Hafler DA. Human CD4+ CD25+ regulatory T cells. Semin Immunol 2004;16:89–97.
21. Loken MR, Shah VO, Dattilio KL, et al. Flow cytometric analysis of human bone marrow. I. Normal erythroid development. Blood 1987;69:255–263.
22. Terstappen LW, Safford M, Loken MR. Flow cytometric analysis of human bone marrow. III. Neutrophil maturation. Leukemia 1990;4:657–663.
23. Cornelius AS, Campbell D, Schwartz E, et al. Elevated common acute lymphoblastic leukemia antigen expression in pediatric immune thrombocytopenic purpura. Am J Pediatr Hematol Oncol 1991;13:57–61.
24. Coustan-Smith E, Behm FG, Hurwitz CA, et al. N-CAM (CD56) expression by CD34+ malignant myeloblasts has implications for minimal residual disease detection in acute myeloid leukemia. Leukemia 1993;7:853–858.
25. Lanza F, Bi S, Castoldi G, et al. Abnormal expression of N-CAM (CD56) adhesion molecule on myeloid and progenitor cells from chronic myeloid leukemia. Leukemia 1993;7:1510–1575.
26. Kaleem Z, Crawford E, Pathan MH, et al. Flow cytometric analysis of acute leukemias. Diagnostic utility on critical analysis of data. Arch Pathol Lab Med 2003;127:42–48.
27. Weir EG, Borowitz MJ. Flow cytometry in the diagnosis of acute leukemia. Semin Hematol 2001;38:124–138.
28. Bakker ABH, Oudenrijn S, Bakker AQ, et al. C-type lectin-like molecule-1. Cancer Res 2004;64:8443–8450.
29. Uckun FM. Regulation of human B cell ontogeny. Blood 1990;76:1908–1923.
30. Chabannon C, Wood P, Torok-Storb B. Expression of CD7 on normal human myeloid progenitors. J Immunol 1992;149:2110–2113.
31. Zauli G, Furlini G, Vitale M, et al. A subset of human CD34+ hematopoietic progenitors express low levels of CD4, the high-affinity receptor for human immunodeficiency virus type 1. Blood 1994;84:1896–1905.
32. Behm FG, Raimondi SC, Schell MJ, et al. Lack of CD45 antigen on blast cells in childhood acute lymphoblastic leukemia is associated with chromosomal hyperdiploidy and other favorable prognostic features. Blood 1992;79:1011–1016.
33. Borowitz MJ, Guenther KL, Shults KE, et al. Immunophenotyping of acute leukemia by flow cytometric analysis. Use of CD45 and right-angle light scatter to gate on leukemic blasts in three-color analysis. Am J Clin Pathol 1993;100:534–540.
34. Rainer RO, Hodges L, Seltzer GT. CD45 gating correlates with bone marrow differential. Cytometry 1995;22:139–145.
35. Lavabre-Bertrand T, Janossy G, Ivory K, et al. Leukemia-associated changes identified by quantitative flow cytometry. I. CD10 expression. Cytometry 1994;18:209–217.
36. Lavabre-Bertrand T, Duperray C, Brunet C, et al. Quantification of CD24 and CD45 antigens in parallel allows a precise determination of B-cell maturation stages: relevance for the study of B-cell neoplasias. Leukemia 1994;8:402–408.
37. Riley RS, Massey D, Jackson-Cooke C, et al. Immunophenotypic analysis of acute lymphocytic leukemia. Hematol Oncol Clin North Am 2002;16:245–299.
38. Hurwitz CA, Loken MR, Graham ML, et al. Asynchronous antigen expression of B lineage acute lymphoblastic leukemia. Blood 1988;72:299–307.
39. Buccheri V, Mihaljevic B, Matutes E, et al. mb-1: a new marker for B-lineage lymphoblastic leukemia. Blood 1993;82:853–857.
40. Tsuganezawa K, Kiyokawa N, Matsuo Y, et al. Flow cytometric diagnosis of cell lineage and developmental stage of acute lymphoblastic leukemia by novel monoclonal antibodies specific for human pre-B-cell receptor. Blood 1998;92:4317–4324.
41. Uckun FM, Cajl-Peczalska KJ, Ledbetter JA, et al. Biphenotypic leukemic lymphocyte precursors in acute lymphoblastic leukemia and their putative normal counterparts in human fetal hematopoietic tissues. Blood 1989;73:1003–1015.
42. Todd WMC. Acute myeloid leukemia and related conditions. Hematol Oncol Clin North Am 2002;16:301–309.
43. Kita K, Nakase K, Miwa H, et al. Phenotypic characteristics of acute myelocytic leukemia associated with the t(8;21)(q22;q22) chromosomal abnormality: frequent expression of immature B cell antigen CD19 together with stem cell antigen CD34. Blood 1992;80:470–477.
44. Hurwitz CA, Raimondi SC, Head D, et al. Distinctive immunophenotypic features of t(8;21)(q22;q22) acute myeloblastic leukemia in children. Blood 1992;80:3182–3188.
45. Kurtzberg J, Waldman TA, Davey MP, et al. CD7+, CD4-, CD8- acute leukemia: a syndrome of malignant pluripotent lymphohematopoietic cells. Blood 1989;73:381–390.
46. Jensen AW, Hokland M, Jörgensen H, et al. Solitary expression of CD7 among T-cell antigens in acute myeloid leukemia: identification of a group of patients with similar T-cell receptor β and δ rearrangements and course of disease suggestive of poor prognosis. Blood 1991;78:1292–1300.
47. Bassan R, Biondi A, Benvestito S, et al. Acute undifferentiated leukemia with CD7+ and CD13+ immunophenotype. Cancer 1992;69:396–404.
48. Barcena A, Muench MO, Roncaroloz MG, et al. Tracing the expression of CD7 and other antigens during T- and myeloid-cell differentiation in the human fetal liver and thymus. Leuk Lymphoma 1995;17:1–11.
49. Barcena A, Muench MO, Galy AHM, et al. Phenotypic and functional analysis of T cell precursors in the human fetal liver and thymus: CD7 expression in the early stages of T- and myeloid-cell development. Blood 1993;82:3401–3414.
50. Tien H-F, Chou C-C, Wang C-H, et al. Putative normal counterparts of leukaemic cells from CD7-positive acute myeloid leukaemia can be demonstrated in human haematopoietic tissues. Br J Haematol 1996;94:501–506.
51. Grümayer ER, Griesinger F, Hummell DS, et al. Identification of novel B-lineage cells in human fetal bone marrow that co-express CD7. Blood 1991;77:64–68.
52. Panzer-Grümayer ER, Panzer S, Wolf M, et al. Characterization of CD7+CD19+ lymphoid cells after Epstein-Barr virus transformation. J Immunol 1993;151:92–99.
53. Homans AC, Verissimo AM, Vlacha V. Transient abnormal myelopoiesis of infancy associated with trisomy 21. Am J Pediatr Hematol Oncol 1993;5:392–399.
54. Kwong YL, Cheng G, Tang TS, et al. Transient myeloproliferative disorder in a Down’s neonate with rearranged T-cell receptor β gene and evidence of in vivo maturation demonstrated by dual-color flow cytometric DNA ploidy analysis. Leukemia 1993;7:1667–1671.
55. Yamura-Yagi K, Hara J, Tawa A, et al. Phenotypic characteristics of acute megakaryocytic leukemia and transient abnormal myelopoiesis. Leuk Lymphoma 1994;13:393–400.
56. Litz CE, Davies S, Brunning RD, et al. Acute leukemia and the transient myeloproliferative disorder associated with Down syndrome: morphologic, immunophenotypic, and cytogenetic manifestations. Leukemia 1995;9:1432–1439.
57. Cherian CS, Moor J, Bantly A, et al. Flow cytometric analysis of peripheral blood neutrophils: a simple objective, independent and potentially clinically useful assay to facilitate the diagnosis of myelodysplastic syndromes. Am J Hematol 2005;79:243–245.
58. Della Porta MG, Malcovati L, Invernizzi R, et al. Flow cytometry evaluation of erythroid dysplasia in patients with myelodysplastic syndrome. Leukemia 2006;20:549–555.
59. Ogata K, Nakamura K, Yokose N, et al. Clinical significance of phenotypic fixtures of blasts in patients with myelodysplastic syndrome. Blood 2002;100:3887–3896.
60. Ogata K, Kishikawa Y, Satoh C, et al. Diagnostic application of flow cytometric characteristics of CD34+ cells in low-grade myelodysplastic syndromes. Blood 2006;108:1037–1044.
61. Ribeiro E, Lima CS, Metze K, et al. Flow cytometric analysis of the expression of Fas-Fasl in bone marrow CD34+ cells in myelodysplastic syndromes: relation to disease progression. Leuk Lymphoma 2004;45:309–313.
62. Ben-Ezra J. B cell lymphoproliferative disorders. Hematol Oncol Clin North Am 2002;16:321–337.
63. Carey JL. Immunophenotyping of chronic lymphoid leukemias and related non-Hodgkin’s leukemia. In: Stewart CC, Nicholson JKA, eds. Immunophenotyping. New York: Wiley-Liss, 2000:181–210.
64. Scott CS, Limbert HJ, Roberts BE, et al. Prolymphocytoid variants of chronic lymphocytic leukaemia: an immunological and morphological survey. Leuk Res 1987;11:135–140.
65. Thompson AA, Talley JA, Do HN, et al. Aberrations of the B-cell receptor B29 (CD79b) gene in chronic lymphocytic leukemia. Blood 1997;90:1387–1394.
66. Wormsley SB, Baerd SM, Gadol N, et al. Characteristics of CD11c+CD5+ B-cell leukemia and the identification of novel peripheral blood B-cell subsets with chronic lymphoid leukemia immunophenotypes. Blood 1990;76:123–130.
67. Hanson CA, Gribbin TE, Schnitzer B, et al. CD11c (Leu-M5) expression characterizes a B-cell chronic lymphoproliferative disorder with features of both chronic lymphocytic leukemia and hairy cell leukemia. Blood 1990;76:2360–2367.
68. Damle RN, Wasil T, Fais F, et al. Ig V gene mutation status and CD38 expression as novel prognostic indicators in chronic lymphocytic leukemia. Blood 1999;94:1840–1847.
69. Hamblin TJ, Davis Z, Gardiner A, et al. Unmutated Ig VH genes are associated with a more aggressive form of chronic lymphocytic leukemia. Blood 1999;94:1848–1854.
70. Del Poeta G, Maurillo L, Vendetti A, et al. Clinical significance of CD38 expression in chronic lymphocytic leukemia. Blood 2001;98:2633–2639.
71. Ibrahim S, Keating M, Do K-A, et al. CD38 expression is an important prognostic factor in B-cell chronic lymphocytic leukemia. Blood 2001;98:181–186.
72. D’Arena G, Musto P, Cascarilla N, et al. CD38 expression correlates with adverse biological features and predicts poor clinical outcome in B-cell chronic lymphocytic leukemia. Leuk Lymphoma 2001;42:109–114.
73. Durig J, Naschar M, Schmücker U, et al. CD38 expression is an important prognostic marker in chronic lymphocytic leukemia. Leukemia 2002;16:30–35.
74. Hamblin TJ, Orchard JA, Ibotson RE, et al. CD38 expression and immunoglobulin variable region mutations are independent prognostic variables in chronic lymphocytic leukemia, but CD38 expression may vary during the course of the disease. Blood 2002;99:1023–1029.
75. Kröber A, Seiler T, Benner A, et al. VH mutation status, CD38 expression level, genomic aberrations, and survival in chronic lymphocytic leukemia. Blood 2002;100:1410–1416.
76. Lin K, Sherrington PD, Dennis M, et al. Relationship between p53 dysfunction, CD38 expression, and Ig VH mutation in chronic lymphocytic leukemia. Blood 2002;100:1404–1409.
77. Kay S, Herishanu Y, Pick M, et al. Quantitative flow cytometry of ZAP-70 levels in chronic lymphocytic leukemia using molecules of equivalent soluble fluorochrome. Cytometry B Clin Cytom 2006;70:218–226.
78. Oscier DG, Gardiner AC, Mould SJ, et al. Multivariate analysis of prognostic factors in CLL: clinical stage, IG VH gene mutational status, and loss or mutation of the p53 gene are independent prognostic factors. Blood 2002;100:1177–1184.
79. Klein U, Rajewsky K, Küppers R. Human immunoglobulin (Ig) M+IgD+ peripheral blood B cells expressing the CD27 cell surface antigen carry somatically mutated variable region genes: CD27 as a general marker for somatically mutated (memory) B cells. J Exp Med 1998;188:1679–1689.
80. Ranheim EA, Cantwell MJ, Kipps TJ. Expression of CD27 and its ligand, CD70, on chronic lymphocytic leukemia B cells. Blood 1995;85:3556–3565.
81. Cherepakhin V, Baird SM, Meisenholder GW, et al. Common clonal origin of chronic lymphocytic leukemia and high grade lymphoma of Richter’s syndrome. Blood 1993;82:3141–3147.
82. Robbins BA, Ellison DJ, Spinosa JC, et al. Diagnostic application of the two-color flow cytometry in 161 cases of hairy cell leukemia. Blood 1993;82:1277–1287.
83. Argattoff LH, Conners JM, Klasa RJ, et al. Mantle cell lymphoma: a clinicopathologic study of 80 cases. Blood 1997;89:2067–2078.
84. Berger F, Felman P, Thieblemont C, et al. Non-MALT marginal zone B-cell lymphomas: a description of clinical presentation and outcome in 124 patients. Blood 2000;95:1950–1956.
85. Tierens A, Delabie J, Michiels L, et al. Marginal-zone B cells in the human lymph node and spleen show somatic hypermutations and display clonal expansion. Blood 1999;93:226–234.
86. Stein K, Hummel M, Korbjuhn P, et al. Monocytoid B cells are distinct from splenic marginal zone cells and commonly derive from unmutated naïve B cells and less frequently from postgerminal center B cells by polyclonal transformation. Blood 1999;94:2800–2808.
87. Yang E, Korsmeyer SJ. Molecular thanatopsis: a discourse on the BCL2 family and cell death. Blood 1996;88:386–401.
88. Tiesinga JJ, Wu C-D, Inghirami G. CD5+ follicle center lymphoma. Immunophenotyping detects a unique subset of “floral” follicular lymphoma. Am J Clin Pathol 2000;114:912–921.
89. Jamal S, Picker LJ, Aquiro DB, et al. Immunophenotypic analysis of peripheral T cell neoplasms. A multiparameter flow cytometric approach. Am J Clin Pathol 2001;116:512–526.
90. Cooke CB, Krenacs L, Stetler-Stevenson M, et al. Hepatosplenic T-cell lymphoma: a distinct clinicopathologic entity of cytotoxic γδ T-cell origin. Blood 1996;88:4265–4274.
91. Naughton MJ, Hess JL, Zutter MM, et al. Bone marrow staging in patients with non-Hodgkin’s lymphoma. Is flow cytometry a useful test? Cancer 1998;82:1154–1159.
92. Hanson CA, Kurita PJ, Katzmann JA, et al. Immunophenotypic analysis of peripheral blood and bone marrow in the staging of B-cell malignant lymphoma. Blood 1999;94:3889–3896.
93. Duggan PR, Easton D, Luider J, et al. Bone marrow staging of patients with non-Hodgkin lymphoma by flow cytometry. Cancer 2000;88:894–899.
94. Kawano-Yamamoto C, Muroi K, Izumi T, et al. Two-color flow cytometry with a CD19 gate for the evaluation of bone marrow involvement of B-cell lymphoma. Leuk Lymphoma 2002;43:2133–2137.
95. Campana D, Coustan-Smith E, Janossy G. The immunologic detection of minimal residual disease in acute leukemia. Blood 1990;76:163–171.
96. Orfao A, Cindad J, Almeida J, et al. Residual disease detection of leukemia. In: Stewart CC, Nicholson JKA, eds. Immunophenotyping. New York: Wiley-Liss, 2000:239–259.
97. Sievers EL, Loken MR. Detection of minimal residual in acute myelogenous leukemia. J Pediatr Hematol Oncol 1995;17:123–133.
98. Cindad J, San Miguel JF, Lopez-Berges MC, et al. Prognostic value of immunophenotypic detection of minimal residual disease (MRD) in acute lymphoblastic leukemia. J Clin Oncol 1998;16:3774–3781.
99. Dworzak MN, Stolz F, Fröschl G, et al. Detection of residual disease in pediatric B-cell precursor acute lymphoblastic leukemia by comparative phenotype mapping: a study of five cases controlled by genetic methods. Exp Hematol 1999;27:673–681.
100. Michelson AD. Flow cytometry: a clinical test of platelet function. Blood 1996;87:4925–4936.
101. Faraday N, Goldschmidt-Clermont P, Dise K, et al. Quantitation of soluble fibrinogen binding to platelets by fluorescence-activated flow cytometry. J Lab Clin Med 1994;123:728–740.
102. Michelson AD. Thrombin-induced down-regulation of the platelet membrane of glycoprotein Ib-IX complex. Semin Thromb Hemost 1992;18:18–27.
103. Hickerson DHM, Bode AP. Flow cytometry of platelets for clinical analysis. Hematol Oncol Clin North Am 2002;16:421–454.
104. Ault KA. Flow cytometric measurements of platelet function and reticulated platelets. Ann N Y Acad Sci 1993;677:293–308.
105. Israels ED, Nisli G, Paraskevas F, et al. Platelet Fc receptors as a mechanism for Ag-Ab complex-induced platelet injury. Thromb Diath Haemorrh 1973;29:434–444.
106. Ault KA. The clinical utility of flow cytometry in the study of platelets. Semin Hematol 2001;38:160–168.
107. Salvagno GL, Montagnana M, Degan M, et al. Evaluation of platelet turnover by flow cytometry. Platelets 2006;17:170–177.
108. Riley RS, Ben-Ezra JM, Tidwell A, et al. Reticulocyte analysis by flow cytometry and other techniques. Hematol Oncol Clin North Am 2002;16:373–420.
109. Lacombe F, Lacoste L, Vial J, et al. Automated reticulocyte counting and immature reticulocyte fraction measurement. Comparison of ABX PENTRA 120 Retic Sysmex R-2000 flow cytometry and manual counts. Am J Clin Pathol 1999;112:677–686.
110. Davis BH. Diagnostic advances in defining erythropoietic abnormalities and red blood cell diseases. Semin Hematol 2001;38:148–159.
111. Craig JE, Sampietro M, Oscier DG, et al. Myelodysplastic syndrome with karyotype abnormality is associated with elevated F-cell production. Br J Haematol 1996;93:601–605.
112. Hernandez-Campo PM, Marten-Ayusa M, Almeida J, et al. Comparative analysis of different flow cytometry-based immunophenotypic methods for the analysis of CD59 and CD55 expression on major peripheral blood cell subsets. Cytometry 2002;50:191–201.
113. Iwamoto N, Kawaguchi T, Nagakura S, et al. Markedly high population of affected reticulocytes negative for decay-accelerating factor and CD59 in paroxysmal nocturnal hemoglobinuria. Blood 1995;85:2228–2232.
114. Santana JM, Dumont LJ. A flow cytometric method for detection and enumeration of low-level, residual red blood cells in platelets and mononuclear cell products. Transfusion 2006;46:966–972.
115. Krutzik PO, Nolan GP. Intracellular phospho-protein staining techniques for flow cytometry: monitoring single cell signaling events. Cytometry 2003;55A:61–70.
116. Krutzik PO, Irish JM, Nolan GP, et al. Analysis of protein phosphorylation and cellular signaling events by flow cytometry: techniques and clinical applications. Clin Immunol 2004;110:206–221.
117. Krutzik PO, Clutter MR, Nolan GP. Coordinate analysis of murine cell surface markers and intracellular phosphoproteins by flow cytometry. J Immunol 2005;175:2357–2365.
118. Perez OD, Nolan GP. Phospho-proteomic immune analysis by flow-cytometry: from mechanism to translational medicine at the single-cell level. Immunol Rev 2006;210:208–228.
119. Irish JM, Czerwinski DK, Nolan GP, et al. Altered B cell receptor signaling kinetics distinguish human follicular lymphoma B cells from tumor infiltrating non-malignant B cells. Blood 2006;177:1581–1589.
120. Irish JM, Hovland R, Krutzik PO, et al. Single cell profiling of potentiated phospho-protein networks in cancer cells. Cell 2004;118:217–228.
121. Irish JM, Kotecha N, Nolan GP. Mapping normal and cancer cell signalling networks: towards single cell proteomics. Nat Rev Cancer 2006;6:146–155.
122. Drake L, McGovern-Brindisi EM, Drake JR. BCR ubiquitination controls BCR-mediated antigen processing and presentation. Blood 2006;108:4086–4093.
123. Hale MB, Nolan GP. Phospho-specific flow cytometry: intersection of immunology and biochemistry at the single-cell level. Curr Opin Mol Ther 2006;8:215–224.
124. Krutzik PO, Hale MB, Nolan GP. Characterization of the murine immunological signaling network with phosphospecific flow cytometry. J Immunol 2005;175:2366–2373.
125. Tonks NK. Redox-redux: revisiting PTPs and the control of cell signaling. Cell 2005;121:667–670.
126. Irish JM, Czerwinski DK, Nolan GP, et al. Kinetics of B cell receptor signaling in human B cell subsets mapped by phosphospecific flow cytometry. J Immunol 2006;177:1581–1589.
127. Pala P, Hussell T, Openshaw PJM. Flow cytometric measurement of intracellular cytokines. J Immunol Methods 2000;243:107–124.
128. Rodriguez-Caballero A, Garcia-Montero AC, Bueno C, et al. A new simple whole blood flow cytometry-based method for simultaneous identification of activated cells and quantitative evaluation of cytokines released during activation. Lab Invest 2004;84:1387–1398.
129. Baran J, Kowalczyk D, Ozog M, et al. Three-color flow cytometry detection of intracellular cytokines in peripheral blood mononuclear cells: comparative analysis and phytohemagglutinin stimulation. Clin Diagn Lab Immunol 2001;8:303–313.
130. Bueno C, Rodriquez-Cabalero A, Garcia-Montero A, et al. A new method for detecting TNF-α-secreting cells using direct-immunofluorescence surface membrane staining. J Immunol Methods 2002;264:77–87.
131. Gauiden M-C. Intracellular cytokine staining for the characterization and quantitation of antigen-specific T lymphocyte responses. Methods 2006;38:263–273.
132. Muraille E, Leo O. Revisiting the Th1/Th2 paradigm. Scand J Immunol 1998;47:1–9.
133. Maino VC, Picker LJ. Identification of functional subsets by flow cytometry: intracellular detection of cytokine expression. Cytometry 1998;34:207–215.
134. Altman JD, Moss PAH, Goulder PJR, et al. Phenotypic analysis of antigen-specific T lymphocytes. Science 1996;274:94–96.
135. McMichael AJ, O’Callaghan CA. A new look at T cells. J Exp Med 1998;187:1367–1371.
136. Kalergis AM, Goyarts EC, Palmieri E, et al. A simplified procedure for the preparation of MHC/peptide tetramers: chemical biotinylation of an unpaired cysteine engineered at the C-terminus of MHC-1. J Immunol Methods 2000;234:61–70.
137. Crawford F, Kozono H, White J, et al. Detection of antigen-specific T cells with multivalent soluble class II MHC covalent peptide complexes. Immunity 1998;8:675–682.
138. Sato Y, Sahara H, Tsukahara T, et al. Improved generation of HLA class I/peptide tetramers. J Immunol Methods 2002;271:177–184.
139. Novak EJ, Liu AW, Nepom GT, et al. MHC class II tetramers identify peptide-specific human CD4+ T cells proliferating in response to influenza A antigen. J Clin Invest 1999;104:R63–R67.
140. McMichael AJ, Kelleher A. The arrival HLA class II tetramers. J Clin Invest 2000;104:1669–1670.
141. Appay V, Nixon DF, Donahoe SM, et al. HIV-specific CD8+ T cells produce antiviral cytokines but are impaired in cytolytic function. J Exp Med 2000;192:63–75.
142. Lee PP, Yee C, Savage PA, et al. Characterization of circulating T cells specific for tumor-associated antigens in melanoma patients. Nat Med 1999;5:677–685.
143. Maeurer MJ, Necker A, Salter RD, et al. Improved detection of melanoma antigen-specific T cells expressing low or high levels of CD8 by HLA-A2 tetramers presenting a Melan-A/Mart-1 peptide analogue. Int J Cancer 2002;97:64–71.
144. Ogg GS, Dunbar PR, Romero P, et al. High frequency of skin-homing melanocyte-specific cytotoxic T lymphocytes in autoimmune vitiligo. J Exp Med 1998;188:1203–1208.
145. Molldrem JJ, Lee PP, Wong C, et al. A PR-1 human leukocyte antigen-A2 tetramer can be used to isolate low frequency cytotoxic T lymphocytes from healthy donors that selectively lyse chronic myelogenous leukemia. Cancer Res 1999;59:2675–2681.
146. Falco DA, Nepomuceno RR, Krams SM, et al. Identification of Epstein-Barr virus-specific CD8+ T lymphocytes in the circulation of pediatric transplant recipients. Transplantation 2002;74:501–510.
147. Lacey SF, Callez-Hawkins G, Crooks M, et al. Characterization of cytotoxic function of CMV-pp65-specific CD8+ T lymphocytes identified by HLA tetramers in recipients and donors of stem-cell transplants. Transplantation 2002;74:722–732.
148. Skinner PJ, Caniels MA, Schmidt CS, et al. Cutting edge: in situ tetramer staining of antigen-specific T cells in tissues. J Immunol 2000;165:613–617.
149. Burrows SR, Kienzle N, Winterhalter A, et al. Peptide-MHC class I tetrameric complexes display exquisite ligand specificity. J Immunol 2000;165:6229–6234.
150. Wei C-H, Uhlin M, Masucci MG, et al. Tetramer binding and secretion of interferon-γ in response to antigenic stimulation are compatible with a range of affinities of MHC:TCR interaction and distinct programs of cytotoxic T-lymphocyte activation. Hum Immunol 2002;63:821–833.
151. Robert B, Guillaume P, Luescher I, et al. Antibody-conjugated MHC class I tetramers can target tumor cells for specific lysis by T lymphocytes. Eur J Immunol 2000;30:3165–3170.
152. Bleesing JJH, Fleisher TA. Cell function-based flow cytometry. Semin Hematol 2001;38:169–178.
153. Collins DP, Leubering BJ, Shaut DM. T-lymphocyte functionality assessed by analysis of cytokine receptor expression, intracellular cytokine expression, and femtomolar detection of cytokine secretion by quantitative flow cytometry. Cytometry 1998;33:249–255.
154. Banlagha K, Weiss A, Beavis A, et al. In vivo identification of glycolipid antigen-specific T cells using fluorescent CD1d tetramers. J Exp Med 2000;191:1895–1903.
155. Lehman AK, Söhnes S, Halstensen A. Phagocytosis: measurement by flow cytometry. J Immunol Methods 2000;243:229–242.
156. Juan G, Traganos F, Darzynkiewicz Z. Identification of mitotic cells by flow cytometry. Methods Cell Biol 2001;63:343–354.
157. Gratzner HG. Monoclonal antibody to 5-bromo- and 5-iododeoxyuridine: a new reagent for detection of DNA replication. Science 1982;218:474–475.
158. Ormerod JG, Cheetham FPM, Sun X-M. Discrimination of apoptotic thymocytes by forward light scatter. Cytometry 1995;21:300–304.
159. Van Engeland M, Nieland LJW, Ramaeckers FCS, et al. Annexin V affinity assay: a review on an apoptosis detection system based on phosphatidylserine exposure. Cytometry 1998;31:1–9.
160. Darzynkiewicz Z, Bedner E, Smolewski P. Flow cytometry in analysis of cell cycle and apoptosis. Semin Hematol 2001;38:179–193.
161. Li X, Darzynkiewicz Z. Labeling DNA strand breaks with BrdUTP: detection of apoptosis and cell proliferation. Cell Prolif 1995;28:571–579.
162. Bryan CF, Baier KA, Nelson PW, et al. Long term graft survival is improved in cadaveric renal retransplantation by flow cytometric crossmatching. Transplantation 1998;66:1827–1832.
163. Bray RA, Gebel HM. Transplantation immunophenotyping. In: Stewart CC, Nicholson JKA, eds. Immunophenotyping. New York: Wiley-Liss, 2000:321–332.
164. Bray RA. Flow cytometry in human leukocyte antigen testing. Semin Hematol 2001;38:194–200.
165. Bray RA, Cook DJ, Gebel HM. Flow cytometric detection of HLA allo-antibodies using class I coated microparticles. Hum Immunol 1997;55(Suppl 1):36.
166. Pei R, Wang G, Tarsitani C, et al. Simultaneous HLA class I and class II antibodies screening with flow cytometry. Hum Immunol 1998;59:313–322.
167. Christiaans MHL, Overhof-de Roos R, Nieman F, et al. Donor-specific antibodies after transplantation by flow cytometry. Transplantation 1998;65:427–433.
168. Kiball P, Rhodes C, King A, et al. Flow cross matching identifies patients at risk for post-operative elaboration of cytotoxic antibodies. Transplantation 1998;65:444–446.
169. Pei R, Lee J-H, Shih N-J, et al. Single human leukocyte antigen flow cytometry beads for accurate identification of human leukocyte antigen antibody specificities. Transplantation 2003;75:43–49.
170. Gebel HM, Bray RA. Sensitization and sensitivity. Defining the unsensitized patient. Transplantation 2000;69:1370–1374.
171. Goolsby CL, Thompson E, Mosiman V. Combined immunophenotyping and molecular phenotyping. In: Steward CC, Nicholson JKA, eds. Immunophenotyping. New York: Wiley-Liss, 2000:407–427.