Pharmacokinetics: Introduction
Pharmacokinetics denotes the effects of biologic systems on drugs. The major processes involved in pharmacokinetics are absorption, distribution, and elimination. Appropriate application of pharmacokinetic data and a few simple formulas makes possible the calculation of loading and maintenance doses.
High-Yield Terms to Learn
Volume of distribution (apparent) The ratio of the amount of drug in the body to the drug concentration in the plasma or blood Clearance The ratio of the rate of elimination of a drug to the concentration of the drug in the plasma or blood Half-life The time required for the amount of drug to fall to 50% of an earlier measurement. For drugs eliminated by first-order kinetics, this number is a constant regardless of the concentration Bioavailability The fraction (or percentage) of the administered dose of drug that reaches the systemic circulation Area under the curve (AUC) The graphic area under a plot of drug concentration versus time after a single dose or during a single dosing interval Peak and trough concentrations The maximum and minimum drug concentrations achieved during repeated dosing cycles Minimum effective concentration (MEC) The plasma drug concentration below which a patient's response is too small for clinical benefit First-pass effect, presystemic elimination The elimination of drug that occurs after administration but before it enters the systemic circulation (eg, during passage through the gut wall, portal circulation, or liver for an orally administered drug) Steady state In pharmacokinetics, the condition in which the average total amount of drug in the body does not change over multiple dosing cycles (ie, the condition in which the rate of drug elimination equals the rate of administration) Biodisposition Often used as a synonym for pharmacokinetics; the processes of drug absorption, distribution, and elimination. Sometimes used more narrowly to describe elimination
Effective Drug Concentration
The effective drug concentration is the concentration of a drug at the receptor site. In isolated tissue preparations, this concentration is easily determined. In contrast, in in vivo conditions, and especially in patients, drug concentrations are more readily measured in the blood. Except for topically applied agents, the concentration at the receptor site is usually proportional to the drug's concentration in the plasma or whole blood at equilibrium. The plasma concentration is a function of the rate of input of the drug (by absorption) into the plasma, the rate of distribution to the peripheral tissues (including the target organ), and the rate of elimination, or loss, from the body. These are all functions of time; but if the rate of input is known, the remaining processes are well described by 2 primary parameters: apparent volume of distribution (Vd) and clearance. These parameters are unique for a particular drug and a particular patient, but have average values in large populations that can be used to predict drug concentrations.
Volume of Distribution
The volume of distribution (Vd) relates the amount of drug in the body to the plasma concentration according to the following equation:

The calculated parameter for the Vd has no direct physical equivalent; therefore, it is usually denoted the apparent Vd. A drug that is completely retained in the plasma compartment (Figure 3-1) will have a Vd equal to the plasma volume (about 4% of body weight). The Vd of drugs that are normally bound to plasma proteins such as albumin can be altered by liver disease (through reduced protein synthesis) and kidney disease (through urinary protein loss). On the other hand, if a drug is avidly bound in peripheral tissues, the drug's concentration in plasma may drop to very low values even though the total amount in the body is large. As a result, the Vd may greatly exceed the total physical volume of the body. For example, 50,000 liters is the average Vd for the drug quinacrine in persons whose average physical body volume is 70 liters.
FIGURE 3-1

Effect of drug binding on volume of distribution. Drug A diffuses freely between the 2 compartments and does not bind to macromolecules (heavy wavy lines) in the vascular or the extravascular compartments of the hypothetical organism in the diagram. With 20 units of the drug in the body, the steady-state distribution leaves a blood concentration of 2 units. Drug B, on the other hand, binds avidly to proteins in the blood. At equilibrium, only 2 units of the total are present in the extravascular volume, leaving 18 units still in the blood. In each case, the total amount of drug in the body is the same (20 units), but the apparent volumes of distribution are very different. Drug C is avidly bound to molecules in peripheral tissues, so that a larger total dose (200 units) is required to achieve measurable plasma concentrations. At equilibrium, 198 units are found in the peripheral tissues and only 2 units in the plasma, so that the calculated volume of distribution is greater than the physical volume of the system.
Clearance
Clearance (CL) relates the rate of elimination to the plasma concentration:
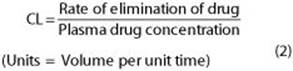
For a drug eliminated with first-order kinetics, clearance is a constant; that is, the ratio of rate of elimination to plasma concentration is the same regardless of plasma concentration (Figure 3-2). The magnitudes of clearance for different drugs range from a small percentage of the blood flow to a maximum of the total blood flow to the organs of elimination. Clearance depends on the drug and the condition of the organs of elimination in the patient. The clearance of a particular drug by an individual organ is equivalent to the extraction capability of that organ for that drug times the rate of delivery of drug to the organ. Thus, the clearance of a drug that is very effectively extracted by an organ (ie, the blood is completely cleared of the drug as it passes through the organ) is often flow-limited. For such a drug, the total clearance from the body is a function of blood flow through the eliminating organ and is limited by the blood flow to that organ. In this situation, other conditions—disease or other drugs that change blood flow—may have more dramatic effects on clearance than disease of the organ of elimination. Note that for drugs eliminated with zero-order kinetics (see Figure 1-3, right), clearance is not constant.
FIGURE 3-2

The clearance of the great majority of drugs is relatively constant over a broad range of plasma concentrations. Since elimination rate is equal to clearance times plasma concentration, the elimination rate will be rapid at first and slow as the concentration decreases.
Skill Keeper 1: Zero-Order Elimination
(See Chapter 1)
Most drugs in clinical use obey the first-order kinetics rule described in the text. Can you name 3 important drugs that do not? The Skill Keeper Answer appears at the end of the chapter.
Half-Life
Half-life (t 1/2) is a derived parameter, completely determined by Vd and CL. Like clearance, half-life is a constant for drugs that follow first-order kinetics. Half-life can be determined graphically from a plot of the blood level versus time (eg, Figure 1-4), or from the following relationship:

One must know both primary variables (Vd and CL) to predict changes in half-life. Disease, age, and other variables usually alter the clearance of a drug much more than they alter its Vd. The half-life of a drug may not change, however, despite a decreased clearance if the Vd decreases at the same time. This occurs, for example, when lidocaine is administered to patients with heart failure. The half-life determines the rate at which blood concentration rises during a constant infusion and falls after administration is stopped (Figure 3-3). The effect of a drug at 87-90% of its steady-state concentration is clinically indistinguishable from the steady-state effect; thus, 3-4 half-lives of dosing at a constant rate are considered adequate to produce the effect to be expected at steady state with a specified rate of chronic dosing.
FIGURE 3-3

Plasma concentration (plotted as percent of maximum) of a drug given by constant intravenous infusion for 8 half-lives and then stopped. The concentration rises smoothly with time and always reaches 50% of steady state after 1 half-life, 75% after 2 half-lives, 87.5% after 3 half-lives, and so on. The decline in concentration after stopping drug administration follows the same type of curve: 50% is left after 1 half-life, 25% after 2 half-lives, and so on. The asymptotic approach to steady state on both increasing and decreasing limbs of the curve is characteristic of drugs that have first-order kinetics.
Bioavailability
The bioavailability of a drug is the fraction (F) of the administered dose that reaches the systemic circulation. Bioavailability is defined as unity (or 100%) in the case of intravenous administration. After administration by other routes, bioavailability is generally reduced by incomplete absorption (and in the intestine, expulsion of drug by intestinal transporters), first-pass metabolism, and any distribution into other tissues that occurs before the drug enters the systemic circulation. Even for drugs with equal bioavailabilities, entry into the systemic circulation occurs over varying periods of time, depending on the drug formulation and other factors. To account for such factors, the concentration appearing in the plasma is integrated over time to obtain an integrated total area under the plasma concentration curve (AUC, Figure 3-4).
FIGURE 3-4

The area under the curve (AUC) is used to calculate the bioavailability of a drug. The AUC can be derived from either single-dose studies (left) or multiple-dose measurements (right). Bioavailability is calculated from AUC(route)/AUC(IV).
Extraction
Removal of a drug by an organ can be specified as the extraction ratio, that is, the percentage of the drug removed from the perfusing blood during its passage through the organ (Figure 3-5). After steady-state concentration in plasma has been achieved, the extraction ratio is one measure of the elimination of the drug by that organ.
FIGURE 3-5

The principles of organ extraction and first-pass effect are illustrated. Part of the administered oral dose (blue) is lost to metabolism in the gut and the liver before it enters the systemic circulation: This is the first-pass effect. The extraction of drug from the circulation by the liver is equal to blood flow times the difference between entering and leaving drug concentration, ie, Q x (Ci - Co). CL, clearance.
(Modified and reproduced, with permission, from Katzung BG, editor: Basic & Clinical Pharmacology, 8th ed. McGraw-Hill, 2001.)
Drugs that have a high hepatic extraction ratio have a large first-pass effect; the bioavailability of these drugs after oral administration is low.
Skill Keeper 2: First-Pass Effect
(See Chapter 1)
The oral route of administration is the most likely to have a large first-pass effect and therefore low bioavailability. What tissues contribute to this effect? The Skill Keeper Answer appears at the end of the chapter.
Dosage Regimens
A dosage regimen is a plan for drug administration over a period of time. An optimal dosage regimen results in the achievement of therapeutic levels of the drug in the blood without exceeding the minimum toxic concentration. To maintain the plasma concentration within a specified range over long periods of therapy, a schedule of maintenance doses is used. If it is necessary to achieve the target plasma level rapidly, a loading dose is used to "load" the Vd with the drug. Ideally, the dosing plan is based on knowledge of both the minimum therapeutic and minimum toxic concentrations for the drug, as well as its clearance and Vd.
Maintenance Dosage
Because the maintenance rate of drug administration is equal to the rate of elimination at steady state (this is the definition of steady state), the maintenance dosage is a function of clearance (from Equation 2).
![]()
Note that Vd is not involved in the calculation of Equation 4. The dosing rate computed for maintenance dosage is the average dose per unit time. When performing such calculations, make certain that the units are in agreement throughout. For example, if clearance is given in mL/min, the resulting dosing rate is a per-minute rate. Because convenience of administration is desirable for chronic therapy, doses should be given orally if possible and only once or a few times per day. The size of the daily dose (dose per minute x 60 min/h x 24 h/d) is a simple extension of the preceding information. The number of doses to be given per day is usually determined by the half-life of the drug and the difference between the minimum therapeutic and toxic concentrations (see Therapeutic Window, below).
If it is important to maintain a concentration above the minimum therapeutic level at all times—either a larger dose is given at long intervals or smaller doses at more frequent intervals. If the difference between the toxic and therapeutic concentrations is small, then smaller and more frequent doses must be administered to prevent toxicity.
Loading Dosage
If the therapeutic concentration must be achieved rapidly and the Vd is large, a large loading dose may be needed at the onset of therapy. This can be calculated from the following equation:
![]()
Note that clearance does not enter into this computation. If the loading dose is very large (Vd much larger than blood volume), the dose should be given slowly to prevent toxicity due to excessively high plasma levels during the distribution phase.
Therapeutic Window
The therapeutic window is the safe range between the minimum therapeutic concentration and the minimum toxic concentration of a drug. The concept is used to determine the acceptable range of plasma levels when designing a dosing regimen. Thus, the minimum effective concentration usually determines the desired trough levels of a drug given intermittently, whereas the minimum toxic concentration determines the permissible peak plasma concentration. For example, the drug theophylline has a therapeutic concentration range of 8-20 mg/L but may be toxic at concentrations of more than 15 mg/L. The therapeutic window for a given patient might thus be fixed in the range of 8-16 mg/L (Figure 3-6). Unfortunately, for some drugs the therapeutic and toxic concentrations vary so greatly among patients that it is impossible to predict the therapeutic window in a given patient. Such drugs must be titrated individually in each patient.
FIGURE 3-6

The therapeutic window for theophylline in a typical patient. The minimum effective concentration in this patient was found to be 8 mg/L; the minimum toxic concentration was found to be 16 mg/L. The therapeutic window is indicated by the blue area. To maintain the plasma concentration (Cp) within the window, this drug must be given at least once every half-life (7.5 h in this patient) because the minimum effective concentration is half the minimum toxic concentration and Cp will decay by 50% in 1 half-life. (Note: This concept applies to drugs given in the ordinary, prompt-release form. Slow-release formulations can often be given at longer intervals.)
Adjustment of Dosage When Elimination Is Altered by Disease
Renal disease or reduced cardiac output often reduces the clearance of drugs that depend on renal function. Alteration of clearance by liver disease is less common but may also occur. Impairment of hepatic clearance occurs (for high extraction drugs) when liver blood flow is reduced, as in heart failure, and in severe cirrhosis and other forms of liver failure. The dosage in a patient with renal impairment may be corrected by multiplying the average dosage for a normal person times the ratio of the patient's altered creatinine clearance (CLcr) to normal creatinine clearance (approximately 100 mL/min, or 6 L/h).
![]()
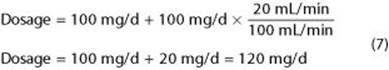
This simplified approach ignores nonrenal routes of clearance that may be significant. If a drug is cleared partly by the kidney and partly by other routes, the Equation 6 should be applied to the part of the dose that is eliminated by the kidney. For example, if a drug is 50% cleared by the kidney and 50% by the liver and the normal dosage is 200 mg/d, the hepatic and renal elimination rates are each 100 mg/d. Therefore, the corrected dosage in a patient with a creatinine clearance of 20 mL/min will be:
Renal function is altered by age and many diseases. Because it is important in the elimination of drugs, assessing renal function is important in estimating dosage in patients. The most important renal variable in drug elimination is glomerular filtration rate (GFR), and creatinine clearance (CLcr) is a convenient approximation of GFR. CLcr can be measured directly, but this requires careful measurement of both serum creatinine concentration and a timed total urine creatinine. A common shortcut that requires only the serum (or plasma) creatinine measurement (Scr) is the use of an equation. One such equation in common use is the Cockcroft-Gault equation:
![]()
The result is multiplied by 0.85 for females. A similar equation for GFR is the MDRD equation:

Skill Keeper 1 Answer: Zero-Order Elimination
(See Chapter 1)
The 3 important drugs that follow zero-order rather than first-order kinetics are ethanol, aspirin, and phenytoin.
Skill Keeper 2 Answer: First-Pass Effect
(See Chapter 1)
The oral route of administration entails passage of the drug through the gastric and intestinal contents, the epithelium and other tissues of the intestinal wall, the portal blood, and the liver before it enters the systemic circulation for distribution to the body. Metabolism by enzymes in any of these tissues, expulsion by drug transporters, and excretion into the bile all may contribute to the first-pass effect of oral administration.
Checklist
When you complete this chapter, you should be able to:
![]() Estimate the half-life of a drug based on its clearance and volume of distribution or from a graph of its plasma concentration over time.
Estimate the half-life of a drug based on its clearance and volume of distribution or from a graph of its plasma concentration over time.
![]() Calculate loading and maintenance dosage regimens for oral or intravenous administration of a drug when given the following information: minimum therapeutic concentration, oral bioavailability, clearance, and volume of distribution.
Calculate loading and maintenance dosage regimens for oral or intravenous administration of a drug when given the following information: minimum therapeutic concentration, oral bioavailability, clearance, and volume of distribution.
![]() Calculate the dosage adjustment required for a patient with impaired renal function.
Calculate the dosage adjustment required for a patient with impaired renal function.
Chapter 3 Summary Table
Major Concept Description Loading dose The dose required to achieve a specific plasma drug concentration level (Cp) with a single administration. Because this requires filling the volume of distribution (Vd), the calculation uses the volume of distribution (Vd) equation as: Loading dose = Cp(target) x Vd and has units of mg Maintenance dose The dose required for regular administration to maintain a target plasma level. Because this requires restoring the amount of drug lost to elimination (clearance, CL), the calculation uses the clearance equation as: Maintenance dose = Cp(target) x CL and has units of mg per time Half-life The half-life concept is useful not only in predicting the time course of falling drug levels after an administration, but also in predicting the time course of increase in drug level when repeated administration is begun—see Figure 3-3. Therapeutic window The therapeutic window is much more useful as a clinical measure of drug safety and as a guide to dosage than the older therapeutic index. The classic therapeutic index, TI, determined from animal measures of therapeutically effective dosage and lethal dosage is inapplicable to human therapeutics, whereas the minimum therapeutic dosage and the minimum toxic dosage is readily determined in clinical trials