Pulmonary Blood Flow
Pulmonary Blood Flow, Pressure, and Resistance Relationships
Pulmonary blood flow is the cardiac output of the right heart, which is equal to the cardiac output of the left heart. The difference is a result of a small amount of coronary venous blood that drains directly into the left ventricle through the thebesian vein (rather than going to the lungs via the pulmonary artery).
Pulmonary blood flow is directly proportional to the pressure gradient between the pulmonary artery and the left atrium and is inversely proportional to the resistance of the pulmonary vasculature (Q = ΔP/R). When compared with the systemic circulation, however, the pulmonary circulation is characterized by much lower pressures and resistances, although blood flow is the same. The reason that pulmonary blood flow can be equal to systemic blood flow is that pulmonary pressures and resistances are proportionately lower than systemic pressures and resistances (see Chapter 4, Table 4-1).
Regulation of Pulmonary Blood Flow
As in other vascular beds, pulmonary blood flow is regulated primarily by altering the resistance of the arterioles. Such changes in resistance are accomplished by changes in the tone of arteriolar smooth muscle; in the pulmonary circulation, these changes are mediated by local vasoactive substances, especially O2.
![]() Hypoxic vasoconstriction. By far, the major factor regulating pulmonary blood flow is the partial pressure of O2 in alveolar gas,
Hypoxic vasoconstriction. By far, the major factor regulating pulmonary blood flow is the partial pressure of O2 in alveolar gas, ![]() . Decreases in
. Decreases in ![]() produce pulmonary vasoconstriction (i.e., hypoxic vasoconstriction). Initially, this effect may seem counterintuitive because in several vascular beds decreases in PO2 produce the exact opposite effect, vasodilation (to increase O2 delivery to the tissue). In the lungs, however, hypoxic vasoconstrictionoccurs as an adaptive mechanism, reducing pulmonary blood flow to poorly ventilated areas where the blood flow would be “wasted.” Thus, pulmonary blood flow is directed away from poorly ventilated regions of the lung, where gas exchange would be inadequate, and toward well-ventilated regions of the lung, where gas exchange will be better.
produce pulmonary vasoconstriction (i.e., hypoxic vasoconstriction). Initially, this effect may seem counterintuitive because in several vascular beds decreases in PO2 produce the exact opposite effect, vasodilation (to increase O2 delivery to the tissue). In the lungs, however, hypoxic vasoconstrictionoccurs as an adaptive mechanism, reducing pulmonary blood flow to poorly ventilated areas where the blood flow would be “wasted.” Thus, pulmonary blood flow is directed away from poorly ventilated regions of the lung, where gas exchange would be inadequate, and toward well-ventilated regions of the lung, where gas exchange will be better.
In certain types of lung disease, hypoxic vasoconstriction serves a protective role because, within limits, blood can be redirected to alveoli that are well oxygenated without changing overall pulmonary vascular resistance. The compensatory mechanism fails, however, if the lung disease is widespread (e.g., multilobar pneumonia); if there are insufficient areas of well-ventilated alveoli, hypoxemia will occur.
The mechanism of hypoxic vasoconstriction involves a direct action of alveolar PO2 on the vascular smooth muscle of pulmonary arterioles. This action can be understood by recalling the proximity of the alveoli to the pulmonary microcirculation. The arterioles and their capillary beds densely surround the alveoli. O2 is highly lipid soluble and, therefore, is quite permeable across cell membranes. When ![]() is normal (at 100 mm Hg), O2diffuses from the alveoli into the nearby arteriolar smooth muscle cells, keeping the arterioles relatively relaxed and dilated. If
is normal (at 100 mm Hg), O2diffuses from the alveoli into the nearby arteriolar smooth muscle cells, keeping the arterioles relatively relaxed and dilated. If ![]() is reduced to values between 100 mm Hg and 70 mm Hg, vascular tone is minimally affected. However, if
is reduced to values between 100 mm Hg and 70 mm Hg, vascular tone is minimally affected. However, if ![]() is reduced below 70 mm Hg, the vascular smooth muscle cells sense this hypoxia, vasoconstrict, and reduce pulmonary blood flow in that region. The mechanism whereby alveolar hypoxia causes contraction of nearby vascular smooth muscle is not precisely understood. It is believed that hypoxia causes depolarization of vascular smooth muscle cells; depolarization opens voltage-gated Ca2+ channels, leading to Ca2+ entry into the cell and contraction.
is reduced below 70 mm Hg, the vascular smooth muscle cells sense this hypoxia, vasoconstrict, and reduce pulmonary blood flow in that region. The mechanism whereby alveolar hypoxia causes contraction of nearby vascular smooth muscle is not precisely understood. It is believed that hypoxia causes depolarization of vascular smooth muscle cells; depolarization opens voltage-gated Ca2+ channels, leading to Ca2+ entry into the cell and contraction.
There is also evidence of a relationship between hypoxic vasoconstriction and nitric oxide (NO) synthesis in the endothelial cells of the pulmonary vasculature. Recall that NO is an endothelial-derived relaxing factor that is synthesized from L-arginine by the action of nitric oxide synthase. NO then activates guanylyl cyclase, leading to production of cyclic guanosine monophosphate (cGMP) and relaxation of vascular smooth muscle. Inhibition of nitric oxide synthase enhances hypoxic vasoconstriction, and inhaled NO reduces, or offsets, hypoxic vasoconstriction.
As described previously, hypoxic vasoconstriction can function locally to redirect blood flow to well-ventilated regions of the lung. It also can operate globally in an entire lung, in which case the vasoconstriction will produce an increase in pulmonary vascular resistance. For example, at high altitude or in persons breathing a low O2 mixture, ![]() is reduced throughout the lungs, not just in one region. The low
is reduced throughout the lungs, not just in one region. The low ![]() produces global vasoconstriction of pulmonary arterioles and an increase in pulmonary vascular resistance. In response to the increase in resistance, pulmonary arterial pressure increases. In chronic hypoxia, the increased pulmonary arterial pressure causes hypertrophy of the right ventricle, which must pump against an increased afterload.
produces global vasoconstriction of pulmonary arterioles and an increase in pulmonary vascular resistance. In response to the increase in resistance, pulmonary arterial pressure increases. In chronic hypoxia, the increased pulmonary arterial pressure causes hypertrophy of the right ventricle, which must pump against an increased afterload.
Fetal circulation is another example of global hypoxic vasoconstriction. Because the fetus does not breathe, ![]() is much lower in the fetus than in the mother, producing vasoconstriction in the fetal lungs. This vasoconstriction increases pulmonary vascular resistance and, accordingly, decreases pulmonary blood flow to approximately 15% of the cardiac output. At birth, the neonate’s first breath increases
is much lower in the fetus than in the mother, producing vasoconstriction in the fetal lungs. This vasoconstriction increases pulmonary vascular resistance and, accordingly, decreases pulmonary blood flow to approximately 15% of the cardiac output. At birth, the neonate’s first breath increases ![]() to 100 mm Hg, hypoxic vasoconstriction is reduced, pulmonary vascular resistance decreases, and pulmonary blood flow increases and eventually equals cardiac output of the left side of the heart (as in the adult).
to 100 mm Hg, hypoxic vasoconstriction is reduced, pulmonary vascular resistance decreases, and pulmonary blood flow increases and eventually equals cardiac output of the left side of the heart (as in the adult).
![]() Other vasoactive substances. In addition to O2, several other substances alter pulmonary vascular resistance. Thromboxane A2, a product of arachidonic acid metabolism (via the cyclooxygenase pathway) in macrophages, leukocytes, and endothelial cells, is produced in response to certain types of lung injury. Thromboxane A2 is a powerful local vasoconstrictor of both arterioles and veins. Prostacyclin(prostaglandin I2), also a product of arachidonic acid metabolism via the cyclooxygenase pathway, is a potent local vasodilator. It is produced by lung endothelial cells. The leukotrienes, another product of arachidonic acid metabolism (via the lipoxygenase pathway), cause airway constriction.
Other vasoactive substances. In addition to O2, several other substances alter pulmonary vascular resistance. Thromboxane A2, a product of arachidonic acid metabolism (via the cyclooxygenase pathway) in macrophages, leukocytes, and endothelial cells, is produced in response to certain types of lung injury. Thromboxane A2 is a powerful local vasoconstrictor of both arterioles and veins. Prostacyclin(prostaglandin I2), also a product of arachidonic acid metabolism via the cyclooxygenase pathway, is a potent local vasodilator. It is produced by lung endothelial cells. The leukotrienes, another product of arachidonic acid metabolism (via the lipoxygenase pathway), cause airway constriction.
Distribution of Pulmonary Blood Flow
The distribution of pulmonary blood flow within the lung is uneven and the distribution can be explained by the effects of gravity. When a person is supine, blood flow is nearly uniform because the entire lung is at the same gravitational level. However, when a person is upright, gravitational effects are not uniform and blood flow is lowest at the apex of the lung (zone 1) and highest at the base of the lung (zone 3). (Gravitational effects increase pulmonary arterial hydrostatic pressure more at the base of the lung than at the apex.)
In Figure 5-26, the pattern of blood flow in the three zones of the lungs is illustrated in a person who is standing. The pressures responsible for driving blood flow in each zone also are shown in the figure. For the following discussion, recall that pressures in the pulmonary vasculature are much lower than in the systemic vasculature.

Figure 5–26 Variation of blood flow (perfusion) in the three zones of the lung. PA, Alveolar pressure; Pa, arterial pressure; PV, venous pressure.
![]() Zone 1. As a result of the gravitational effect, arterial pressure (Pa) at the apex of the lung may be lower than alveolar pressure (PA), which is approximately equal to atmospheric pressure. If Pa is lower than PA, the pulmonary capillaries will be compressed by the higher alveolar pressure outside of them. This compression will cause the capillaries to close, reducing regional blood flow. Normally, in zone 1, arterial pressure is just high enough to prevent this closure, and zone 1 is perfused, albeit at a low flow rate.
Zone 1. As a result of the gravitational effect, arterial pressure (Pa) at the apex of the lung may be lower than alveolar pressure (PA), which is approximately equal to atmospheric pressure. If Pa is lower than PA, the pulmonary capillaries will be compressed by the higher alveolar pressure outside of them. This compression will cause the capillaries to close, reducing regional blood flow. Normally, in zone 1, arterial pressure is just high enough to prevent this closure, and zone 1 is perfused, albeit at a low flow rate.
However, if arterial pressure is decreased (e.g., due to hemorrhage) or if alveolar pressure is increased (e.g., by positive pressure breathing), then PA will be greater than Pa and the blood vessels will be compressed and will close. Under these conditions, zone 1 will be ventilated but not perfused. There can be no gas exchange if there is no perfusion, and zone 1 will become part of the physiologic dead space.
![]() Zone 2. Because of the gravitational effect on hydrostatic pressure, Pa is higher in zone 2 than in zone 1 and higher than PA. Alveolar pressure is still higher than pulmonary venous pressure (PV), however. Although compression of the capillaries does not present a problem in zone 2, blood flow is driven by the difference between arterial and alveolar pressure, not by the difference between arterial and venous pressure (as it is in systemic vascular beds).
Zone 2. Because of the gravitational effect on hydrostatic pressure, Pa is higher in zone 2 than in zone 1 and higher than PA. Alveolar pressure is still higher than pulmonary venous pressure (PV), however. Although compression of the capillaries does not present a problem in zone 2, blood flow is driven by the difference between arterial and alveolar pressure, not by the difference between arterial and venous pressure (as it is in systemic vascular beds).
![]() Zone 3. In zone 3, the pattern is more familiar. The gravitational effect has increased arterial and venous pressures, and both are now higher than alveolar pressure. Blood flow in zone 3 is driven by the difference between arterial pressure and venous pressure, as it is in other vascular beds. In zone 3, the greatest number of capillaries is open and blood flow is highest.
Zone 3. In zone 3, the pattern is more familiar. The gravitational effect has increased arterial and venous pressures, and both are now higher than alveolar pressure. Blood flow in zone 3 is driven by the difference between arterial pressure and venous pressure, as it is in other vascular beds. In zone 3, the greatest number of capillaries is open and blood flow is highest.
Shunts
A shunt refers to a portion of the cardiac output or blood flow that is diverted or rerouted. For example, normally, a small fraction of the pulmonary blood flow bypasses the alveoli (e.g., bronchial blood flow), which is called a physiologic shunt. Several abnormal situations also may occur when there is shunting of blood between the right and left hearts through septal defects. Of these defects, left-to-right shunts are more common.
![]() Physiologic shunt. About 2% of the cardiac output normally bypasses the alveoli—there is a physiologic right-to-left shunt. Part of the physiologic shunt is the bronchial blood flow, which serves the metabolic functions of the bronchi. The other component of the shunt is the small amount of coronary blood flow that drains directly into the left ventricle through the thebesian veins and never perfuses the lungs. Small physiologic shunts are always present, and
Physiologic shunt. About 2% of the cardiac output normally bypasses the alveoli—there is a physiologic right-to-left shunt. Part of the physiologic shunt is the bronchial blood flow, which serves the metabolic functions of the bronchi. The other component of the shunt is the small amount of coronary blood flow that drains directly into the left ventricle through the thebesian veins and never perfuses the lungs. Small physiologic shunts are always present, and ![]() will always be slightly less than
will always be slightly less than ![]() .
.
![]() Right-to-left shunts. Shunting of blood from the right heart to the left heart can occur if there is a defect in the wall between the right and left ventricles. As much as 50% of the cardiac output can be routed from the right ventricle directly to the left ventricle and never be pumped to the lungs for arterialization. In a right-to-left shunt, hypoxemia always occurs because a significant fraction of the cardiac output is not delivered to the lungs for oxygenation. The portion of the cardiac output that is delivered to the lungs for oxygenation is “diluted” by the low O2 shunted blood (Fig. 5-27).
Right-to-left shunts. Shunting of blood from the right heart to the left heart can occur if there is a defect in the wall between the right and left ventricles. As much as 50% of the cardiac output can be routed from the right ventricle directly to the left ventricle and never be pumped to the lungs for arterialization. In a right-to-left shunt, hypoxemia always occurs because a significant fraction of the cardiac output is not delivered to the lungs for oxygenation. The portion of the cardiac output that is delivered to the lungs for oxygenation is “diluted” by the low O2 shunted blood (Fig. 5-27).
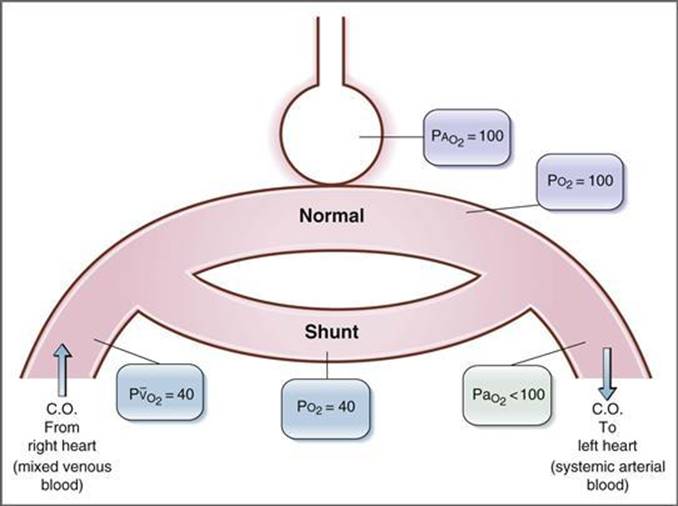
Figure 5–27 Right-to-left shunt. C.O., Cardiac output.
A defining characteristic of the hypoxemia caused by a right-to-left shunt is that it cannot be corrected by having the person breathe a high O2 gas (e.g., 100% O2) because the shunted blood never goes to the lungs to be oxygenated. The shunted blood will continue to dilute the normally oxygenated blood, and no matter how high the alveolar PO2, it cannot offset this dilutional effect. (Furthermore, because hemoglobin saturation is nearly 100% in this range, breathing 100% O2 adds primarily dissolved O2 to pulmonary capillary blood and adds little to the total O2 content of blood.) However, having a person with a right-to-left shunt breathe 100% O2 is a useful diagnostic tool; the magnitude of the shunt can be estimated from the extent of dilution of the oxygenated blood.
Usually, a right-to-left shunt does not cause an appreciable increase in ![]() (although it may seem that it should because of the high CO2 content of the shunted blood).
(although it may seem that it should because of the high CO2 content of the shunted blood). ![]() changes only minimally because the central chemoreceptors are sensitive to changes in
changes only minimally because the central chemoreceptors are sensitive to changes in ![]() . Thus, a small increase in
. Thus, a small increase in ![]() produces an increase in ventilation rate, and the extra CO2 is expired. Chemoreceptors for O2 are not as sensitive as those for CO2 and are not activated until the
produces an increase in ventilation rate, and the extra CO2 is expired. Chemoreceptors for O2 are not as sensitive as those for CO2 and are not activated until the ![]() decreases to less than 60 mm Hg.
decreases to less than 60 mm Hg.
The blood flow through a right-to-left shunt can be calculated with the shunt fraction equation, where flow through the shunt is expressed as a fraction of pulmonary blood flow, or cardiac output, as follows:

where
|
QS |
= blood flow through right-to-left shunt (L/min) |
|
QT |
= cardiac output (L/min) |
|
O2 content (“normal” blood) |
= O2 content of nonshunted blood |
|
O2 content (arterial blood) |
= O2 content of systemic arterial blood |
|
O2 content (mixed venous blood) |
= O2 content of mixed venous blood |
![]() Left-to-right shunts. Left-to-right shunts are more common and do not cause hypoxemia. Among the causes of left-to-right shunts are patent ductus arteriosus and traumatic injury. If blood is shunted from the left side of the heart to the right side of the heart, pulmonary blood flow (right-heart cardiac output) becomes higher than systemic blood flow (left-heart cardiac output). In effect, oxygenated blood that has just returned from the lungs is added directly to the right heart without being delivered to the systemic tissues. Because the right side of the heart normally receives mixed venous blood, the PO2 in blood on the right side of the heart will be elevated.
Left-to-right shunts. Left-to-right shunts are more common and do not cause hypoxemia. Among the causes of left-to-right shunts are patent ductus arteriosus and traumatic injury. If blood is shunted from the left side of the heart to the right side of the heart, pulmonary blood flow (right-heart cardiac output) becomes higher than systemic blood flow (left-heart cardiac output). In effect, oxygenated blood that has just returned from the lungs is added directly to the right heart without being delivered to the systemic tissues. Because the right side of the heart normally receives mixed venous blood, the PO2 in blood on the right side of the heart will be elevated.
Ventilation/Perfusion Ratios
The ventilation/perfusion ratio (![]() ) is the ratio of alveolar ventilation (
) is the ratio of alveolar ventilation (![]() ) to pulmonary blood flow (
) to pulmonary blood flow (![]() ). Matching ventilation to perfusion is critically important for ideal gas exchange: It is useless for alveoli to be ventilated but not perfused, or for alveoli to be perfused but not ventilated.
). Matching ventilation to perfusion is critically important for ideal gas exchange: It is useless for alveoli to be ventilated but not perfused, or for alveoli to be perfused but not ventilated.
Normal Value for (![]() )
)
The normal value for ![]() is 0.8. This value means that alveolar ventilation (L/min) is 80% of the value for pulmonary blood flow (L/min). The term “normal” means that if breathing frequency, tidal volume, and cardiac output all are normal,
is 0.8. This value means that alveolar ventilation (L/min) is 80% of the value for pulmonary blood flow (L/min). The term “normal” means that if breathing frequency, tidal volume, and cardiac output all are normal, ![]() will be 0.8. In turn, if
will be 0.8. In turn, if ![]() is normal, then
is normal, then ![]() will be its normal value of 100 mm Hg and
will be its normal value of 100 mm Hg and ![]() will be its normal value of 40 mm Hg. If
will be its normal value of 40 mm Hg. If ![]() changes due to an alteration of alveolar ventilation or an alteration of pulmonary blood flow, or both, then gas exchange will be less than ideal and the values for
changes due to an alteration of alveolar ventilation or an alteration of pulmonary blood flow, or both, then gas exchange will be less than ideal and the values for ![]() and
and ![]() will change.
will change.
Distribution of ![]() in the Lung
in the Lung
The value of 0.8 for ![]() is an average for the entire lung. In fact, in the three zones of the lung,
is an average for the entire lung. In fact, in the three zones of the lung, ![]() is uneven, just as blood flow is uneven. These variations in
is uneven, just as blood flow is uneven. These variations in ![]() have consequences for
have consequences for ![]() and
and ![]() in blood leaving those zones, as illustrated in Figure 5-28. As already described, regional variations in pulmonary blood flow are caused by gravitational effects: Zone 1 has the lowest blood flow, and zone 3 the highest. Alveolar ventilation also varies in the same direction among the zones of the lung. Ventilation is lower in zone 1 and higher in zone 3, again due to gravitational effects in the upright lung. To visualize how gravity produces differences in regional ventilation, imagine the lung as an accordion that is hung vertically. Between breaths (i.e., at FRC), the weight of the accordion (lung) squeezes air out of the bellows at the base and most of the FRC fills the bellows at the apex. When the next breath is taken, most of the potential space to be ventilated is at the base of the lung, while the apex is already full. However, regional variations in ventilation are not as great as regional variations in blood flow. Therefore, the <
in blood leaving those zones, as illustrated in Figure 5-28. As already described, regional variations in pulmonary blood flow are caused by gravitational effects: Zone 1 has the lowest blood flow, and zone 3 the highest. Alveolar ventilation also varies in the same direction among the zones of the lung. Ventilation is lower in zone 1 and higher in zone 3, again due to gravitational effects in the upright lung. To visualize how gravity produces differences in regional ventilation, imagine the lung as an accordion that is hung vertically. Between breaths (i.e., at FRC), the weight of the accordion (lung) squeezes air out of the bellows at the base and most of the FRC fills the bellows at the apex. When the next breath is taken, most of the potential space to be ventilated is at the base of the lung, while the apex is already full. However, regional variations in ventilation are not as great as regional variations in blood flow. Therefore, the <![]() ratio is highest in zone 1 and lowest in zone 3, with the average value for the entire lung being 0.8.
ratio is highest in zone 1 and lowest in zone 3, with the average value for the entire lung being 0.8.
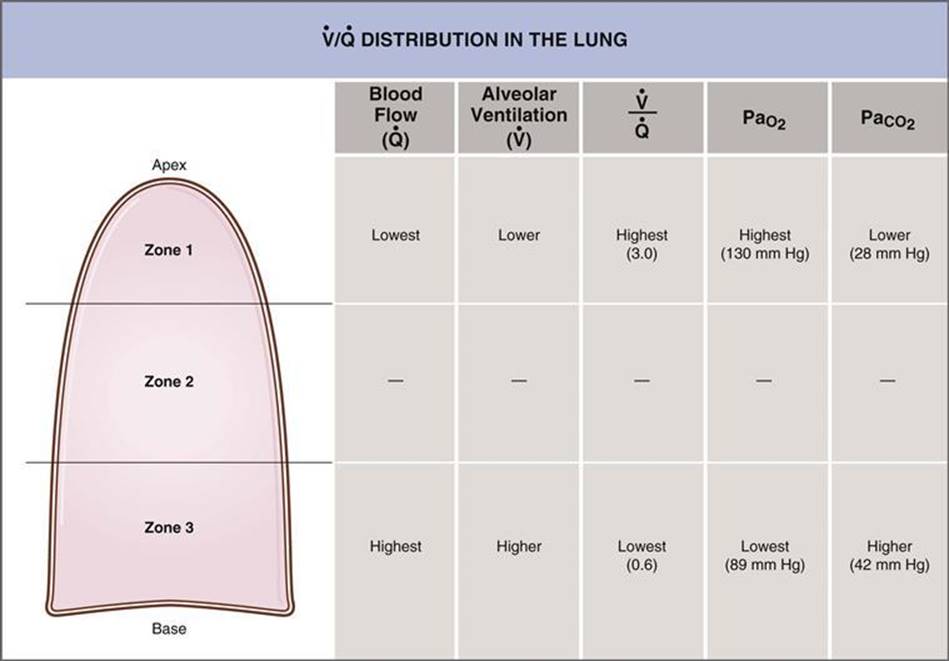
Figure 5–28 Variation in ventilation/perfusion (![]() ) in the three zones of the lung. The effects of regional differences in
) in the three zones of the lung. The effects of regional differences in ![]() on
on ![]() and
and ![]() also are shown.
also are shown.
These regional differences in ![]() produce regional differences in
produce regional differences in ![]() and
and ![]() . The O2-CO2 diagram derived from the alveolar gas equation (see Fig. 5-5) is repeated in Figure 5-29. Notice that the regional differences in
. The O2-CO2 diagram derived from the alveolar gas equation (see Fig. 5-5) is repeated in Figure 5-29. Notice that the regional differences in ![]() are much greater than regional differences in
are much greater than regional differences in ![]() . In zone 1, where
. In zone 1, where ![]() is highest,
is highest, ![]() is highest and
is highest and ![]() is lowest. In zone 3, where
is lowest. In zone 3, where ![]() is lowest,
is lowest, ![]() is lowest and
is lowest and ![]() is highest. These regional differences are present in healthy lungs, and the blood leaving the lungs via the pulmonary vein (representing the sum of blood from all zones) has an average
is highest. These regional differences are present in healthy lungs, and the blood leaving the lungs via the pulmonary vein (representing the sum of blood from all zones) has an average ![]() of 100 mm Hg and an average
of 100 mm Hg and an average ![]() of 40 mm Hg.
of 40 mm Hg.
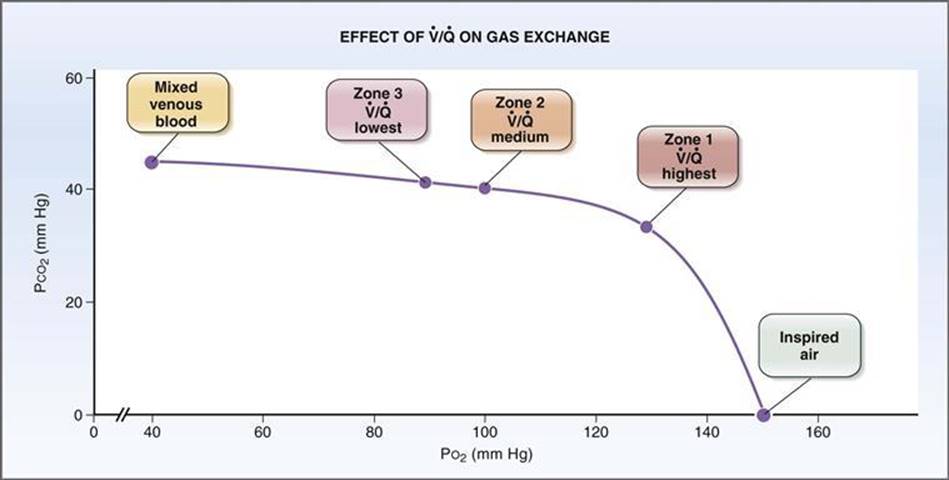
Figure 5–29 Effect of regional differences in ventilation/perfusion (![]() ) on PCO2 and PO2. Regional differences in PO2 are much greater than the regional differences in PCO2.
) on PCO2 and PO2. Regional differences in PO2 are much greater than the regional differences in PCO2.
Ventilation/Perfusion Defects
Normally, as previously described, there is ventilation/perfusion matching: Ventilated alveoli are close to perfused capillaries, and this arrangement provides for ideal gas exchange. Although there are regional variations in the ![]() ratio, the average value for the lung is about 0.8.
ratio, the average value for the lung is about 0.8.
A mismatch of ventilation and perfusion, called ![]() mismatch, or
mismatch, or ![]() defect, results in abnormal gas exchange. A
defect, results in abnormal gas exchange. A ![]() defect can be caused by ventilation of lung regions that are not perfused (dead space), perfusion of lung regions that are not ventilated (shunt), and every possibility in between (Figs. 5-30 and 5-31). In some lung diseases, the entire range of possible
defect can be caused by ventilation of lung regions that are not perfused (dead space), perfusion of lung regions that are not ventilated (shunt), and every possibility in between (Figs. 5-30 and 5-31). In some lung diseases, the entire range of possible ![]() defects is exhibited.
defects is exhibited.

Figure 5–30 Ventilation-perfusion (![]() ) defects.
) defects. ![]() defects include dead space, high
defects include dead space, high ![]() , low
, low ![]() , and shunt.
, and shunt.

Figure 5–31 Effect of ventilation/perfusion (![]() ) defects on gas exchange in the lungs. With airway obstruction, the composition of systemic arterial blood approaches that of mixed venous blood. With pulmonary embolus, the composition of alveolar air approaches that of inspired air.
) defects on gas exchange in the lungs. With airway obstruction, the composition of systemic arterial blood approaches that of mixed venous blood. With pulmonary embolus, the composition of alveolar air approaches that of inspired air.
![]() Dead space (
Dead space (![]() = ∞). Dead space is ventilation of lung regions that are not perfused. This ventilation is wasted, or “dead.” No gas exchange is possible in dead space because there is no blood flow to receive O2 from alveolar gas or add CO2 to alveolar gas. Dead space is illustrated by pulmonary embolism, in which blood flow to a portion of the lung (or even the entire lung) is occluded. In regions of dead space, because no gas exchange occurs, alveolar gas has the same composition as humidified inspired air:
= ∞). Dead space is ventilation of lung regions that are not perfused. This ventilation is wasted, or “dead.” No gas exchange is possible in dead space because there is no blood flow to receive O2 from alveolar gas or add CO2 to alveolar gas. Dead space is illustrated by pulmonary embolism, in which blood flow to a portion of the lung (or even the entire lung) is occluded. In regions of dead space, because no gas exchange occurs, alveolar gas has the same composition as humidified inspired air: ![]() is 150 mm Hg and
is 150 mm Hg and ![]() is 0.
is 0.
![]() High
High ![]() . Regions of high
. Regions of high ![]() have high ventilation relative to perfusion, usually because blood flow is decreased. Unlike dead space, which has no perfusion, high
have high ventilation relative to perfusion, usually because blood flow is decreased. Unlike dead space, which has no perfusion, high ![]() regions have some blood flow. Because ventilation is high relative to perfusion, pulmonary capillary blood from these regions has a high PO2 and a low PCO2.
regions have some blood flow. Because ventilation is high relative to perfusion, pulmonary capillary blood from these regions has a high PO2 and a low PCO2.
![]() Low
Low ![]() . Regions of low
. Regions of low ![]() have low ventilation relative to perfusion, usually because ventilation is decreased. Unlike shunt, which has no ventilation, low
have low ventilation relative to perfusion, usually because ventilation is decreased. Unlike shunt, which has no ventilation, low ![]() regions have some ventilation. Because ventilation is low relative to perfusion, pulmonary capillary blood from these regions has a low PO2 and high PCO2.
regions have some ventilation. Because ventilation is low relative to perfusion, pulmonary capillary blood from these regions has a low PO2 and high PCO2.
![]() Shunt (
Shunt (![]() = 0). Right-to-left shunt is perfusion of lung regions that are not ventilated. No gas exchange is possible in regions of shunt because there is no ventilation to deliver O2 to the blood or carry away CO2 from the blood. Shunt is illustrated by airway obstruction and right-to-left cardiac shunts. Because no gas exchange can occur with a shunt, pulmonary capillary blood from these regions has the same composition as mixed venous blood:
= 0). Right-to-left shunt is perfusion of lung regions that are not ventilated. No gas exchange is possible in regions of shunt because there is no ventilation to deliver O2 to the blood or carry away CO2 from the blood. Shunt is illustrated by airway obstruction and right-to-left cardiac shunts. Because no gas exchange can occur with a shunt, pulmonary capillary blood from these regions has the same composition as mixed venous blood: ![]() is 40 mm Hg, and
is 40 mm Hg, and ![]() is 46 mm Hg.
is 46 mm Hg.