 One of the most important ailments that must be treated by the physician is cardiac failure (“heart failure”). This can result from any heart condition that reduces the ability of the heart to pump blood. The cause is usually decreased contractility of the myocardium resulting from diminished coronary blood flow. However, failure can also be caused by damaged heart valves, external pressure around the heart, vitamin B deficiency, primary cardiac muscle disease, or any other abnormality that makes the heart a hypoeffective pump.
In this chapter, we discuss mainly cardiac failure caused by ischemic heart disease resulting from partial blockage of the coronary blood vessels, the most common cause of heart failure. In Chapter 23, we discuss valvular and congenital heart disease.
Definition of Cardiac Failure
The term “cardiac failure” means simply failure of the heart to pump enough blood to satisfy the needs of the body.
Circulatory Dynamics in Cardiac Failure
Acute Effects of Moderate Cardiac Failure
If a heart suddenly becomes severely damaged, such as by myocardial infarction, the pumping ability of the heart is immediately depressed. As a result, two main effects occur: (1) reduced cardiac output and (2) damming of blood in the veins, resulting in increased venous pressure.
The progressive changes in heart pumping effectiveness at different times after an acute myocardial infarction are shown graphically in Figure 22-1. The top curve of this figure shows a normal cardiac output curve. Point A on this curve is the normal operating point, showing a normal cardiac output under resting conditions of 5 L/min and a right atrial pressure of 0 mm Hg.
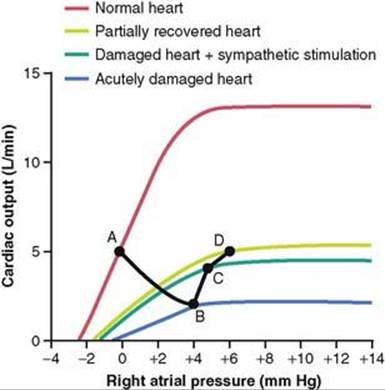
Figure 22-1 Progressive changes in the cardiac output curve after acute myocardial infarction. Both the cardiac output and right atrial pressure change progressively from point A to point D (illustrated by the black line) over a period of seconds, minutes, days, and weeks.
Immediately after the heart becomes damaged, the cardiac output curve becomes greatly lowered, falling to the lowest curve at the bottom of the graph. Within a few seconds, a new circulatory state is established at point B, illustrating that the cardiac output has fallen to 2 L/min, about two-fifths normal, whereas the right atrial pressure has risen to +4 mm Hg because venous blood returning to the heart from the body is dammed up in the right atrium. This low cardiac output is still sufficient to sustain life for perhaps a few hours, but it is likely to be associated with fainting. Fortunately, this acute stage usually lasts for only a few seconds because sympathetic nervous reflexes occur almost immediately and compensate, to a great extent, for the damaged heart, as follows.
Compensation for Acute Cardiac Failure by Sympathetic Nervous Reflexes
When the cardiac output falls precariously low, many of the circulatory reflexes discussed in Chapter 18 are rapidly activated. The best known of these is the baroreceptor reflex, which is activated by diminished arterial pressure. The chemoreceptor reflex, the central nervous system ischemic response, and even reflexes that originate in the damaged heart also likely contribute to activating the sympathetic nervous system. The sympathetics therefore become strongly stimulated within a few seconds, and the parasympathetic nervous signals to the heart become reciprocally inhibited at the same time.
Strong sympathetic stimulation has major effects on the heart itself and on the peripheral vasculature. If all the ventricular musculature is diffusely damaged but is still functional, sympathetic stimulation strengthens this damaged musculature. If part of the muscle is nonfunctional and part of it is still normal, the normal muscle is strongly stimulated by sympathetic stimulation, in this way partially compensating for the nonfunctional muscle. Thus, the heart becomes a stronger pump as a result of sympathetic stimulation. This effect is illustrated in Figure 22-1, showing after sympathetic compensation about twofold elevation of the very low cardiac output curve.
Sympathetic stimulation also increases venous return because it increases the tone of most of the blood vessels of the circulation, especially the veins, raising the mean systemic filling pressure to 12 to 14 mm Hg, almost 100 percent above normal. As discussed in Chapter 20, this increased filling pressure greatly increases the tendency for blood to flow from the veins back into the heart. Therefore, the damaged heart becomes primed with more inflowing blood than usual, and the right atrial pressure rises still further, which helps the heart to pump still larger quantities of blood. Thus, in Figure 22-1, the new circulatory state is depicted by point C, showing a cardiac output of 4.2 L/min and a right atrial pressure of 5 mm Hg.
The sympathetic reflexes become maximally developed in about 30 seconds. Therefore, a person who has a sudden, moderate heart attack might experience nothing more than cardiac pain and a few seconds of fainting. Shortly thereafter, with the aid of the sympathetic reflex compensations, the cardiac output may return to a level adequate to sustain the person if he or she remains quiet, although the pain might persist.
Chronic Stage of Failure—Fluid Retention and Compensated Cardiac Output
After the first few minutes of an acute heart attack, a prolonged semichronic state begins, characterized mainly by two events: (1) retention of fluid by the kidneys and (2) varying degrees of recovery of the heart itself over a period of weeks to months, as illustrated by the light green curve in Figure 22-1; this was also discussed in Chapter 21.
Renal Retention of Fluid and Increase in Blood Volume Occur for Hours to Days
A low cardiac output has a profound effect on renal function, sometimes causing anuria when the cardiac output falls to 50 to 60 percent of normal. In general, the urine output remains below normal as long as the cardiac output and arterial pressure remain significantly less than normal; urine output usually does not return all the way to normal after an acute heart attack until the cardiac output and arterial pressure rise almost to normal levels.
Moderate Fluid Retention in Cardiac Failure Can Be Beneficial
Many cardiologists have considered fluid retention always to have a detrimental effect in cardiac failure. But it is now known that a moderate increase in body fluid and blood volume is an important factor in helping to compensate for the diminished pumping ability of the heart by increasing the venous return. The increased blood volume increases venous return in two ways: First, it increases the mean systemic filling pressure, which increases the pressure gradient for causing venous flow of blood toward the heart. Second, it distends the veins, which reduces the venous resistance and allows even more ease of flow of blood to the heart.
If the heart is not too greatly damaged, this increased venous return can often fully compensate for the heart’s diminished pumping ability—enough that even when the heart’s pumping ability is reduced to as low as 40 to 50 percent of normal, the increased venous return can often cause entirely nearly normal cardiac output as long as the person remains in a quiet resting state.
When the heart’s pumping capability is reduced further, blood flow to the kidneys finally becomes too low for the kidneys to excrete enough salt and water to equal salt and water intake. Therefore, fluid retention begins and continues indefinitely, unless major therapeutic procedures are used to prevent this. Furthermore, because the heart is already pumping at its maximum pumping capacity, this excess fluid no longer has a beneficial effect on the circulation. Instead, the fluid retention increases the workload on the already damaged heart and severe edema develops throughout the body, which can be very detrimental in itself and can lead to death.
Detrimental Effects of Excess Fluid Retention in Severe Cardiac Failure
In contrast to the beneficial effects of moderate fluid retention in cardiac failure, in severe failure extreme excesses of fluid can have serious physiological consequences. They include (1) increasing the workload on the damaged heart, (2) overstretching of the heart, thus weakening the heart still more; (3) filtration of fluid into the lungs, causing pulmonary edema and consequent deoxygenation of the blood; and (4) development of extensive edema in most parts of the body. These detrimental effects of excessive fluid are discussed in later sections of this chapter.
Recovery of the Myocardium After Myocardial Infarction
After a heart becomes suddenly damaged as a result of myocardial infarction, the natural reparative processes of the body begin to help restore normal cardiac function. For instance, a new collateral blood supply begins to penetrate the peripheral portions of the infarcted area of the heart, often causing much of the heart muscle in the fringe areas to become functional again. Also, the undamaged portion of the heart musculature hypertrophies, in this way offsetting much of the cardiac damage.
The degree of recovery depends on the type of cardiac damage, and it varies from no recovery to almost complete recovery. After acute myocardial infarction, the heart ordinarily recovers rapidly during the first few days and weeks and achieves most of its final state of recovery within 5 to 7 weeks, although mild degrees of additional recovery can continue for months.
Cardiac Output Curve After Partial Recovery
Figure 22-1 shows function of the partially recovered heart a week or so after acute myocardial infarction. By this time, considerable fluid has been retained in the body and the tendency for venous return has increased markedly as well; therefore, the right atrial pressure has risen even more. As a result, the state of the circulation is now changed from point C to point D, which shows a normal cardiac output of 5 L/min but right atrial pressure increased to 6 mm Hg.
Because the cardiac output has returned to normal, renal output of fluid also returns to normal and no further fluid retention occurs, except that the retention of fluid that has already occurred continues to maintain moderate excesses of fluid. Therefore, except for the high right atrial pressure represented by point D in this figure, the person now has essentially normal cardiovascular dynamics as long as he or she remains at rest.
If the heart recovers to a significant extent and if adequate fluid volume has been retained, the sympathetic stimulation gradually abates toward normal for the following reasons: The partial recovery of the heart can elevate the cardiac output curve the same as sympathetic stimulation can. Therefore, as the heart recovers even slightly, the fast pulse rate, cold skin, and pallor resulting from sympathetic stimulation in the acute stage of cardiac failure gradually disappear.
Summary of the Changes That Occur After Acute Cardiac Failure—“Compensated Heart Failure”
To summarize the events discussed in the past few sections describing the dynamics of circulatory changes after an acute, moderate heart attack, we can divide the stages into (1) the instantaneous effect of the cardiac damage; (2) compensation by the sympathetic nervous system, which occurs mainly within the first 30 seconds to 1 minute; and (3) chronic compensations resulting from partial heart recovery and renal retention of fluid. All these changes are shown graphically by the black line in Figure 22-1. The progression of this line shows the normal state of the circulation (point A), the state a few seconds after the heart attack but before sympathetic reflexes have occurred (point B), the rise in cardiac output toward normal caused by sympathetic stimulation (point C), and final return of the cardiac output to almost normal after several days to several weeks of partial cardiac recovery and fluid retention (point D). This final state is called compensated heart failure.
Compensated Heart Failure
Note especially in Figure 22-1 that the maximum pumping ability of the partly recovered heart, as depicted by the plateau level of the light green curve, is still depressed to less than one-half normal. This demonstrates that an increase in right atrial pressure can maintain the cardiac output at a normal level despite continued weakness of the heart. Thus, many people, especially older people, have normal resting cardiac outputs but mildly to moderately elevated right atrial pressures because of various degrees of “compensated heart failure.” These persons may not know that they have cardiac damage because the damage often has occurred a little at a time, and the compensation has occurred concurrently with the progressive stages of damage.
When a person is in compensated heart failure, any attempt to perform heavy exercise usually causes immediate return of the symptoms of acute failure because the heart is not able to increase its pumping capacity to the levels required for the exercise. Therefore, it is said that the cardiac reserve is reduced in compensated heart failure. This concept of cardiac reserve is discussed more fully later in the chapter.
Dynamics of Severe Cardiac Failure—Decompensated Heart Failure
If the heart becomes severely damaged, no amount of compensation, either by sympathetic nervous reflexes or by fluid retention, can make the excessively weakened heart pump a normal cardiac output. As a consequence, the cardiac output cannot rise high enough to make the kidneys excrete normal quantities of fluid. Therefore, fluid continues to be retained, the person develops more and more edema, and this state of events eventually leads to death. This is called decompensated heart failure. Thus, the main cause of decompensated heart failure is failure of the heart to pump sufficient blood to make the kidneys excrete daily the necessary amounts of fluid.
Graphical Analysis of Decompensated Heart Failure
Figure 22-2 shows greatly depressed cardiac output at different times (points A to F) after the heart has become severely weakened. Point A on this curve represents the approximate state of the circulation before any compensation has occurred, and point B, the state a few minutes later after sympathetic stimulation has compensated as much as it can but before fluid retention has begun. At this time, the cardiac output has risen to 4 L/min and the right atrial pressure has risen to 5 mm Hg. The person appears to be in reasonably good condition, but this state will not remain stable because the cardiac output has not risen high enough to cause adequate kidney excretion of fluid; therefore, fluid retention continues and can eventually be the cause of death. These events can be explained quantitatively in the following way.
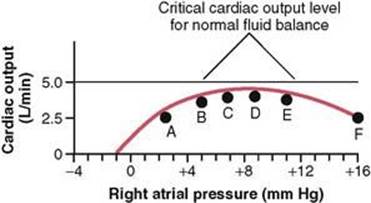
Figure 22-2 Greatly depressed cardiac output that indicates decompensated heart disease. Progressive fluid retention raises the right atrial pressure over a period of days, and the cardiac output progresses from point A to point F, until death occurs.
Note the straight line in Figure 22-2, at a cardiac output level of 5 L/min. This is approximately the critical cardiac output level that is required in the normal adult person to make the kidneys re-establish normal fluid balance—that is, for the output of salt and water to be as great as the intake of these. At any cardiac output below this level, all the fluid-retaining mechanisms discussed in the earlier section remain in play and the body fluid volume increases progressively. And because of this progressive increase in fluid volume, the mean systemic filling pressure of the circulation continues to rise; this forces progressively increasing quantities of blood from the person’s peripheral veins into the right atrium, thus increasing the right atrial pressure. After 1 day or so, the state of the circulation changes in Figure 22-2from point B to point C—the right atrial pressure rising to 7 mm Hg and the cardiac output to 4.2 L/min. Note again that the cardiac output is still not high enough to cause normal renal output of fluid; therefore, fluid continues to be retained. After another day or so, the right atrial pressure rises to 9 mm Hg, and the circulatory state becomes that depicted by point D. Still, the cardiac output is not enough to establish normal fluid balance.
After another few days of fluid retention, the right atrial pressure has risen still further, but by now, cardiac function is beginning to decline toward a lower level. This decline is caused by overstretch of the heart, edema of the heart muscle, and other factors that diminish the heart’s pumping performance. It is now clear that further retention of fluid will be more detrimental than beneficial to the circulation. Yet the cardiac output still is not high enough to bring about normal renal function, so fluid retention not only continues but accelerates because of the falling cardiac output (and falling arterial pressure that also occurs). Consequently, within a few days, the state of the circulation has reached point F on the curve, with the cardiac output now less than 2.5 L/min and the right atrial pressure 16 mm Hg. This state has approached or reached incompatibility with life, and the patient dies unless this chain of events can be reversed. This state of heart failure in which the failure continues to worsen is called decompensated heart failure.
Thus, one can see from this analysis that failure of the cardiac output (and arterial pressure) to rise to the critical level required for normal renal function results in (1) progressive retention of more and more fluid, which causes (2) progressive elevation of the mean systemic filling pressure, and (3) progressive elevation of the right atrial pressure until finally the heart is so overstretched or so edematous that it cannot pump even moderate quantities of blood and, therefore, fails completely. Clinically, one detects this serious condition of decompensation principally by the progressing edema, especially edema of the lungs, which leads to bubbling rales (a crackling sound) in the lungs and to dyspnea (air hunger). Lack of appropriate therapy when this state of events occurs rapidly leads to death.
Treatment of Decompensation
The decompensation process can often be stopped by (1) strengthening the heart in any one of several ways, especially by administration of a cardiotonic drug, such as digitalis, so that the heart becomes strong enough to pump adequate quantities of blood required to make the kidneys function normally again, or (2) administering diuretic drugs to increase kidney excretion while at the same time reducing water and salt intake, which brings about a balance between fluid intake and output despite low cardiac output.
Both methods stop the decompensation process by re-establishing normal fluid balance so that at least as much fluid leaves the body as enters it.
Mechanism of Action of the Cardiotonic Drugs Such as Digitalis
Cardiotonic drugs, such as digitalis, when administered to a person with a healthy heart, have little effect on increasing the contractile strength of the cardiac muscle. However, when administered to a person with a chronically failing heart, the same drugs can sometimes increase the strength of the failing myocardium as much as 50 to 100 percent. Therefore, they are one of the mainstays of therapy in chronic heart failure.
Digitalis and other cardiotonic glycosides are believed to strengthen heart contractions by increasing the quantity of calcium ions in muscle fibers. This effect is likely due to inhibition of sodium-potassium ATPase in cardiac cell membranes. Inhibition of the sodium-potassium pump increases intracellular sodium concentration and slows the sodium-calcium exchange pump, which extrudes calcium from the cell in exchange for sodium. Because the sodium-calcium exchange pump relies on a high sodium gradient across the cell membrane, accumulation of sodium inside the cell reduces its activity.
In the failing heart muscle, the sarcoplasmic reticulum fails to accumulate normal quantities of calcium and, therefore, cannot release enough calcium ions into the free-fluid compartment of the muscle fibers to cause full contraction of the muscle. The effect of digitalis to depress the sodium-calcium exchange pump and raise calcium ion concentration in cardiac muscle provides the extra calcium needed to increase the muscle contractile force. Therefore, it is usually beneficial to depress the calcium pumping mechanism a moderate amount using digitalis, allowing the muscle fiber intracellular calcium level to rise slightly.
Unilateral Left Heart Failure
In the discussions thus far in this chapter, we have considered failure of the heart as a whole. Yet, in a large number of patients, especially those with early acute failure, left-sided failure predominates over right-sided failure, and, in rare instances, the right side fails without significant failure of the left side. Therefore, we need to discuss the special features of unilateral heart failure.
When the left side of the heart fails without concomitant failure of the right side, blood continues to be pumped into the lungs with usual right heart vigor, whereas it is not pumped adequately out of the lungs by the left heart into the systemic circulation. As a result, the mean pulmonary filling pressure rises because of shift of large volumes of blood from the systemic circulation into the pulmonary circulation.
As the volume of blood in the lungs increases, the pulmonary capillary pressure increases, and if this rises above a value approximately equal to the colloid osmotic pressure of the plasma, about 28 mm Hg, fluid begins to filter out of the capillaries into the lung interstitial spaces and alveoli, resulting in pulmonary edema.
Thus, among the most important problems of left heart failure are pulmonary vascular congestion and pulmonary edema. In severe, acute left heart failure, pulmonary edema occasionally occurs so rapidly that it can cause death by suffocation in 20 to 30 minutes, which we discuss later in the chapter.
Low-Output Cardiac Failure-Cardiogenic Shock
In many instances after acute heart attacks and often after prolonged periods of slow progressive cardiac deterioration, the heart becomes incapable of pumping even the minimal amount of blood flow required to keep the body alive. Consequently, the body tissues begin to suffer and even to deteriorate, often leading to death within a few hours to a few days. The picture then is one of circulatory shock, as explained in Chapter 24. Even the cardiovascular system suffers from lack of nutrition, and it, too (along with the remainder of the body), deteriorates, thus hastening death. This circulatory shock syndrome caused by inadequate cardiac pumping is called cardiogenic shock or simply cardiac shock. Once a person develops cardiogenic shock, the survival rate is often less than 30 percent even with appropriate medical care.
Vicious Circle of Cardiac Deterioration in Cardiogenic Shock
The discussion of circulatory shock in Chapter 24 emphasizes the tendency for the heart to become progressively more damaged when its coronary blood supply is reduced during the course of the shock. That is, the low arterial pressure that occurs during shock reduces the coronary blood supply even more. This makes the heart still weaker, which makes the arterial pressure fall still more, which makes the shock progressively worse, the process eventually becoming a vicious circle of cardiac deterioration. In cardiogenic shock caused by myocardial infarction, this problem is greatly compounded by already existing coronary vessel blockage. For instance, in a healthy heart, the arterial pressure usually must be reduced below about 45 mm Hg before cardiac deterioration sets in. However, in a heart that already has a blocked major coronary vessel, deterioration begins when the coronary arterial pressure falls below 80 to 90 mm Hg. In other words, even a small decrease in arterial pressure can now set off a vicious circle of cardiac deterioration. For this reason, in treating myocardial infarction, it is extremely important to prevent even short periods of hypotension.
Physiology of Treatment
Often a patient dies of cardiogenic shock before the various compensatory processes can return the cardiac output (and arterial pressure) to a life-sustaining level. Therefore, treatment of this condition is one of the most important problems in the management of acute heart attacks.
Immediate administration of digitalis is often used for strengthening the heart if the ventricular muscle shows signs of deterioration. Also, infusion of whole blood, plasma, or a blood pressure–raising drug is used to sustain the arterial pressure. If the arterial pressure can be elevated high enough, the coronary blood flow often will increase enough to prevent the vicious circle of deterioration. And this allows enough time for appropriate compensatory mechanisms in circulatory system to correct the shock.
Some success has also been achieved in saving the lives of patients in cardiogenic shock by using one of the following procedures: (1) surgically removing the clot in the coronary artery, often in combination with coronary bypass graft, or (2) catheterizing the blocked coronary artery and infusing either streptokinase or tissue-type plasminogen activator enzymes that cause dissolution of the clot. The results are occasionally astounding when one of these procedures is instituted within the first hour of cardiogenic shock but of little, if any, benefit after 3 hours.
Edema in Patients with Cardiac Failure
Inability of Acute Cardiac Failure to Cause Peripheral Edema
Acute left heart failure can cause rapid congestion of the lungs, with development of pulmonary edema and even death within minutes to hours.
However, either left or right heart failure is very slow to cause peripheral edema. This can best be explained by referring to Figure 22-3. When a previously healthy heart acutely fails as a pump, the aortic pressure falls and the right atrial pressure rises. As the cardiac output approaches zero, these two pressures approach each other at an equilibrium value of about 13 mm Hg. Capillary pressure also falls from its normal value of 17 mm Hg to the new equilibrium pressure of 13 mm Hg. Thus, severe acute cardiac failure often causes a fall in peripheral capillary pressure rather than a rise. Therefore, animal experiments, as well as experience in humans, show that acute cardiac failure almost never causes immediate development of peripheral edema.
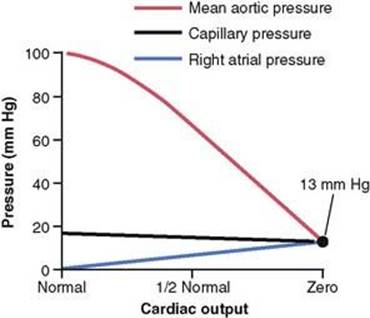
Figure 22-3 Progressive changes in mean aortic pressure, peripheral tissue capillary pressure, and right atrial pressure as the cardiac output falls from normal to zero.
Long-Term Fluid Retention by the Kidneys— the Cause of Peripheral Edema in Persisting Heart Failure
After the first day or so of overall heart failure or of right-ventricular heart failure, peripheral edema does begin to occur principally because of fluid retention by the kidneys. The retention of fluid increases the mean systemic filling pressure, resulting in increased tendency for blood to return to the heart. This elevates the right atrial pressure to a still higher value and returns the arterial pressure back toward normal. Therefore, the capillary pressure now also rises markedly, thus causing loss of fluid into the tissues and development of severe edema.
There are several known causes of the reduced renal output of urine during cardiac failure.
1. Decreased glomerular filtration rate. A decrease in cardiac output has a tendency to reduce the glomerular pressure in the kidneys because of (1) reduced arterial pressure and (2) intense sympathetic constriction of the afferent arterioles of the kidney. As a consequence, except in the mildest degrees of heart failure, the glomerular filtration rate becomes less than normal. It is clear from the discussion of kidney function in Chapters 26 through 29 that even a slight decrease in glomerular filtration often markedly decreases urine output. When the cardiac output falls to about one-half normal, this can result in almost complete anuria.
2. Activation of the renin-angiotensin system and increased reabsorption of water and salt by the renal tubules. The reduced blood flow to the kidneys causes marked increase in renin secretion by the kidneys, and this in turn increases the formation of angiotensin II, as described in Chapter 19. The angiotensin in turn has a direct effect on the arterioles of the kidneys to decrease further the blood flow through the kidneys, which reduces the pressure in the peritubular capillaries surrounding the renal tubules, promoting greatly increased reabsorption of both water and salt from the tubules. Angiotensin also acts directly on the renal tubular epithelial cells to stimulate reabsorption of salt and water. Therefore, loss of water and salt into the urine decreases greatly, and large quantities of salt and water accumulate in the blood and interstitial fluids everywhere in the body.
3. Increased aldosterone secretion. In the chronic stage of heart failure, large quantities of aldosterone are secreted by the adrenal cortex. This results mainly from the effect of angiotensin to stimulate aldosterone secretion by the adrenal cortex. But some of the increase in aldosterone secretion often results from increased plasma potassium. Excess potassium is one of the most powerful stimuli known for aldosterone secretion, and the potassium concentration rises in response to reduced renal function in cardiac failure.
The elevated aldosterone level further increases the reabsorption of sodium from the renal tubules. This in turn leads to a secondary increase in water reabsorption for two reasons: First, as the sodium is reabsorbed, it reduces the osmotic pressure in the tubules but increases the osmotic pressure in the renal interstitial fluids; these changes promote osmosis of water into the blood. Second, the absorbed sodium and anions that go with the sodium, mainly chloride ions, increase the osmotic concentration of the extracellular fluid everywhere in the body. This elicits antidiuretic hormone secretion by the hypothalamic-posterior pituitary gland system (discussed in Chapter 29). The antidiuretic hormone in turn promotes still greater increase in tubular reabsorption of water.
4. Activation of the sympathetic nervous system. As discussed previously, heart failure causes marked activation of the sympathetic nervous system, which in turn has several effects that lead to salt and water retention by the kidneys: (1) constriction of renal afferent arterioles, which reduces glomerular filtration rate; (2) stimulation of renal tubular reabsorption of salt and water by activation of alpha-adrenergic receptors on tubular epithelial cells; (3) stimulation of renin release and angiotensin II formation, which increases renal tubular reabsorption; and (4) stimulation of antidiuretic hormone release from the posterior pituitary, which then increases water reabsorption by the renal tubules. These effects of sympathetic stimulation are discussed in more detail in Chapters 26 and 27.
Role of Atrial Natriuretic Peptide to Delay Onset of Cardiac Decompensation
Atrial natriuretic peptide (ANP) is a hormone released by the atrial walls of the heart when they become stretched. Because heart failure almost always increases both the right and left atrial pressures that stretch the atrial walls, the circulating levels of ANP in the blood may increase 5- to 10-fold in severe heart failure. The ANP in turn has a direct effect on the kidneys to increase greatly their excretion of salt and water. Therefore, ANP plays a natural role to help prevent extreme congestive symptoms during cardiac failure. The renal effects of ANP are discussed in Chapter 29.
Acute Pulmonary Edema in Late-Stage Heart Failure—Another Lethal Vicious Circle
A frequent cause of death in heart failure is acute pulmonary edema occurring in patients who have already had chronic heart failure for a long time. When this occurs in a person without new cardiac damage, it usually is set off by some temporary overload of the heart, such as might result from a bout of heavy exercise, some emotional experience, or even a severe cold. The acute pulmonary edema is believed to result from the following vicious circle:
1. A temporarily increased load on the already weak left ventricle initiates the vicious circle. Because of limited pumping capacity of the left heart, blood begins to dam up in the lungs.
2. The increased blood in the lungs elevates the pulmonary capillary pressure, and a small amount of fluid begins to transude into the lung tissues and alveoli.
3. The increased fluid in the lungs diminishes the degree of oxygenation of the blood.
4. The decreased oxygen in the blood further weakens the heart and also weakens the arterioles everywhere in the body, thus causing peripheral vasodilation.
5. The peripheral vasodilation increases venous return of blood from the peripheral circulation still more.
6. The increased venous return further increases the damming of the blood in the lungs, leading to still more transudation of fluid, more arterial oxygen desaturation, more venous return, and so forth. Thus, a vicious circle has been established.
Once this vicious circle has proceeded beyond a certain critical point, it will continue until death of the patient unless heroic therapeutic measures are used within minutes. The types of heroic therapeutic measures that can reverse the process and save the patient’s life include the following:
1. Putting tourniquets on both arms and legs to sequester much of the blood in the veins and, therefore, decrease the workload on the left side of the heart
2. Giving a rapidly acting diuretic, such as furosemide, to cause rapid loss of fluid from the body
3. Giving the patient pure oxygen to breathe to reverse the blood oxygen desaturation, the heart deterioration, and the peripheral vasodilation
4. Giving the patient a rapidly acting cardiotonic drug, such as digitalis, to strengthen the heart
This vicious circle of acute pulmonary edema can proceed so rapidly that death can occur in 20 minutes to 1 hour. Therefore, any procedure that is to be successful must be instituted immediately.
Cardiac Reserve
The maximum percentage that the cardiac output can increase above normal is called the cardiac reserve. Thus, in the healthy young adult, the cardiac reserve is 300 to 400 percent. In athletically trained persons, it is 500 to 600 percent or more. But in heart failure, there is no cardiac reserve. As an example of normal reserve, during severe exercise the cardiac output of a healthy young adult can rise to about five times normal; this is an increase above normal of 400 percent—that is, a cardiac reserve of 400 percent.
Any factor that prevents the heart from pumping blood satisfactorily will decrease the cardiac reserve. This can result from ischemic heart disease, primary myocardial disease, vitamin deficiency that affects cardiac muscle, physical damage to the myocardium, valvular heart disease, and many other factors, some of which are shown in Figure 22-4.
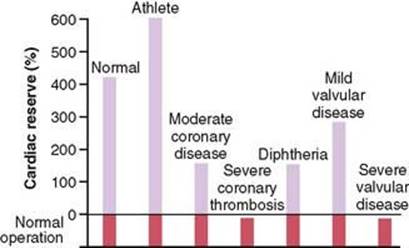
Figure 22-4 Cardiac reserve in different conditions, showing less than zero reserve for two of the conditions.
Diagnosis of Low Cardiac Reserve—Exercise Test
As long as persons with low cardiac reserve remain in a state of rest, they usually will not experience major symptoms of heart disease. However, a diagnosis of low cardiac reserve usually can be easily made by requiring the person to exercise either on a treadmill or by walking up and down steps, either of which requires greatly increased cardiac output. The increased load on the heart rapidly uses up the small amount of reserve that is available, and the cardiac output soon fails to rise high enough to sustain the body’s new level of activity. The acute effects are as follows:
1. Immediate and sometimes extreme shortness of breath (dyspnea) resulting from failure of the heart to pump sufficient blood to the tissues, thereby causing tissue ischemia and creating a sensation of air hunger
2. Extreme muscle fatigue resulting from muscle is-chemia, thus limiting the person’s ability to continue with the exercise
3. Excessive increase in heart rate because the nervous reflexes to the heart overreact in an attempt to overcome the inadequate cardiac output
Exercise tests are part of the armamentarium of the cardiologist. These tests take the place of cardiac output measurements that cannot be made with ease in most clinical settings.
Quantitative Graphical Method for Analysis of Cardiac Failure
Although it is possible to understand most general principles of cardiac failure using mainly qualitative logic, as we have done thus far in this chapter, one can grasp the importance of the different factors in cardiac failure with far greater depth by using more quantitative approaches. One such approach is the graphical method for analysis of cardiac output regulation introduced in Chapter 20. In the remaining sections of this chapter, we analyze several aspects of cardiac failure, using this graphical technique.
Graphical Analysis of Acute Heart Failure and Chronic Compensation
Figure 22-5 shows cardiac output and venous return curves for different states of the heart and peripheral circulation. The two curves passing through Point A are (1) the normal cardiac output curve and (2) the normal venous return curve. As pointed out in Chapter 20, there is only one point on each of these two curves at which the circulatory system can operate—point A where the two curves cross. Therefore, the normal state of the circulation is a cardiac output and venous return of 5 L/min and a right atrial pressure of 0 mm Hg.
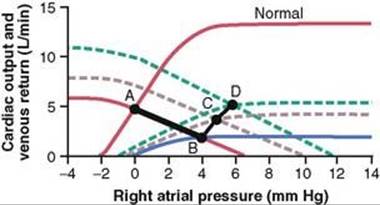
Figure 22-5 Progressive changes in cardiac output and right atrial pressure during different stages of cardiac failure.
Effect of Acute Heart Attack
During the first few seconds after a moderately severe heart attack, the cardiac output curve falls to the lowermost curve. During these few seconds, the venous return curve still has not changed because the peripheral circulatory system is still operating normally. Therefore, the new state of the circulation is depicted by point B, where the new cardiac output curve crosses the normal venous return curve. Thus, the right atrial pressure rises immediately to 4 mm Hg, whereas the cardiac output falls to 2 L/min.
Effect of Sympathetic Reflexes
Within the next 30 seconds, the sympathetic reflexes become very active. They raise both the cardiac output and the venous return curves. Sympathetic stimulation can increase the plateau level of the cardiac output curve as much as 30 to 100 percent. It can also increase the mean systemic filling pressure (depicted by the point where the venous return curve crosses the zero venous return axis) by several millimeters of mercury—in this figure, from a normal value of 7 mm Hg up to 10 mm Hg. This increase in mean systemic filling pressure shifts the entire venous return curve to the right and upward. The new cardiac output and venous return curves now equilibrate at point C, that is, at a right atrial pressure of +5 mm Hg and a cardiac output of 4 L/min.
Compensation During the Next Few Days
During the ensuing week, the cardiac output and venous return curves rise further because of (1) some recovery of the heart and (2) renal retention of salt and water, which raises the mean systemic filling pressure still further—this time up to +12 mm Hg. The two new curves now equilibrate at point D. Thus, the cardiac output has now returned to normal. The right atrial pressure, however, has risen still further to +6 mm Hg. Because the cardiac output is now normal, renal output is also normal, so a new state of equilibrated fluid balance has been achieved. The circulatory system will continue to function at point D and remain stable, with a normal cardiac output and an elevated right atrial pressure, until some additional extrinsic factor changes either the cardiac output curve or the venous return curve.
Using this technique for analysis, one can see especially the importance of moderate fluid retention and how it eventually leads to a new stable state of the circulation in mild to moderate heart failure. And one can also see the interrelation between mean systemic filling pressure and cardiac pumping at various degrees of heart failure.
Note that the events described in Figure 22-5 are the same as those presented in Figure 22-1, but in Figure 22-5, they are presented in a more quantitative manner.
Graphical Analysis of “Decompensated” Cardiac Failure
The black cardiac output curve in Figure 22-6 is the same as the curve shown in Figure 22-2, a greatly depressed curve that has already reached a degree of recovery as great as this heart can achieve. In this figure, we have added venous return curves that occur during successive days after the acute fall of the cardiac output curve to this low level. At point A, the curve at time zero equates with the normal venous return curve to give a cardiac output of about 3 L/min. However, stimulation of the sympathetic nervous system, caused by this low cardiac output, increases the mean systemic filling pressure within 30 seconds from 7 to 10.5 mm Hg. This shifts the venous return curve upward and to the right to produce the curve labeled “autonomic compensation.” Thus, the new venous return curve equates with the cardiac output curve at point B. The cardiac output has been improved to a level of 4 L/min but at the expense of an additional rise in right atrial pressure to 5 mm Hg.
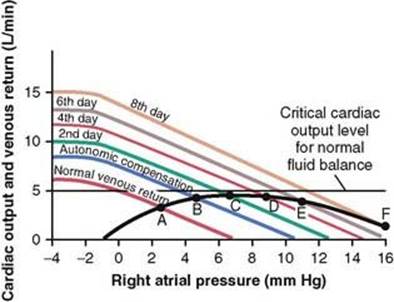
Figure 22-6 Graphical analysis of decompensated heart disease showing progressive shift of the venous return curve to the right as a result of continued fluid retention.
The cardiac output of 4 L/min is still too low to cause the kidneys to function normally. Therefore, fluid continues to be retained, and the mean systemic filling pressure rises from 10.5 to almost 13 mm Hg. Now the venous return curve becomes that labeled “2nd day” and equilibrates with the cardiac output curve at point C. The cardiac output rises to 4.2 L/min and the right atrial pressure to 7 mm Hg.
During the succeeding days, the cardiac output never rises quite high enough to re-establish normal renal function. Fluid continues to be retained, the mean systemic filling pressure continues to rise, the venous return curve continues to shift to the right, and the equilibrium point between the venous return curve and the cardiac output curve also shifts progressively to point D, to point E, and, finally, to point F. The equilibration process is now on the down slope of the cardiac output curve, so further retention of fluid causes even more severe cardiac edema and a detrimental effect on cardiac output. The condition accelerates downhill until death occurs.
Thus, “decompensation” results from the fact that the cardiac output curve never rises to the critical level of 5 L/min needed to re-establish normal kidney excretion of fluid that would be required to cause balance between fluid input and output.
Treatment of Decompensated Heart Disease with Digitalis
Let us assume that the stage of decompensation has already reached point E in Figure 22-6, and let us proceed to the same point E in Figure 22-7. At this time, digitalis is given to strengthen the heart. This raises the cardiac output curve to the level shown in Figure 22-7, but there is not an immediate change in the venous return curve. Therefore, the new cardiac output curve equates with the venous return curve at point G. The cardiac output is now 5.7 L/min, a value greater than the critical level of 5 liters required to make the kidneys excrete normal amounts of urine. Therefore, the kidneys eliminate much more fluid than normally, causing diuresis, a well-known therapeutic effect of digitalis.
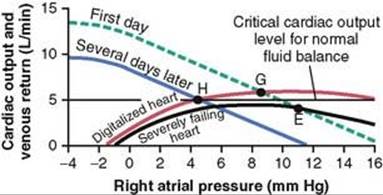
Figure 22-7 Treatment of decompensated heart disease showing the effect of digitalis in elevating the cardiac output curve, this in turn causing increased urine output and progressive shift of the venous return curve to the left.
The progressive loss of fluid over a period of several days reduces the mean systemic filling pressure back down to 11.5 mm Hg, and the new venous return curve becomes the curve labeled “Several days later.” This curve equates with the cardiac output curve of the digitalized heart at point H, at an output of 5 L/min and a right atrial pressure of 4.6 mm Hg. This cardiac output is precisely that required for normal fluid balance. Therefore, no additional fluid will be lost and none will be gained. Consequently, the circulatory system has now stabilized, or in other words, the decompensation of the heart failure has been “compensated.” And to state this another way, the final steady-state condition of the circulation is defined by the crossing point of three curves: the cardiac output curve, the venous return curve, and the critical level for normal fluid balance. The compensatory mechanisms automatically stabilize the circulation when all three curves cross at the same point.
Graphical Analysis of High-Output Cardiac Failure
Figure 22-8 gives an analysis of two types of high-output cardiac failure. One of these is caused by an arteriovenous fistula that overloads the heart because of excessive venous return, even though the pumping capability of the heart is not depressed. The other is caused by beriberi, in which the venous return is greatly increased because of diminished systemic vascular resistance, but at the same time, the pumping capability of the heart is depressed.
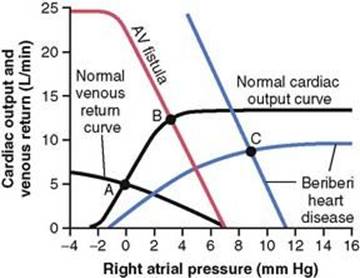
Figure 22-8 Graphical analysis of two types of conditions that can cause high-output cardiac failure: (1) arteriovenous (AV) fistula and (2) beriberi heart disease.
Arteriovenous Fistula
The “normal” curves of Figure 22-8 depict the normal cardiac output and normal venous return curves. These equate with each other at point A, which depicts a normal cardiac output of 5 L/min and a normal right atrial pressure of 0 mm Hg.
Now let us assume that the systemic vascular resistance (the total peripheral vascular resistance) becomes greatly decreased because of opening a large arteriovenous fistula (a direct opening between a large artery and a large vein). The venous return curve rotates upward to give the curve labeled “AV fistula.” This venous return curve equates with the normal cardiac output curve at point B, with a cardiac output of 12.5 L/min and a right atrial pressure of 3 mm Hg. Thus, the cardiac output has become greatly elevated, the right atrial pressure is slightly elevated, and there are mild signs of peripheral congestion. If the person attempts to exercise, he or she will have little cardiac reserve because the heart is already at near-maximum capacity to pump the extra blood through the arteriovenous fistula. This condition resembles a failure condition and is called “high-output failure,” but in reality, the heart is overloaded by excess venous return.
Beriberi
Figure 22-8 shows the approximate changes in the cardiac output and venous return curves caused by beriberi. The decreased level of the cardiac output curve is caused by weakening of the heart because of the avitaminosis (mainly lack of thiamine) that causes the beriberi syndrome. The weakening of the heart has decreased the blood flow to the kidneys. Therefore, the kidneys have retained a large amount of extra body fluid, which in turn has increased the mean systemic filling pressure (represented by the point where the venous return curve now intersects the zero cardiac output level) from the normal value of 7 mm Hg up to 11 mm Hg. This has shifted the venous return curve to the right. Finally, the venous return curve has rotated upward from the normal curve because the avitaminosis has dilated the peripheral blood vessels, as explained in Chapter 17.
The two blue curves (cardiac output curve and venous return curve) intersect with each other at point C, which describes the circulatory condition in beriberi, with a right atrial pressure in this instance of 9 mm Hg and a cardiac output about 65 percent above normal; this high cardiac output occurs despite the weak heart, as demonstrated by the depressed plateau level of the cardiac output curve.
Bibliography
Abraham W.T., Greenberg B.H., Yancy C.W. Pharmacologic therapies across the continuum of left ventricular dysfunction. Am J Cardiol. 2008;102:21G-28G.
Andrew P. Diastolic heart failure demystified. Chest. 2003;124:744.
Bers D.M. Altered cardiac myocyte Ca regulation in heart failure. Physiology (Bethesda). 2006;21:380.
Braunwald E. Biomarkers in heart failure. N Engl J Med. 2008;358:2148.
Dorn G.W.2nd, Molkentin J.D. Manipulating cardiac contractility in heart failure: data from mice and men. Circulation. 2004;109:150.
Floras J.S. Sympathetic activation in human heart failure: diverse mechanisms, therapeutic opportunities. Acta Physiol Scand. 2003;177:391.
Guyton A.C., Jones C.E., Coleman T.G. Circulatory physiology: cardiac output and its regulation. Philadelphia: WB Saunders, 1973.
Haddad F., Doyle R., Murphy D.J., et al. Right ventricular function in cardiovascular disease, part II: pathophysiology, clinical importance, and management of right ventricular failure. Circulation. 2008;117:1717.
Ikeda Y., Hoshijima M., Chien K.R. Toward biologically targeted therapy of calcium cycling defects in heart failure. Physiology (Bethesda). 2008;23:6.
Lohmeier T.E. Neurohumoral regulation of arterial pressure in hemorrhage and heart failure. Am J Physiol Regul Integr Comp Physiol. 2002;283:R810.
Mehra M.R., Gheorghiade M., Bonow R.O. Mitral regurgitation in chronic heart failure: more questions than answers? Curr Cardiol Rep. 2004;6:96.
McMurray J., Pfeffer M.A. New therapeutic options in congestive heart failure: Part I. Circulation. 2002;105:2099.
McMurray J., Pfeffer M.A. New therapeutic options in congestive heart failure: Part II. Circulation. 2002;105:2223.
Morita H., Seidman J., Seidman C.E. Genetic causes of human heart failure. J Clin Invest. 2005;115:518.
Pfisterer M. Right ventricular involvement in myocardial infarction and cardiogenic shock. Lancet. 2003;362:392.
Pitt B. Aldosterone blockade in patients with chronic heart failure. Cardiol Clin. 2008;26:15.
Reynolds H.R., Hochman J.S. Cardiogenic shock: Current concepts and improving outcomes. Circulation. 2008;117:686.
Spodick D.H. Acute cardiac tamponade. N Engl J Med. 2003;349:684.
Zile M.R., Brutsaert D.L. New concepts in diastolic dysfunction and diastolic heart failure: Part I: diagnosis, prognosis, and measurements of diastolic function. Circulation. 2002;105:1387.
Zucker I.H. Novel mechanisms of sympathetic regulation in chronic heart failure. Hypertension. 2006;48:1005.