William E. DeTurk & Lisa Johnson
INTRODUCTION
It is one of the great marvels and mysteries of life that simple elements like carbon, hydrogen, and oxygen can be combined with a life force to produce human existence and movement. These elements are found in carbohydrate, fat, and protein—the food substrates that we consume. This chapter begins with quantification of energy expenditure and then describes the formation of energy substrates and their subsequent breakdown. Nutrition for optimum health will be explored. Adenosine triphosphate (ATP) will be appreciated as the link between the breakdown of food and the ability to perform physical activity. Exercise states will be described as a function of metabolic pathways. Obesity and measurement of body composition will be discussed. The chapter concludes with components of a physical fitness program and principles of exercise prescription.
This chapter is not intended to be an in-depth examination of exercise physiology. Rather, it is an extraction of select basic principles of exercise that has meaning and application to patients with disease. Understanding the normal physiological response to exercise will provide a firm foundation to appreciate abnormal responses.
MEASURES OF ENERGY EXPENDITURE
The Calorie
The energy value of the food that we eat can be quantified in terms of calorie. A kilocalorie (kcal) is the amount of heat necessary to raise the temperature of 1.0 kg of water by 1.0°C. The energy value of food is determined by placing a known quantity of food in a bomb calorimeter. This device uses oxygen to completely burn the substrate and measure the amount of heat liberated. Thus, the energy value of 4.0 oz of cheesecake is almost 350 kcal. As you will see, it takes a lot of exercise to burn off a slice of cheesecake!
Oxygen Consumption: Rest
Oxygen is utilized as an adjunct to substrate catabolism, or breakdown, in all metabolically active tissues. Oxygen consumption may be abbreviated as ![]() O2, or the volume of oxygen consumed per minute, and expressed as either mL O2/min or mL O2/kg of body weight/min. The basal metabolic rate (BMR) is the minimal amount of oxygen utilized in order to support life. It is the sum total of cellular activity in all metabolically active tissues while under basal conditions. Skeletal muscle
O2, or the volume of oxygen consumed per minute, and expressed as either mL O2/min or mL O2/kg of body weight/min. The basal metabolic rate (BMR) is the minimal amount of oxygen utilized in order to support life. It is the sum total of cellular activity in all metabolically active tissues while under basal conditions. Skeletal muscle ![]() O2 accounts for approximately 20% of the total BMR. The BMR is measured under strictly controlled laboratory conditions. The resting metabolic rate (RMR) is a more easily acquired measurement. Patients are instructed to avoid strenuous exercise for at least 24 hours before testing. Measurements are obtained at least 4 hours after a light meal and no caffeine.1 Its value is only slightly higher than the BMR. Measurement of the RMR was once costly and time-consuming and involved use of a metabolic cart or Douglas bag collection systems. Newer, handheld portable devices (eg, the BodyGem) are beginning to replace such instrumentation.2 There is considerable variation in BMR and RMR values across human subjects. This variation is a function of overall body size, gender, age, fat-free mass (FFM), and endocrine function.1,3–6 Normal measurements of BMR fall around 200 mL O2/min for women and 250 mL O2/min for men.
O2 accounts for approximately 20% of the total BMR. The BMR is measured under strictly controlled laboratory conditions. The resting metabolic rate (RMR) is a more easily acquired measurement. Patients are instructed to avoid strenuous exercise for at least 24 hours before testing. Measurements are obtained at least 4 hours after a light meal and no caffeine.1 Its value is only slightly higher than the BMR. Measurement of the RMR was once costly and time-consuming and involved use of a metabolic cart or Douglas bag collection systems. Newer, handheld portable devices (eg, the BodyGem) are beginning to replace such instrumentation.2 There is considerable variation in BMR and RMR values across human subjects. This variation is a function of overall body size, gender, age, fat-free mass (FFM), and endocrine function.1,3–6 Normal measurements of BMR fall around 200 mL O2/min for women and 250 mL O2/min for men.
The BMR/RMR can also be measured indirectly using regression equations such as the revised Harris–Benedict equation7 or the WHO/FAO/UNU regression equation.8
In general, the BMR and RMR tend to be 5% to 10% lower in women than in men.9 This is not a true sex difference, but rather the presence of more adipose tissue in women, which has a lower level of metabolic activity than muscle and provides an increase in thermal insulation. The variation in BMR and RMR within subjects of the same gender is a function of differences in lean body mass (LBM) and endocrine function. There is a strong association between LBM and body surface area within gender; for this reason, body surface area is commonly used to reflect LBM and, by extension, to predict BMR. The BMR also varies as a function of age, such that there is a decline in BMR of 2% to 3% per decade of life.10 This is most likely due to the reduction in physical activity associated with aging and the resultant decrease in LBM, change in endocrine function, and increase in body fat.11,12
Both kilocalories and ![]() O2 are useful tools to measure the body’s response to exercise. Indeed, a relationship exists between kilocalories and
O2 are useful tools to measure the body’s response to exercise. Indeed, a relationship exists between kilocalories and ![]() O2, such that, for every liter of oxygen consumed, approximately 5.0 kcal of energy is liberated.
O2, such that, for every liter of oxygen consumed, approximately 5.0 kcal of energy is liberated.
OXYGEN CONSUMPTION: EXERCISE
With progressive increases in submaximal workload, ![]() O2 increases in a linear fashion. This relationship is sustained until a maximum exercise level is reached (
O2 increases in a linear fashion. This relationship is sustained until a maximum exercise level is reached (![]() O2peak or functional capacity), at which point a further increase in workload produces no further increase in
O2peak or functional capacity), at which point a further increase in workload produces no further increase in ![]() O2.
O2.
The MET
MET’s are defined as multiples of resting energy metabolism. One MET is, therefore, a close approximation of the RMR in the seated position. The value of 1 MET has been standardized as
1 MET = 3.5 mL O2/kg/min.
This value is assumed to be approximately the same across all subjects—man, woman, young, or old. The derivation of the MET, and its relationship to the RMR, requires some comment.
It has been noted that the BMR varies as a function of body size, gender, age, FFM, and endocrine function and that its direct measurement normally falls between 200 mL O2/min for women and 250 mL O2/min for men. The BMR can be better standardized by including the subject’s individual body weight in the equation. Thus, for an “average” woman weighing 57 kg and an “average” man weighing 71 kg,
for women: 200 mL O2/min/57 kg = 3.5 mL O2/kg/min = 1 MET.
for men: 250 mL O2/min/71 kg = 3.5 mL O2/kg/min = 1 MET.
In order to standardize a MET value of 3.5 mL O2/kg/min, the transformation noted in the equation assumes some sort of a reference, or idealized as woman weighing 57 kg (125 lb) and man weighing 71 kg (156 lb). Indeed, this is probably the case. Albert Behnke, a pioneer in body composition research, first defined a “reference man” and a “reference woman” in the 1970s.13,14 His work paved the way for conceptualization of the MET and its application to exercise.
Acceptance of the value of 1 MET = 3.5 mL O2/kg/min across individuals allows one to quantify exercise based on the number of METs required to perform the activity. However, it must be noted that use of METs to quantify exercise assumes the following: (1) the exercise is primarily reliant on the oxygen transport system; (2) the activity is being performed at a steady state, that is, the amount of oxygen needed to perform the activity is matched by a supply of oxygen; (3) the subject is performing the activity with bio-mechanical efficiency. An example of an activity that meets these requirements is that of a patient free from lower-extremity biomechanical impairment, walking at a moderate, comfortable pace down a hallway.
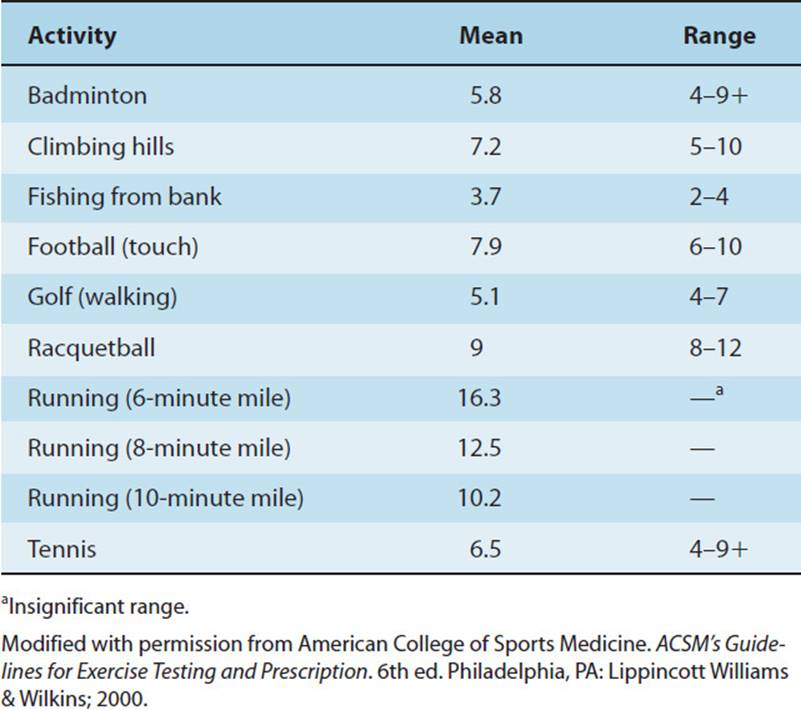
If 1 MET is defined as resting ![]() O2 (ie, RMR), then 7.0 mL O2/kg/min measured during a walk down the hall corresponds to 2 METs. Similarly, walking on a treadmill set at 1.7 miles per hour (mph) at a 10% grade requires approximately 5.0 METs of oxidative energy expenditure, a gross value that includes the resting energy expenditure. These values are assumed to be about the same for all biomechanically normal subjects irrespective of gender, age, or body composition—as long as the exercise is submaximal, utilizes the oxygen transport mechanism, and as long as the value is normalized to body weight and expressed on a per-kilogram basis. A useful analogy is that of the cost of a cheeseburger: It is the same for everyone, rich or poor. Similarly, the cost of walking on the treadmill using a normal gait pattern at a submaximal workload should be about the same for everyone. See Table 3-1 for standardized energy values in METs for treadmill work and relatively unstructured leisure time activities.
O2 (ie, RMR), then 7.0 mL O2/kg/min measured during a walk down the hall corresponds to 2 METs. Similarly, walking on a treadmill set at 1.7 miles per hour (mph) at a 10% grade requires approximately 5.0 METs of oxidative energy expenditure, a gross value that includes the resting energy expenditure. These values are assumed to be about the same for all biomechanically normal subjects irrespective of gender, age, or body composition—as long as the exercise is submaximal, utilizes the oxygen transport mechanism, and as long as the value is normalized to body weight and expressed on a per-kilogram basis. A useful analogy is that of the cost of a cheeseburger: It is the same for everyone, rich or poor. Similarly, the cost of walking on the treadmill using a normal gait pattern at a submaximal workload should be about the same for everyone. See Table 3-1 for standardized energy values in METs for treadmill work and relatively unstructured leisure time activities.
TABLE 3-1 Energy Values for Select Leisure and Recreational Activities in METs
When calculating the amount of energy required to perform any given task, particularly as it relates to weight loss, resting energy metabolism should be removed from the equation, because this energy would have been utilized whether or not exercise was performed. Thus,
net energy expenditure = gross – resting energy expenditure.
CLINICAL CORRELATE
Quantifying the amount of exercise that the physical therapist prescribes to a patient through the use of MET units allows exercises to be graded from lower intensity to higher intensity and provides a basis for comparisons between subjects. Use of MET units can also be used to plot individual patient progress. However, physical therapists should be aware that use of MET units to normalize work is referenced to a man and woman of “ideal” body weight and stature and that this person is free from biomechanical impairments. More importantly, the heart rate and blood pressure response to exercise is highly individualistic at any given MET level, which may make the use of MET units impractical, especially for patients with heart and lung disease and for patients with lower extremity impairments (eg, stroke, amputation).
NUTRIENTS/FOODSTUFFS
All nutrients consist of carbon, hydrogen, and oxygen. It is the ratio of one component to the other and their molecular structure that differentiates them. Nutrients used to power exercise include carbohydrates, fats, and proteins. These nutrients, together with vitamins, minerals, and water, are essential for the maintenance of optimum health. This section will describe the structural characteristics of these nutrients and current nutritional recommendations for health and the prevention of disease.
CLINICAL CORRELATE
Physical therapists should possess knowledge of basic nutrition, understand how diet and exercise may work together in helping patients achieve their ideal weight, and recognize when to refer patients to professionals trained in nutrition sciences.
Proper nutrition may improve the quality of life of our patients by improving their ability to carry out work and leisure time activity without fatigue.
Carbohydrates
Introduction
Carbohydrates consist of carbon, hydrogen, and oxygen, and the hydrogen-to-oxygen ratio is always 2:1. They are classified as monosaccharides, oligosaccharides, or polysaccharides. We will spend some time discussing the monosaccharide glucose because it is the principal substrate used to fuel exercise and the final common denominator that allows entrance into one of the main energy extraction pathways (see Fig. 3-1A).
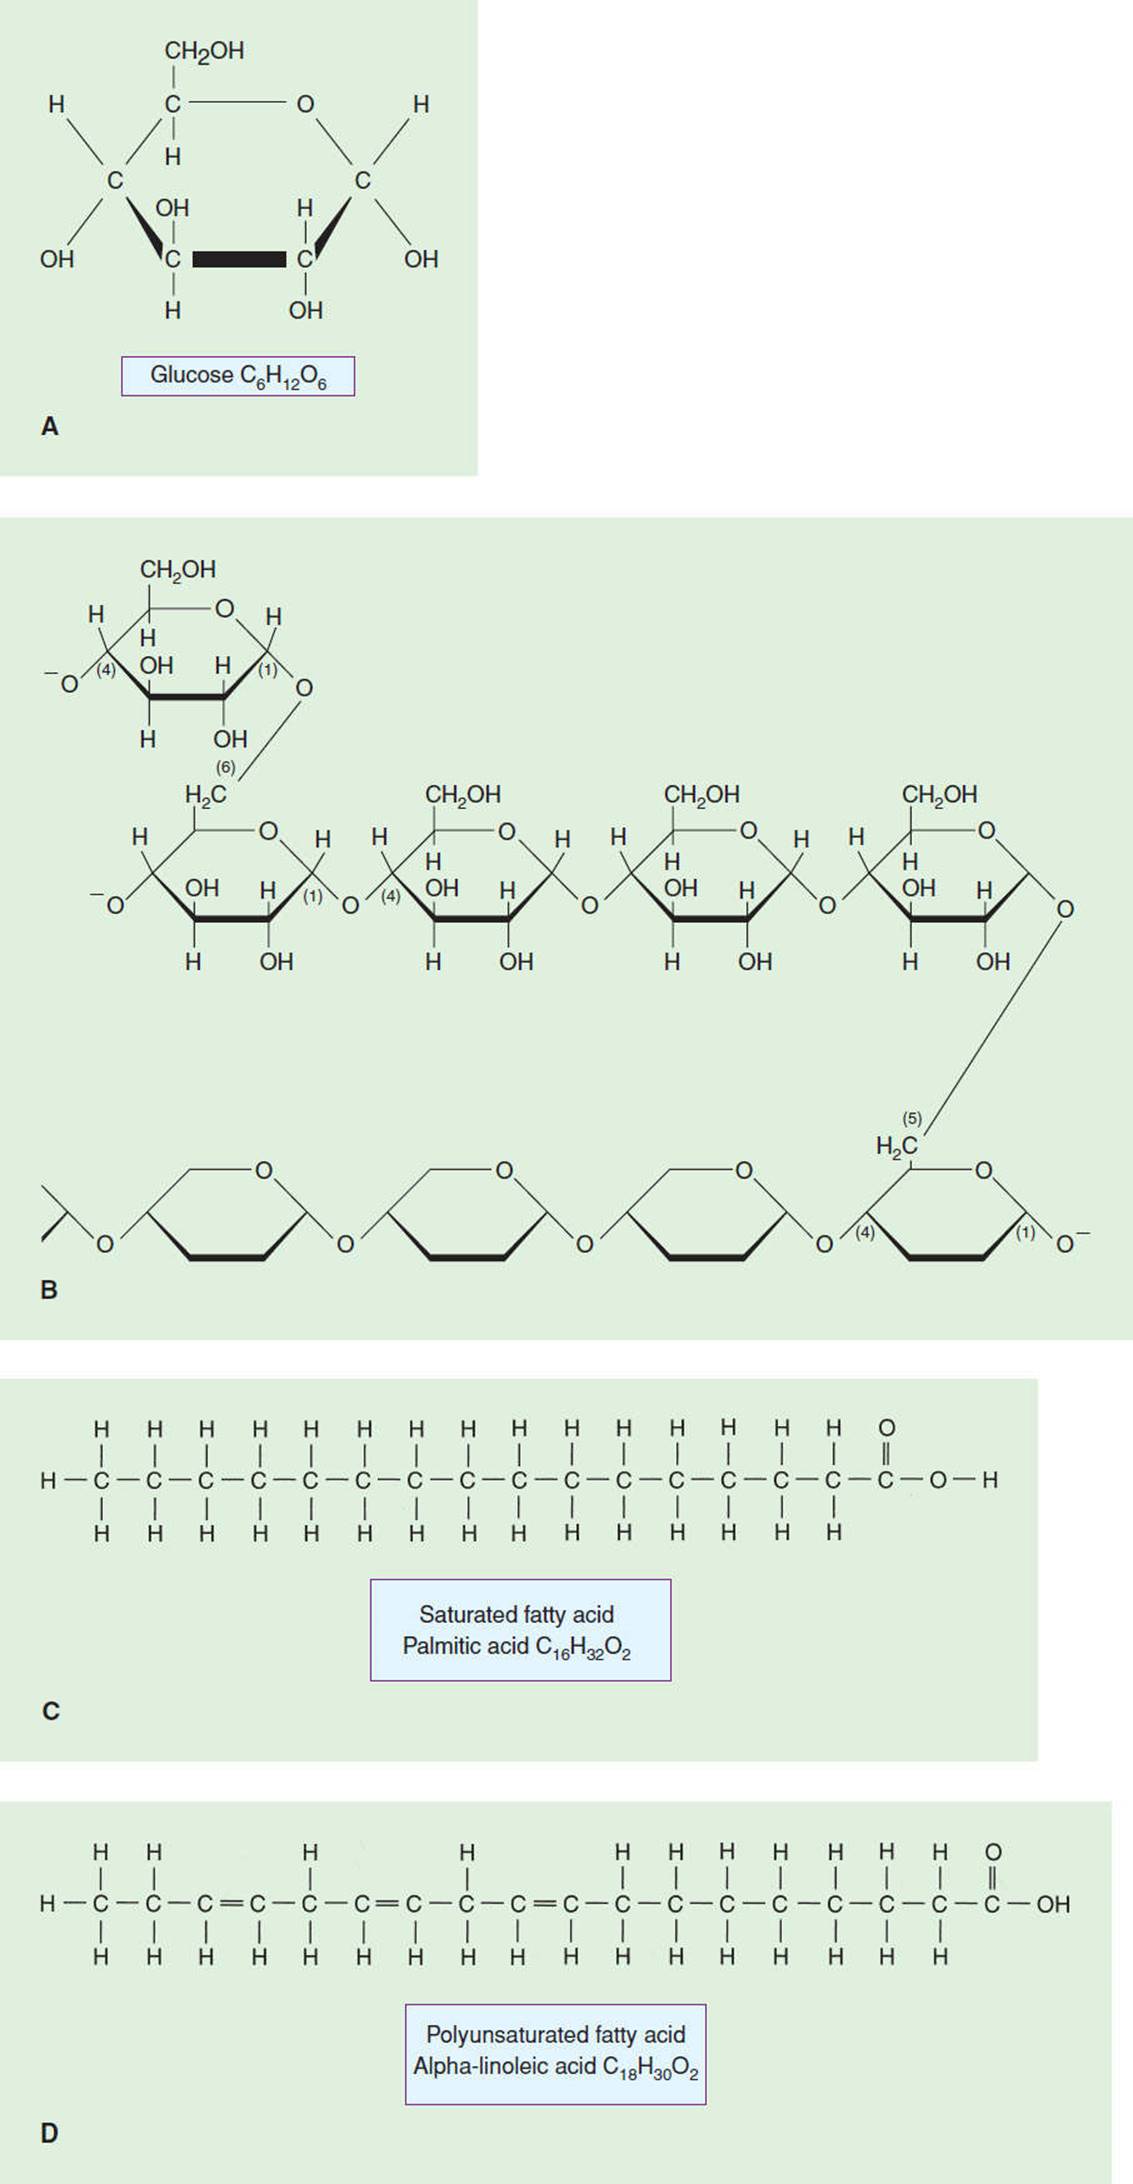
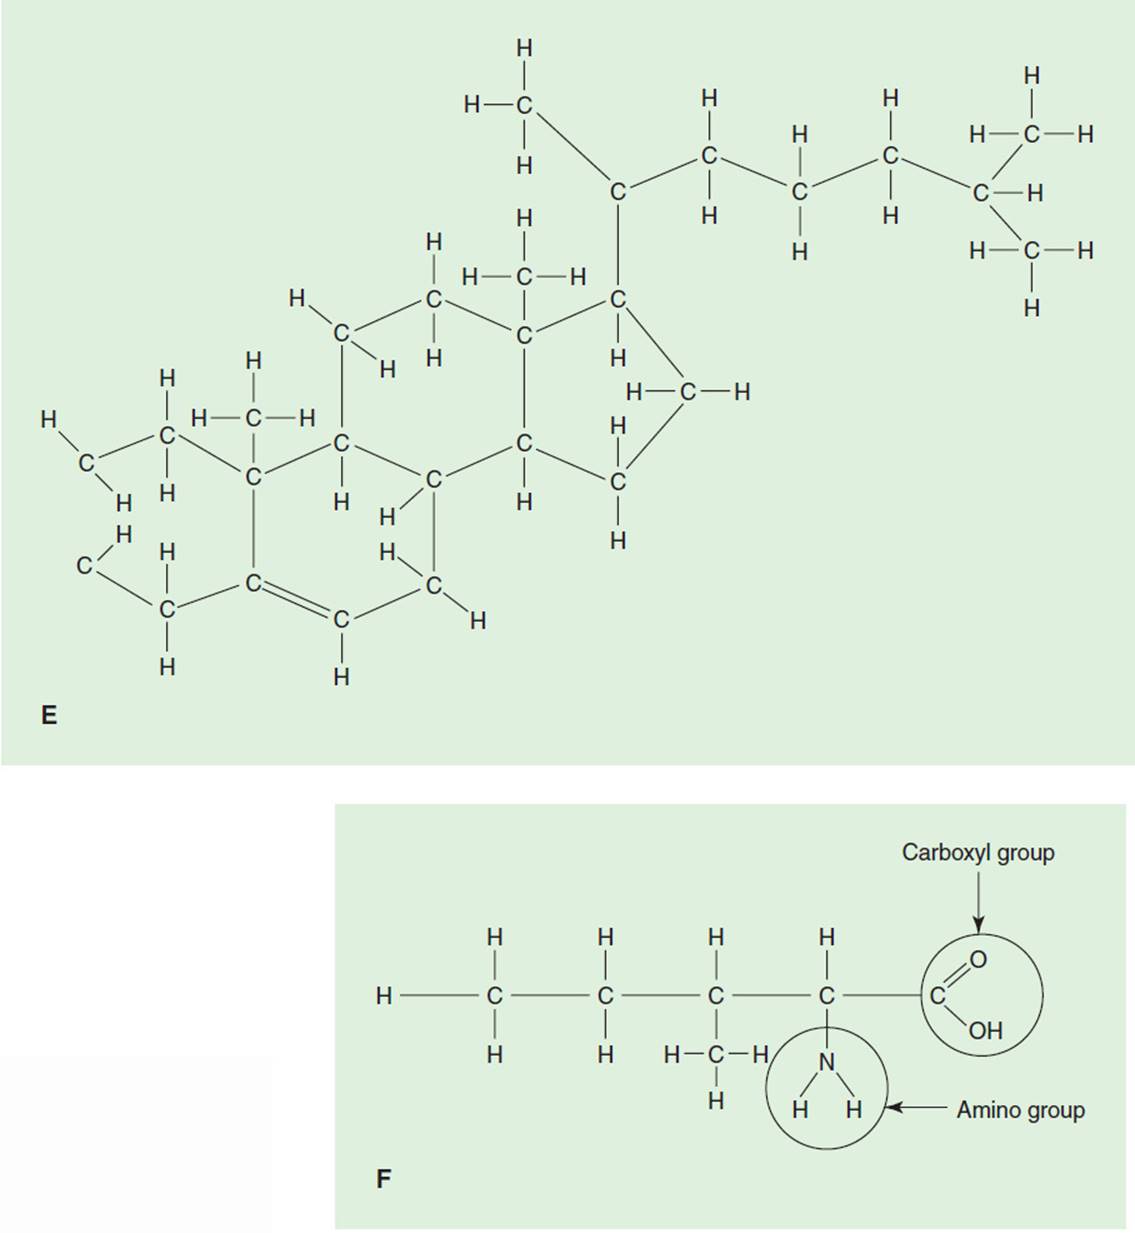
FIGURE 3-1 Chemical structure of fuel substrates—carbohydrate, fats, and protein. (A) Glucose; (B) glycogen; (C) saturated fatty acid, palmitic acid; (D) unsaturated fatty acid α-linoleic acid; (E) cholesterol; (F) protein isoleucine. (Adapted with permission from Foss M, Keteyian S. Fox’s: Physiological Basis for Exercise and Sport. 6th ed. Boston, MA: WCB McGraw-Hill; 1998.)
Glucose is formed by plants during photosynthesis, but its relevance for us resides in the reverse equation called cellular respiration, which breaks down glucose and releases energy:
C6H12O6 + 6O2 → 6CO2 + 6H2O + energy.
Circulating blood glucose is one element in a blood chemical analysis found in “panel tests” (SMA-6,12). Normal fasting levels are 70 to 110 mg/dL. Glucose, or “blood sugar,” is also known as dextrose, a 5% solution of water and glucose. In the intensive care unit, patients frequently have a bag of “D5W” running intravenously for nutrition and blood volume expansion to maintain blood pressure and thus peripheral perfusion.
The storage form of glucose is glycogen, a polysaccharide polymer. It is stored in muscle and liver tissue. Glucose molecules are linked together in long helical chains to form glycogen (see Fig. 3-1B). Notice that it is very easy to move from glycogen to glucose because of the way that glucose molecules are strung together.
Each cell has its own glycogen store, limited by the size of the cell. Once maximum glycogen storage is reached and the cell can hold no more, glucose will not enter the cell; instead, excess glycogen is moved to the liver where it is reconverted, or stored, in adipose cells as fat.
When there is an increase in sugar intake, blood glucose levels go up as well. This triggers an increase in insulin secretion by the pancreas. The hormone insulin regulates the movement of glucose into cells, thereby decreasing blood glucose levels. When there is a decrease in blood glucose levels below the baseline level, glucagon, the “insulin antagonist,” is secreted by the pancreas to increase blood glucose levels. Thus, the pancreas plays a pivotal role in maintaining normal circulating blood glucose levels. We will expand on control of glucose blood levels when diabetes is discussed in Chapter 15.
Role of Carbohydrates
Carbohydrates serve a variety of important roles in normal body function.
1.Carbohydrate is the primary fuel source of the body. The energy yield from the complete degradation of a mole of glucose is 686 kcal/mol, or approximately 4 kcal/g. In fact, glucose is the only ingested foodstuff that can be used during efforts of high intensity. Its availability in a wide range of foodstuffs makes it readily accessible. There are efficient metabolic processes in the human body that break carbohydrate down into molecular fragments that can be used to make adenosine triphosphate, or ATP, the “energy packets” that are used to power work. These processes break down C6H12O6 into two pyruvic acid molecules during glycolysis; energy is extracted and captured in the form of ATP. The remaining energy is extracted in the citric acid (Kreb) cycle. More will be said about this later.
2.Carbohydrate is a necessary adjunct for the catabolism of fats. The correct breakdown of fats, particularly triglyceride, depends on the presence of glucose. Without glucose, the body will mobilize more lipid than can be broken down. Lipid will be incompletely catabolized, with the formation of lipid fragments consisting of acetone-like bodies called ketone bodies. These ketone bodies create an acid environment that decreases systemic pH, sometimes to dangerous levels. Diabetic patients whose insulin levels are low and whose blood glucose levels are high may deteriorate into diabetic ketoacidosis with resultant diabetic coma.
3.Carbohydrate is the principal fuel for the central nervous system (CNS). In healthy persons under normal conditions, glucose is the exclusive substrate of the CNS. The brain cannot store glucose; therefore, the only route for nutrition is through circulating blood glucose. Liver glycogenolysis maintains circulating blood glucose levels. When glycogen stores become depleted and blood glucose levels go down, most people start to feel weak and dizzy. Both healthy persons and patients alike may require a drink that is high in a readily absorbed simple sugar to keep them from becoming hypoglycemic.
4.The utilization of carbohydrate as a fuel source protects protein. As long as there is an adequate amount of glucose and glycogen available to metabolically active tissue, the body will preferentially use these substrates to power exercise and preserve protein for cell maintenance, repair, and growth. Although protein is a poor fuel source, it can be used in extenuating circumstances, such as occurs in prolonged exercise, starvation, or end-stage disease. When this happens, protein is taken from muscle tissue, which may lead to a reduction in lean muscle mass and an increased solute load on the kidneys, as they excrete the by-products of protein breakdown. Many patients with chronic diseases have significantly less than the average amount of lean muscle mass, which can impair functional abilities.
Nutritional Recommendations: Carbohydrates
The American Heart Association (AHA) has, for many years, taken a lead role in defining nutrition for optimal health. These recommendations take the form of a recommended daily allowance (RDA) for any given food. For up-to-date dietary recommendations for health professionals, the interested reader may visit their Web site at http://circ.ahajournals.org/cgi/content/full/4304635102#T1.
For optimal health, the AHA recommends a diet high in complex (unprocessed), natural carbohydrates.15 One form of complex carbohydrates, the starches, are found in fruits, vegetables, whole-grain breads, and cereals. They are very nutritionally dense because they contain the dietary fiber cellulose. Although cellulose is not digested, it provides bulk for efficient digestion. Diets should include at least five servings of vegetables and fruits each day and at least six servings of breads, cereals, and/or legumes. Diets high in carbohydrates are usually low in saturated fats and are, therefore, linked with a lower incidence of lung, colon, esophageal, and stomach cancer and heart disease.
After ingestion, carbohydrates get absorbed into the bloodstream at different rates. This depends on particle size and degree of processing, amount of fiber, and fat and protein content, for example. The glycemic index measures the relative rise in blood glucose levels in the 2-hour period following ingestion of any given substrate, compared to a “reference food,” usually 50 g of white bread or glucose. Glucose, as the reference food, has a glycemic index of 100. Kidney beans have a glycemic index of 27, which indicates that consuming 50 g of kidney beans provokes an increase in blood glucose that is 27% as great as ingesting 50 g of glucose. Foods may be rank ordered from those with a low glycemic index to those with a high glycemic index. Individuals can get a more stable and long-term rise in blood glucose levels by eating low glycemic-index foods (eg, whole-wheat bread, spaghetti, legumes). Individuals may choose to eat foods with a moderate-to-high glycemic index for a more rapid elevation in blood glucose levels (eg, instant rice, baked potatoes, honey).16,17 Unless specific events dictate otherwise, it may be said that simple processed sugars, like those in candy bars, should be avoided. Although they can be absorbed quickly through the mucosa of the gastrointestinal tract and taken into cells, they require the rapid mobilization of insulin. In the short term, this insulin dependence contributes to an initial “sugar rush,” followed by feelings of low energy and fatigue. Over the long haul, consumption of processed sugars and heavy dependence on insulin may contribute to diabetes, a risk factor for the development of heart disease and a very bad disease in its own right.
Fats
Introduction
Like carbohydrates, fats consist of carbon, hydrogen, and oxygen, but the hydrogen-to-oxygen ratio is much higher. Therefore, fat molecules possess many more hydrogens than carbohydrate molecules. As we shall see, the energy value of fuel substrates is derived from the number and amount of hydrogen atoms “exposed” on their binding sites. When hydrogens are cleaved off their substrates, energy is released and then captured in the form of ATP. There are three main groups of fats: simple lipids, compound lipids, and derived lipids.
Simple Lipids
Triglycerides are perhaps the best known of the simple lipids. Fat is stored in the body as triglyceride. A single molecule consists of three fatty acids and one glycerol unit. Fatty acid molecules may be either saturated or unsaturated. Saturated fatty acids have single bonds between carbon atoms, thus freeing up more binding sites for hydrogens. Unsaturated fatty acids possess double bonds between carbons, with proportionately less binding sites for hydrogen. Most saturated fats are derived from animal sources, whereas unsaturated fatty acids come from plant sources and liquify at room temperature (see Figs. 3-1Cand 3-1D for examples of saturated and unsaturated fatty acids).
The unsaturated fatty acids may be subdivided into the monounsaturated fatty acids (MUFAs) and the polyunsatu-rated fatty acids (PUFAs). MUFAs contain one double bond along the main carbon chain; olive oil is an example of a MUFA. PUFAs contain multiple double bonds along the main carbon chain; corn oil and fish oils are examples of PUFAs.
Yet another type of fatty acids are the trans fatty acids (TFAs). TFAs are formed when a hydrogen atom is moved from its original naturally occurring position along a restructured carbon chain to a different position. This results in a modified fatty acid that contains no cholesterol. TFAs form the principal component of dietary margarine, which is derived from vegetable oil. Margarine has been promoted as a safe alternative to butter, because it is low in cholesterol. However, there is considerable debate about the health benefit of margarine ingestion. It has been found that margarine increases serum low-density lipoprotein (LDL) levels and that this increase is equivalent to a diet high in saturated fatty acids.18 Margarine also decreases high-density lipoprotein (HDL) cholesterol.19 These findings support the notion that ingestion of TFAs is dangerous to your health and actually increases the risk of heart disease.20,21 In July 2003, the FDA required that the amount of TFAs appear on nutrition labels.
Compound Lipids
Important examples of the compound lipids are the lipoproteins. The lipoproteins are synthesized in the liver, although they are present in all cells. Lipoproteins consist of a hydrophobic protein core and an outer shell containing free cholesterol, phospholipid, and a regulatory protein called an apolipoprotein (apo). They function as the transport mechanism for lipids and are categorized according to their molecular weight. The HDLs possess the highest amount of protein (up to 50%) and the lowest amount of cholesterol (approximately 20%). They are popularly called the “good cholesterol” because they remove cholesterol from arterial walls and transport it to the liver, where it is excreted. The LDLs, or “bad cholesterol,” contain large amounts of cholesterol, which they transport to arterial walls, thus contributing to atherosclerosis or “hardening of the arteries.” Clearly it is in our best interest to maintain high levels of HDL and low levels of LDL. Although only a few studies to date have isolated exercise from multi-factorial interventions aimed at reducing LDL and increasing HDL, current best practice recognizes the appropriate use of exercise as an essential component in the nonpharmacologic treatment of elevated serum lipids.22 There is also convincing evidence that moderate consumption of alcohol elevates HDL levels and exerts a protective influence from heart disease.23
The apos form the shell of the lipoproteins. They help to keep the lipids in solution during circulation through the bloodstream. Apos regulate plasma lipid metabolism and direct lipids to their appropriate target organs. There are multiple isoforms of apos. Apo AI is of interest because it is the major apo of HDL. Similarly, apo B and apo E surround the LDL molecule.24 Apos have come under scrutiny because of their association with the development of heart disease. Studies show that apo AI and apo B100 are better discriminators of individuals with coronary artery disease than the cholesterol of the corresponding protein.25,26 Additionally, these two apos correlate better with the severity of coronary artery stenosis than LDL and HDL.24,27
Derived Lipids
Perhaps the best known of the derived fats is cholesterol. Serum cholesterol is a composite of the total cholesterol contained in each of the lipoproteins. Indeed, cholesterol distribution among the lipoproteins is a stronger predictor of heart disease than total serum cholesterol.28 Cholesterol is found exclusively in animal tissue. It is both consumed in the food we eat and produced by the body, mainly in the liver (70%) but also in other areas (eg, arterial walls). A high cholesterol level in the blood is an independent risk factor for the development of heart disease. Cholesterol’s bad reputation is balanced by the fact that it is an essential precursor for vitamin D production and is needed to synthesize hormones, especially estrogen, androgen, and progesterone. See Fig. 3-1E for the chemical composition of a cholesterol molecule.
Role of Fats
The presence of fat in our body habitus has become the source of intense investigation, as scientists weigh the positive role of body fat against excessive dietary intake. The benefits of fats in the maintenance of proper body function are listed as follows. (1) Fats have the highest energy yield of any of the substrates in the body. In fact, 1.0 g of fat yields over twice the energy compared to an equal amount of carbohydrate. The complete degradation of a mole of a typical lipid yields 9 kcal/g. Recall that energy is released when hydrogen is cleaved off food substrate. This high yield is due to the presence of the increased number of hydrogens referred to earlier. (2) Fat provides a layer of insulation for the body that helps maintain thermal homeostasis. (3) Fat surrounds body organs (eg, heart, kidneys) and protects them from injury. (4) Fat serves as a carrier for the fat-soluble vitamins A, D, E, and K, which are required for normal nerve propagation, menstruation, and reproduction as well as for growth and maturation during pubescence. Finally, the presence of at least a small amount of fat in the daily diet impacts on the satiety center found in the brainstem. Positive stimulation of this structure causes feelings of gastric fullness that can reduce the total daily caloric intake and helps retard weight gain.
Nutritional Recommendations: Fats
For the most part, body fat is inversely proportional to optimal health. A diet high in fat, especially saturated fat, increases the risk of atherosclerotic cardiovascular disease as well as breast, prostate, and colon cancer.29 The AHA currently recommends that total dietary fat should comprise no more than 30% of the total daily caloric intake. Of this amount, saturated fat should make up no more than 7% to 10% of total calories, no more than 10% should be PUFA, and no more than 15% should be MUFA. PUFA and MUFA should be substituted for saturated fat because saturated fat augments endogenous cholesterol production. Dietary (exogenous) cholesterol should be limited to 300 mg/d. These values change frequently as more research data become available regarding true risk for the development of heart disease. Indeed, as of May 2003, the National Cholesterol Education Program branch of the National Institutes of Health now considers 7% to be the cutoff for the maximum number of calories that should be derived from saturated fat.
Elevated serum triglyceride levels have been associated with an increased risk for the development of heart disease. However, it has become apparent that this risk is confined to the presence of elevated saturated fatty acids and that this risk can be decreased by increasing intake of MUFAs and PUFAs. One such PUFA, omega-3, is of special interest because of its beneficial health effect. Omega-3 is a naturally occurring oil found in cold-water fish, such as cod, tuna, herring, and mackerel. Omega-3 reduces the risk of developing heart disease by preventing clot formation on arterial walls. Indeed, the ingestion of one fatty fish meal per week is associated with a 50% reduction in risk for primary cardiac arrest.30 It also reduces the risk of developing chronic obstructive lung disease among smokers. The AHA recommends two servings of cold-water fish per week.
Currently, only 33% of Americans older than 2 years meet the goal of eating no more than 30% of the diet as fat. Sensible restriction of fat intake should take into account the tremendous energy value of lipid and the need for essential fats like linoleic acid and fat-soluble vitamins.
Proteins
Introduction
Proteins also contain the carbon, hydrogen, and oxygen found in carbohydrates and fats, but their chemical composition also includes phosphorus, nitrogen, iron, and minerals. The major components of proteins are the amino acids. Indeed, proteins are defined on the basis of their amino acid composition (see Fig. 3-1F).
Note that each amino acid contains an amino (NH2)
radical and an organic acid carboxyl (COOH) group that remain consistent across different amino acids. The third major component of the amino acid is the side chain. It is the structural characteristics of the side chain that define the amino acid. There are 20 different amino acids in the human body. This allows amino acids to combine in thousands of combinations to create over 50,000 different proteins that serve roles that range from cellular reproduction to muscular contraction.
There are nine essential amino acids, which are provided exclusively through ingestion. There are nine nonessential amino acids, which are made in the body. The two remaining are derived amino acids, those synthesized from the essential amino acids.
Protein is used primarily for tissue maintenance, repair, and growth. The largest amount of protein is found in skeletal muscle (65%). Protein is the primary constituent of actin and myosin, the contractile elements of skeletal muscle tissue. Amino acids form DNA and RNA and, in the process, encode our genetic characteristics.
Protein is a poor fuel source. There are few hydrogens available for energy conversion, and the process of breaking down protein into usable substrate is metabolically expensive, requiring the removal of nitrogen and its excretion from the body as urea.
Because nitrogen is a component of the amino radical, nitrogen is a useful marker for the presence of protein. When nitrogen intake (protein) equals nitrogen excretion (urea), a nitrogen balance exists. A positive nitrogen balance exists when intake exceeds excretion.
Excess protein, like carbohydrate, gets converted to fat.
CLINICAL CORRELATE
Patients who are very ill and confined to bed may be in a state of “negative nitrogen balance.” This means that protein output exceeds protein intake and that protein is being used as a fuel source. Patients who demonstrate a negative protein balance frequently present with generalized muscle atrophy. Protein supplementation combined with muscle strengthening exercises can make these patients more functional.
Nutritional Recommendations: Proteins
Protein is a poor fuel source to power activities. Nevertheless, protein plays an important role in rebuilding tissue after strenuous exercise and, because there are no nutritional stores of protein in the body, is a vital component of the RDA. The AHA recommends a protein ingestion of 50 to 100 mg/d, or 0.8 to 1.2 g/kg of body weight. This represents 15% of the total daily energy expenditure and provides the body with adequate protein for cell maintenance, repair, and growth.31 Vegetarians need to carefully select a combination of foods that assure adequate intake of the essential amino acids and supplement their diet with vitamin B12, which humans cannot make and must obtain from the diet.
Some substrates are deemed complete proteins because they supply all the essential amino acids. Meat, fish, eggs, and milk fall into this category. Vegetables, grains, and fruits provide a rich source of high-quality protein, particularly nuts, legumes, and cereals. None of these sources are complete proteins in and of themselves, but a well-balanced diet of vegetables, grains, and fruits will provide all the essential amino acids.
CLINICAL CORRELATE
Protein supplementation enjoys widespread popularity among strength trainers and bodybuilders. However, there have been no controlled studies that show that high levels of protein ingestion in bodybuilders contribute to changes in metabolism or improved health.32–34 Indeed, prolonged high-protein ingestion may lead to renal damage and a reduction in bone density.31
Similar to carbohydrates, excess proteins get converted to fat.
Vitamins
Vitamins are organic micronutrients that are necessary, in small amounts, for the normal metabolic functioning of the body. They play highly specific roles in energy transfer and tissue synthesis. Although adequate vitamin intake is necessary for health and wellness, excessive vitamin intake is unnecessary and may, in fact, be harmful. A balanced diet of foods containing the minimal RDA is essential for the prevention of disease. Some foods are associated with reducing the incidence of cancers because of the vitamins they contain. These foods, carotenoids and retinoids, include the green and yellow vegetables, which are rich in vitamin A; citrus fruits and vegetables, rich in vitamin C; and green leafy vegetables, rich in vitamin E. Recent studies have shown that vitamins C and E and carotenoid-rich foods act as antioxidants.35,36 Beta-carotenes (plant products that convert to vitamin A in the body) are also included in this group. Antioxidants are believed to inactivate free radicals (activated oxygen molecules) that result from environmental pollution and cause cell damage that may lead to a variety of diseases. There is an emerging evidence that antioxidants may prevent the development of atherosclerosis. The top 10 antioxidant foods include broccoli, cantaloupe, carrots, kale, mango, pumpkin, red pepper, spinach, strawberries, and sweet potato. The adult RDA of 1.0 mg (vita-min A), 60 mg (vitamin C), and 10 mg (vitamin E) should be met with a diet that meets the RDA standards for carbohydrates, fats, and proteins.
Minerals
Minerals are nonorganic metallic elements that are found naturally in the earth’s crust. They are constituents of hormones, vitamins, and enzymes. Similar to vitamins, adequate mineral intake is required for optimal health, but excessive mineral consumption is not necessary and may be harmful. Although minerals provide no calories or energy, they are important in regulating body function. Two important minerals are iron and calcium. Iron is necessary for the blood to carry oxygen, and calcium is necessary for the development and function of bone, muscle, nerve, and blood. Calcium may also decrease the risk of heart disease. Other key minerals include phosphorous, sodium, zinc, potassium, and chloride. Phosphorus builds teeth and bone, whereas sodium plays a key role in regulating body water. Zinc and potassium assist in healing and are important for muscle function. Minerals should be consumed in the diet in amounts equal to the RDAs. This can generally be accomplished with a diet containing the food servings recommended for carbohydrates, proteins, and fats. Salt should be limited to no more than 4 to 6 g/day. A calcium dietary supplement is not recommended for the general population but is recommended for adults with poor dietary habits, for postmenopausal women, and for individuals on very low-calorie diets.
Water and Fluids
Despite providing no energy or key nutrients, water is a critical component in a healthy diet. Water is in many foods that we eat, and more than half of all body tissues are composed of water. Regular water intake helps maintain the water balance that is critical to many important body functions. It has been popularly reported that lack of water (dehydration) can be the cause of many ailments, including excess body fat, decreased digestive efficiency and organ function, joint and muscle soreness, and water retention.37 Recent research evidence suggests that drinking hard water (water with the minerals left in) may reduce the incidence of heart disease.38 It is generally recommended that the average adult drink eight 8-oz glasses of water each day on top of the water present in the foods we eat.39 It should be noted that more water is needed for more active individuals and for those with exposure to hot environments.40
Caffeine and Alcohol
Coffee, tea, and soft drinks should not be substituted for water. Consuming more than three beverages per day containing caffeine should be avoided, as high caffeine intake may have negative health consequences including dehydration and irregular heart rhythms.
Excessive alcohol intake can be harmful, as alcohol replaces nutrients and increases the risk of hypertension, stroke, heart disease, and osteoporosis. However, current research has provided convincing evidence that moderate daily alcohol ingestion is associated with lower risk of stroke and heart attack, independent of the level of physical fitness.41,42
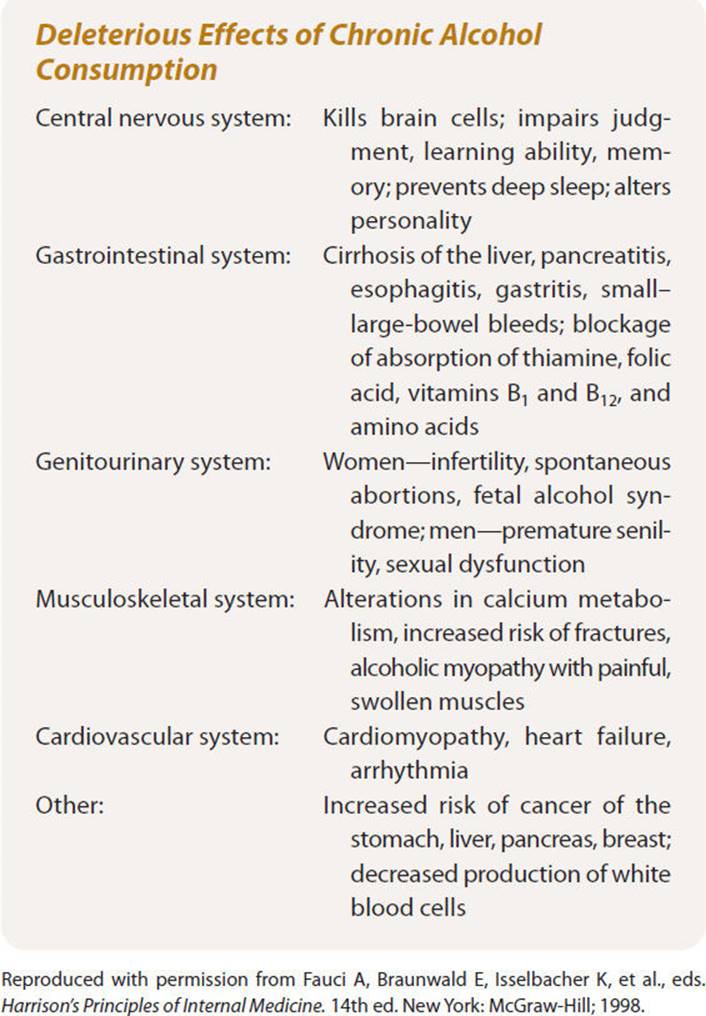
Adults who choose to consume alcohol should do so in moderation. A “drink equivalent” is defined as either a 12-oz bottle of beer, a 4-oz glass of wine, or a 1.5-oz shot of 80-proof spirits. Each of these beverages contains the same amount of alcohol (1/2 oz). Current research has identified that the lowest all-cause mortality among middle-aged men and women occurs in individuals who consume one or two drinks per day.43 Mortality rises rapidly beyond 3 drinks per day. Box 3-1 summarizes the deleterious effects of excessive alcohol consumption.
BOX 3-1 Deleterious Effects of Chronic Alcohol Consumption
Total Recommended Daily Allowance
The total number of calories needed per day is a function of all the metabolic processes that sustain life. These processes reflect both synthesis and breakdown of biomolecules. The total daily energy expenditure is a function of three variables: the RMR, the thermogenic effect of food that is consumed, and the energy utilized during activities of daily living and other exercise states.6,44,45
Box 3-2 lists dietary recommendations derived from guidelines provided by the American Dietetic Association, the AHA, and the American Cancer Society for a healthy North American diet. Currently, poor eating habits span all age groups. As a nation, many Americans are overweight, eat foods that are too high in fat and salt, and eat too little complex carbohydrates and fiber. Many women and children do not eat enough foods rich in iron and calcium. Eating well can reduce an individual’s risk of developing a variety of health problems. Many medical conditions including cardiovascular disease, stroke, diabetes, colon cancer, hypertension, and osteoporosis are affected by eating patterns. Figure 3-2 depicts some possible health problems associated with poor dietary habits.
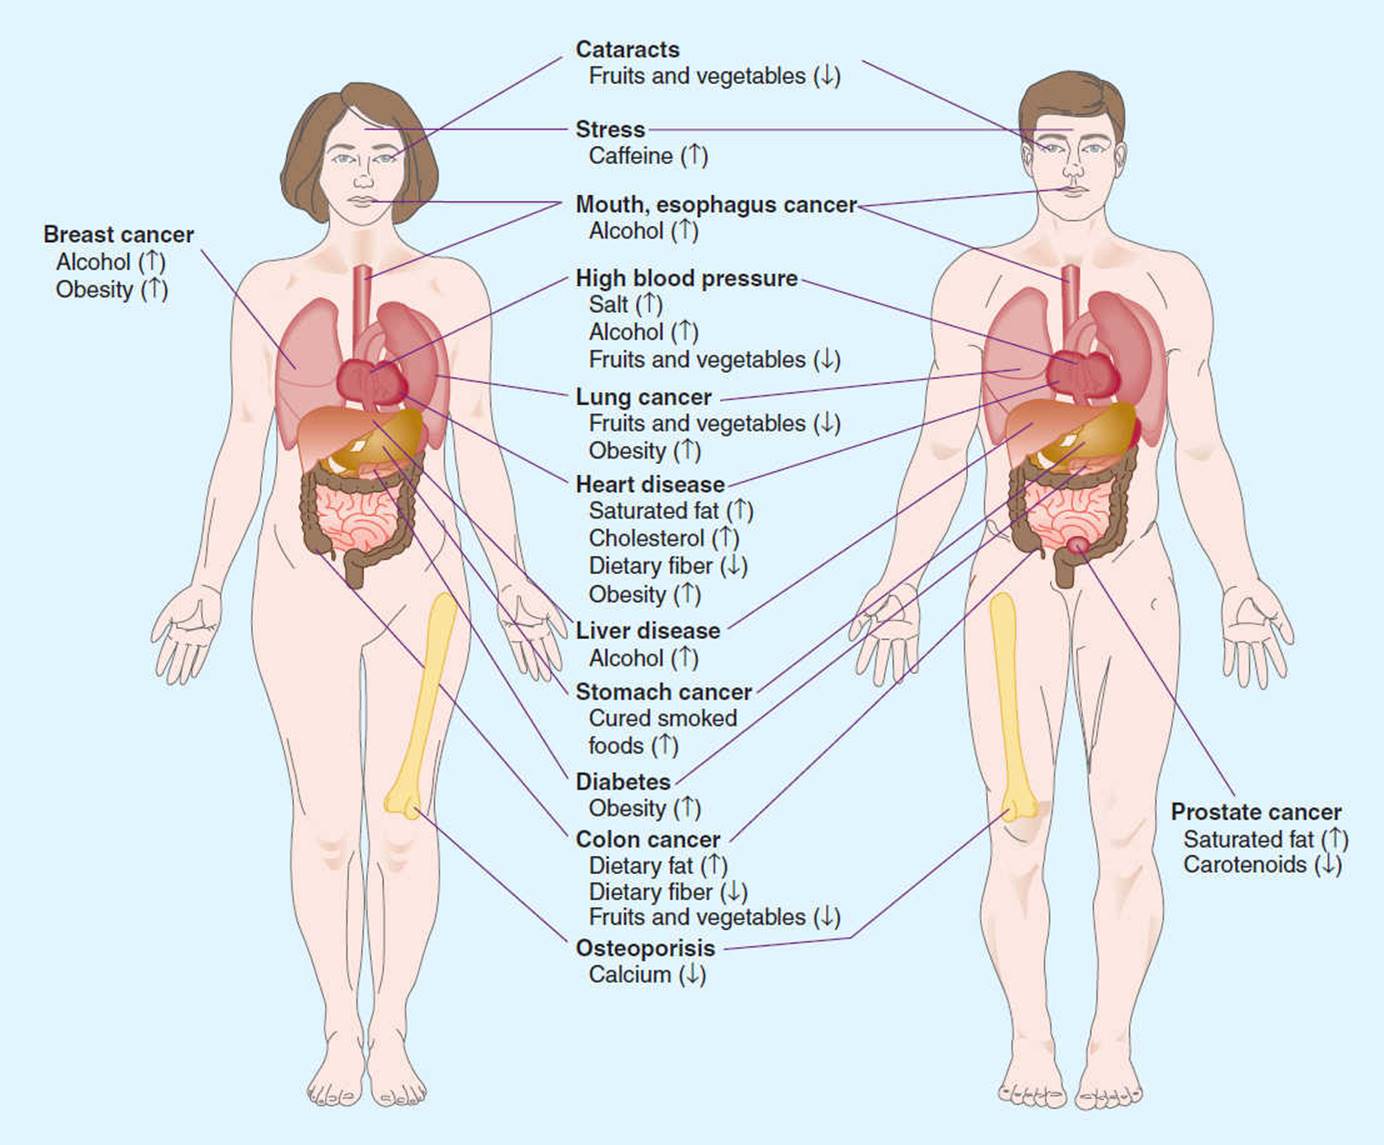
FIGURE 3-2 Possible health problems associated with poor dietary habits. (Reprinted with permission from Williams MH, ed. Nutrition for Health, Fitness, and Sport. 5th ed. New York: McGraw-Hill; 1999.)
BOX 3-2
Recommendations for a Healthy North American Diet
Balance the food you eat with physical activity to maintain or improve your weight.
Eat a nutritionally adequate diet consisting of a wide variety of foods.
Choose a diet that is low in total fat, saturated fat, and cholesterol.
Choose a diet with plenty of whole-grain products, legumes, fruits, and vegetables that are rich in complex carbohydrates and fiber.
Choose a diet moderate in sugars.
Choose a diet moderate in salt and sodium.
If you drink alcoholic beverages, do so in moderation. Pregnant women should not drink any alcohol.
Maintain protein intake at a moderate, yet adequate level, obtaining much of your daily protein from plant sources. Choose a diet adequate in calcium and iron.
Children and others susceptible to tooth decay should obtain adequate fluoride.
In general, avoid taking dietary supplements in excess of the RDA in any 1 day.
Eat fewer foods with questionable additives.
![]() O2 and caloric expenditure vary over the course of a day depending on exercise state, ambient temperature, and mental status. On an average, a moderately active typical young man requires a total of approximately 3,000 kcal/day. A moderately active woman needs approximately 2,000 kcal/day.28 It should be noted that these values are also a function of daily activity, lifestyle, and profession: A male athlete in training may burn 3,500 to 6,000 kcal/day, whereas a female athlete may expend 2,600 to 4,500 kcal/day.
O2 and caloric expenditure vary over the course of a day depending on exercise state, ambient temperature, and mental status. On an average, a moderately active typical young man requires a total of approximately 3,000 kcal/day. A moderately active woman needs approximately 2,000 kcal/day.28 It should be noted that these values are also a function of daily activity, lifestyle, and profession: A male athlete in training may burn 3,500 to 6,000 kcal/day, whereas a female athlete may expend 2,600 to 4,500 kcal/day.
Maintenance of Body Weight
For body weight to remain constant, caloric intake must equal energy output. If too much food is consumed, a positive energy balance results and the individual will gain weight. In contrast, if our energy needs are greater than the caloric intake, a negative energy balance occurs. In the latter example, the body utilizes stored fat for energy, resulting in a loss in body weight.
OVERWEIGHT AND OBESITY
Obesity is a serious health problem that reduces life expectancy by increasing one’s risk of developing coronary artery disease, hypertension, type 2 diabetes mellitus, obstructive pulmonary disease, osteoarthritis, and certain types of cancer.46–48 Having too little body fat also presents a health risk because body fat is required for normal physiological functions such as cell membrane formation, thermal insulation, and storage of free fatty acids. Further evidence tells us that the increased risks are not only related to the total amount of body fat but also to the way in which fat is distributed. Intra-abdominal or visceral fat is a stronger predictor of cardiovascular disease49,50 and other metabolic disorders (type 2 diabetes) than overall body fat.
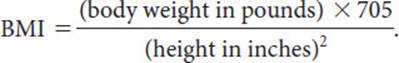
Being overweight is defined as having body weight in excess of a reference standard, usually a mean weight for a given height, skeletal frame size, grouped by sex.51 When assessing the health status of a large population, a synthesis of mass and height—the body mass index (BMI)—is often computed. The BMI is a weight-to-height ratio using the metric formula:
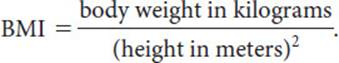
When measurements are recorded in pounds and inches, the following equation may be used:
A BMI score of 18.5 to 24.9 is considered ideal, whereas a BMI score less than 18.5 is considered underweight. Scores falling between 25.0 and 29.9 are considered overweight; those between 30 and 34.9, grade 1 obesity; those between 35.0 and 39.9, grade 2 obesity; and those greater than or equal to 40 represent grade 3 obesity.52
Body Composition Assessment
Although widely used, the BMI does not take into account the body composition of the individual. Use of this index supports the misconception that body weight is more important than body fatness. Many patients are concerned about losing body weight and desire to be thin, without recognizing that there is an important distinction between being thin and being lean. Although thinness is related to body weight, leanness is associated with the composition of the individual’s body weight. The use of height–weight norms can lead to erroneous conclusions about one’s level of body fatness and health risk. Obesity is better defined as an excess amount of total body fat for a given body weight and is most accurately assessed through body composition analysis.
Body composition is often expressed as the relative amount of fat mass (FM) to FFM. FM is composed of both essential fat and storage fat. Essential fat represents approximately 3% of body weight in adult men and 12% of total body weight in adult women.53 The FFM includes all body tissues, water and other fluids, muscle, bone, connective tissues, and internal organs. Although FFM and LBM are often used interchangeably, in practice LBM includes the constituents described for FFM and adds the essential fat.
To classify the level of body fatness, the relative body fat (% body fat) is obtained by dividing the FM by the total body weight. See the following equation:
% body fat = (FM/body weight) × 100.
A healthy range of body fat is 12% to 18% for men and 18% to 23% for women. Most health care providers agree that men with more than 25% body fat and women with more than 30% body fat are obese.54
Once an individual’s body composition is measured, an ideal body weight can be calculated. This can be a useful computation to educate the patient or client who has an unrealistic expectation of their “ideal” weight. Assuming LBM remains constant, desired or ideal weight can be computed as follows:
fat weight = current weight × (% fat/100).
lean body mass (LBM) = current weight − fat weight.
ideal weight = LBM/[1 − (% fat desired/100)].
desired weight loss or weight gain = present weight − ideal weight.
The previous equations can be used to compute long-term or short-term goals. For example, a client weighs 68 kg, 29% fat, and wants to target an ideal body fat of 23% while retaining the same level of LBM. For this client,
fat weight = 68 × (29/100) = 19.72 kg,
lean body mass (LBM) = 68 − 19.2 = 48.8 kg,
ideal weight = 48.8/[1 − (23/100)] = 63.38 kg,
and
desired fat loss = 68 − 63.38 = 4.6 kg (10.2 lb).
Techniques for Measuring Body Composition
The most accurate measure of body composition is by direct chemical extraction of all fat from body tissues. This technique is obviously not appropriate for clinical practice! Several indirect methods are available for measuring body composition in clinical settings. Some of the more common methods and estimated prediction errors will be described in this section. All techniques currently used to predict body density and body fat are prone to error. The “gold standard” of body composition, underwater weighing, will be described followed by common clinical techniques.
Underwater Weighing
Underwater (hydrostatic) weighing is the most widely used laboratory procedure for determining body density. The technique, often the criterion method in validation studies, is based on Archimedes’ principle that “a body immersed in a fluid is acted upon by a buoyancy force in relation to the amount of fluid the body displaces.” Because fat is less dense and bone and muscle mass are more dense than water, a given weight of fat will displace a larger volume of water and exhibit a greater buoyant effect than the corresponding weight of bone and muscle tissue. Body density is, therefore, equivalent to the mass (weight) of the body in air divided by the body volume. The body volume can be indirectly determined through underwater weighing. Body density (Db) is computed as follows:
Db = Wa/[((Wa – Ww)/Dw) – RV –0.1]
where Db is body density (g/mL), Wa is body weight out of the water (kg), Ww is body weight in water (kg), Dw is the density of water (g/mL), and RV is residual volume (mL). The constant of 0.1 L accounts for air volume trapped within the gastrointestinal tract. Residual lung volume can be predicted based on age, height, and gender or more accurately measured using the helium dilution or nitrogen washout techniques.
After body density is determined, percentage body fat is predicted using either Siri55 or Brozek56 equations:
Siri: % body fat = [(4.95/Db) − 4.50] × 100.
Brozek: % body fat = [(4.75/Db) − 4.124] × 100.
Although underwater weighing is considered the “gold standard,” the standard error has been estimated to be 2% to 2.5%. When residual volume is estimated from prediction equations, the error of estimation of percentage of body fat can increase by up to 3%.
Dual-Energy X-ray Absorptiometry
Dual energy X-ray absorptiometry (DEXA) is an imaging procedure that can be used to quantify regional body fat, muscle, and bone mineral content. This technique is gaining popularity as a criterion method. A scintillation detector analyzes the penetration of two distinct energy peaks from a source of the high-activity isotope gadolinium-153 (153Gd). Specialized computer software is used to reconstruct the image and determine body composition. Estimation errors between DEXA and densitometry have been found to be less than 2% to 4% in adults.57 DEXA is an accepted method to measure spinal osteoporosis and related bone disorders.
Skinfolds
Assessing body composition by measuring the thickness of selected skinfold sites is probably the most commonly and widely available technique used in practice today. From the subcutaneous fat measurements made with skinfold calipers, percentage body fat is derived through various regression equations. Box 3-3 summarizes some of the more common standardized skinfold sites. Once the measurements are recorded, regression equations like those listed in Box 3-4 can be used to calculate body density and the Siri and Brozek equations are used to compute percentage body fat.
BOX 3-3
Skinfold Sites
Abdominal fold: A vertical fold taken at a distance of 2 cm to the right of the umbilicus.
Biceps fold: A vertical fold taken (1 cm above the level used to mark the triceps) on the anterior aspect of the arm over the belly of the biceps muscle.
Chest/pectoral fold: A diagonal fold taken half of the distance between the anterior axillary line and the nipple for men and one-third of the distance between the anterior axillary line and the nipple for women.
Medial calf fold: A vertical fold at a level of the maximum circumference of the calf on the midline of the medial border.
Midaxillary fold: A vertical fold taken on the midaxillary line at the level of the xyphoid process of the sternum.
Subscapular fold: An angular fold taken at a 45-degree angle 1 to 2 cm below the inferior angle of the iliac crest taken in the anterior axillary line immediately superior to the iliac crest.
Suprailium fold: An oblique fold in line with the natural angle of the iliac crest taken in the anterior axillary line immediately superior to the iliac crest.
Thigh fold: A vertical fold on the anterior midline of the thigh, midway between the inguinal crease and the proximal border of the patella. The midpoint should be marked while the subject is seated.
Triceps fold: A vertical fold on the posterior midline of the upper right arm, halfway between the acromion and olecranon processes. The elbow should be extended and relaxed.
Data from Jackson AS, Pollock ML. Generalized equations for predicting body composition. Brit J Nutr. 1978;40:497-504.
Data from Jackson AS, Pollock ML, Ward A. Generalized equations for predicting body composition in women. Med Sci Sports Exerc. 1980;12:175-182.
BOX 3-4
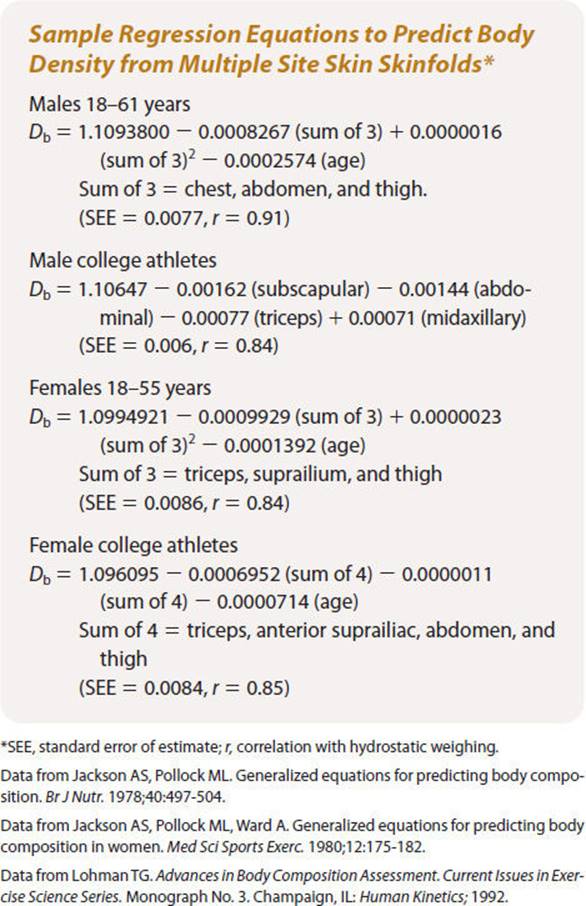
Because skinfold measurements are subject to intertester error, the same tester should be used for repeated measurements when possible. Intratester variability often found with inexperienced testers will also contribute to the measurement error. Therefore, it is recommended that the proficiency of skinfold technique be acquired under the direct supervision of an experienced evaluator performing several hundred assessments.
In terms of technique, it is better to take measurements when the skin is dry. The skinfold is grasped firmly by the thumb and index finger, and the caliper is placed perpendicular to the fold at approximately 1 cm (1/2 in.) below the thumb and finger. While maintaining the grasp of the skinfold, allow the caliper to be released so that the tension is exerted on the skinfold. Wait approximately 2 seconds for a slight drop to occur resulting from initial tissue compression. Read the caliper to the nearest 0.5 mm and record. Prior to removing the caliper from the skinfold site, depress the thumb trigger to release caliper tension and tissue compression; remove the skinfold and slowly release the trigger allowing the caliper jaws to gradually come together. The tester should alternate between sites and repeat measurements. A third measurement should be taken when the first two vary by more than 1 mm. When population-specific prediction equations are appropriately selected, the predicted value of body fat for an individual usually correlates well with hydrostatic weighing (r 0.70–0.90) and within 3.5% of the body fat determined by the criterion method.58,59
The error of estimation of skinfold assessment is approximately 3%.
Bioelectrical Impedance Analysis
Another technique that holds good clinical promise is bioelectrical impedance analysis (BIA). This technique is based on the principle that the resistance to an electrical current is inversely related to body water. The richer electrolyte content of FFM has much greater conductance than does fat, allowing the establishment of a relationship between conductance and FFM. A very low-level, high-frequency current is passed through the body. Impedance is a function of resistance, the pure opposition to current flow through the body, and reactance is the opposition to current flow caused by capacitance. Because the magnitude of resistance is much greater than the reactance and resistance is a better predictor of FFM and body water, the resistance index of (height)2/resistance is used in many BIA models. Both population-specific and generalized prediction equations are available to determine FFM and percentage body fat.
BIA is most accurate when the subject being tested is normally hydrated and when the temperature of the room is comfortable. Dehydrated subjects may be estimated to have less lean mass (and more fat) than if they were properly hydrated. To standardize, hydration subjects should urinate within 30 minutes of the test, consume no alcohol 48 hours prior to the test, avoid vigorous exercise within 12 hours of the test, and fast for 4 hours before the test. Excessive water intake may result in water retention, abnormally high water amounts, and a high lean mass estimation. Validation studies have yielded estimation errors comparable to skinfolds (approximately 3% body fat) when guidelines were followed to avoid alterations in hydration.
Near-infrared Interactance
The instrument consists of a small, compact, AC/DC-powered microprocessing unit and a handheld, infrared miniature flashlight-type transducer probe placed over the right biceps, halfway between the antecubital fossa and the anterior axillary fold. The NIR energy is generated at two specific wavelengths. A silicon detector located at the center of the probe measures the reemitted NIR energy. Optical density measurements are included in prediction equations for computing percentage body fat. Several manufacturer prediction equations are included for predicting body fat, FFM, and total body water in both children and adults. Studies have yielded conflicting support for this method. A trend has been that NIR overestimates body fat in lean subjects and underestimates body fat in subjects with more than 30% body fat. For these reasons, NIR cannot be considered reliable at this time.
Excess carbohydrate and fat get stored in adipose tissue as triglyceride. The body composition assessment techniques described previously are designed to measure body fat and FFM. Excessive kilocalorie intake results in increased body weight and a higher percentage of body fat. Weight-reduction programs target individuals at risk for the development of heart disease as well as individuals with manifest heart disease. Successful weight management involves a reduction of daily caloric intake and an increase in caloric expenditure through an exercise program. The following section describes the physiological processes involved in the use of specific fuel substrates to power specific kinds of activities.
INTRODUCTION TO ENERGY STATES
Preferential Use of Nutrients During Exercise
Normal activities of daily living place physical demands on our body that may range from sitting quietly in a chair to an all-out run to catch a bus. Activities of different intensities require different energy substrates, or a different mix of carbohydrate, fat, and protein. This section will identify three different kinds of energy states and associate these energy states with the fuel substrates that power them.
CLINICAL CORRELATE
The reader should keep in mind that an individual’s degree of physical fitness determines what is “low-intensity” exercise and what is “high-intensity” exercise. A low level of activity (eg, climbing up a flight of stairs) for a healthy normal person may be a high level of activity for a sedentary obese individual or a person with chronic lung disease!
The following discussion describes exercise states relative to the healthy normal individual.
Low-Intensity Exercise
Low-intensity exercise states generally refer to most activities of daily living. These activities include walking around the house, climbing a flight of stairs, light housework, showering, and dressing, etc. These kinds of activities, among healthy normal persons, provoke only a mild increase in heart rate (HR) and blood pressure and do not cause undue fatigue. The metabolic energy requirements are low, generally just a few METs (eg, 3 METs), or multiples above the RMR. Oxygen is utilized by working skeletal muscle to power these low-energy activities and is matched by delivery of oxygen via the blood. As long as there is an adequate amount of energy substrates, and oxygen utilization is matched by oxygen delivery, exercise can continue for a prolonged period of time.
The predominant fuel substrate of choice for such activities is fat, in the form of free fatty acids and triglycerides.60,61 These fatty acids are mobilized in the blood, whereas triglycerides are stored in fat vacuoles within the muscle cell. Recall the great number of hydrogen molecules attached via a single bond to the fatty acid chain: Fatty acids offer an efficient “high yield” source of hydrogens, for quick conversion to energy during low-level activities that make up a large part of our day.
Fat is stored in fat cells, called adipocytes, present in adipose tissue. The mobilization of fatty acids is augmented by glucagon, epinephrine, and norepinephrine—all of which increase as a result of exercise.
High-Intensity Exercise
High-intensity exercises of short duration occupy the other end of the energy spectrum. Running as hard and as fast as you can is a perfect example of the utilization of this system. This activity is accomplished at a very high-intensity level for a short period of time and many multiples above the RMR. Maximal running causes a dramatic increase in both HR and blood pressure. There may be shortness of breath, as the demand for oxygen by working skeletal muscle outstrips the supply, and feelings of fatigue or exhaustion. Clearly, activities of this intensity cannot be performed for very long, and there may be a prolonged recovery period while the subject “catches his or her breath.”
High-intensity activities are accomplished through the utilization of circulating blood glucose and muscle glycogen. In fact, glucose is the only fuel substrate that can be used in the absence of oxygen availability.
Moderate-Intensity Exercise
The third type of exercise that humans engage in is moderate or prolonged exercise. It falls somewhere between the two extremes of low-intensity exercise and high-intensity exercise. A good example of this is the programmed exercise that we engage in when we are trying to lose weight or become physically fit. Jogging 4 miles at a comfortable pace, for instance, causes a moderate increase in MET level (eg, 7.0 METs). It places only a moderate demand on the cardiopulmonary system: For example, the HR may go up to 60% of the maximum attainable HR, and the systolic blood pressure (SBP) may go up 30 mmHg above resting. The healthy normal subject will be breathing deeply and rapidly but will not feel short of breath. Indeed, the subject will be able to continue jogging for perhaps 30 minutes, or longer, at this level. At the end of exercise, the subject should feel comfortably fatigued, but not exhausted. Moderate, relatively brief exercise of this kind is powered by similar amounts of glucose, muscle glycogen, cellular triglycerides, and free fatty acids. Each skeletal muscle cell contains its own glycogen store. As exercise continues, these glycogen stores are tapped, and when these stores deplete, blood glucose is mobilized from the liver. As both glucose and glycogen deplete, fat takes over as the primary substrate. As can be seen, the relative “mix” of fuel substrates changes continually depending on what we are doing. Indeed, there is a dynamic interplay between carbohydrate and fat, as we move from varying intensities and durations of exercise (Fig. 3-3).
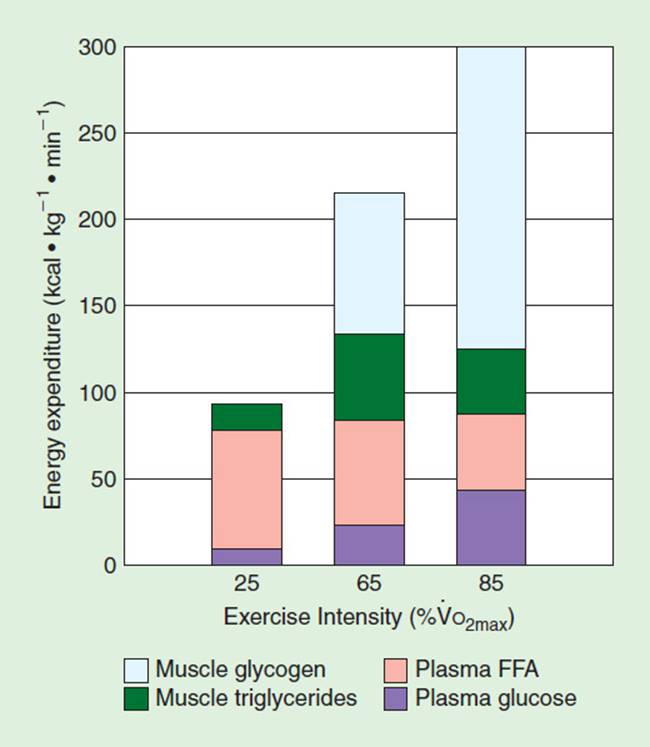
FIGURE 3-3 Change in energy substrates relative to intensity of exercise on a bicycle ergometer. Note the reliance on free fatty acids to power low-level exercise and the increased reliance on glycogen at 85% ![]() O2peak. (Reproduced with permission from Romijn JA et al. Regulation of endogenous fat and carbohydrate metabolism in relation to exercise intensity and duration. Am J Physiol. 1993;265: E380.)
O2peak. (Reproduced with permission from Romijn JA et al. Regulation of endogenous fat and carbohydrate metabolism in relation to exercise intensity and duration. Am J Physiol. 1993;265: E380.)
Carbohydrate, fat, and protein and their energy potential have been described. Significance was attached to hydrogen atoms attached with a single bond to the substrate chain, and it was noted that energy is released when these hydrogen bonds are broken. Now, we will discuss how that energy is captured, transferred, and released to accomplish musculoskeletal work.
CONVERSION OF SUBSTRATES TO ENERGY
Adenosine Triphosphate: ATP
ATP Breakdown
The compound that captures and binds energy from hydrogen cleavage is adenosine triphosphate or ATP. ATP consists of an adenosine group and three phosphate groups. ATP is referred to as a high-energy phosphate compound (phosphagen), but compared to other high-energy phosphate compounds it occupies a middle position, somewhere between very high and very low phosphagens. Because of its middle position, ATP can both give up and accept terminal phosphates rather easily, thus making it an ideal transporter of energy. Energy is released when (usually) the terminal phosphate group is cleaved off; when the terminal phosphate group is reattached, energy is absorbed. When ATP loses its terminal phosphate, it becomes ADP and releases energy through the process called hydrolysis:
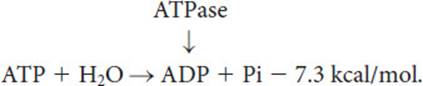
This reaction does not require the presence of oxygen. It is thus an anaerobic process that occurs virtually all the time and under a wide variety of conditions. In addition to powering high and low exercise states, energy derived from the splitting of ATP maintains tissue BMR, provides energy to transport material across cell walls, and maintains homeostasis.
There is only a small amount of ATP stored in the body; thus, ATP must be continually resynthesized.
ATP Synthesis
There are two ways of making ATP: first, anaerobic and second, aerobic. The anaerobic reactions involve the direct transfer of energy from the substrate to ADP via phosphorylation and are termed substrate phosphorylation. This process occurs in the watery medium of the cell. Substrate phosphorylation produces ATP from ADP and is accomplished via another compound, phosphocreatine or PC, in the reaction
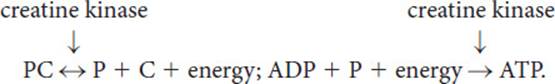
As before, breaking the bond between molecules releases energy. This released energy is used for muscular exertion, chemical work, etc. ADP is then easily reconverted back to ATP and the cycle repeats. The enzyme creatine kinase makes this reaction go very quickly. The utilization of PC as a phosphate donor for the production of ATP occurs anaerobically. PC exists in a ratio of 4:1 compared to ATP. Thus, ATP resynthesis occurs four times before this system is depleted.
The second method of making ATP occurs aerobically in the mitochondria of the cell, primarily during the later stages of glucose degradation in the citric acid (Kreb) cycle. Oxidative phosphorylation is the process whereby hydrogens are stripped off substrate molecules, their electrons are passed down an electron transport chain within the mitochondria, and energy is released, which is then packaged in the form of ATP (see Fig. 3-4). As can be seen, while water is the end product of oxidative phosphorylation, ATP is formed as a by-product.
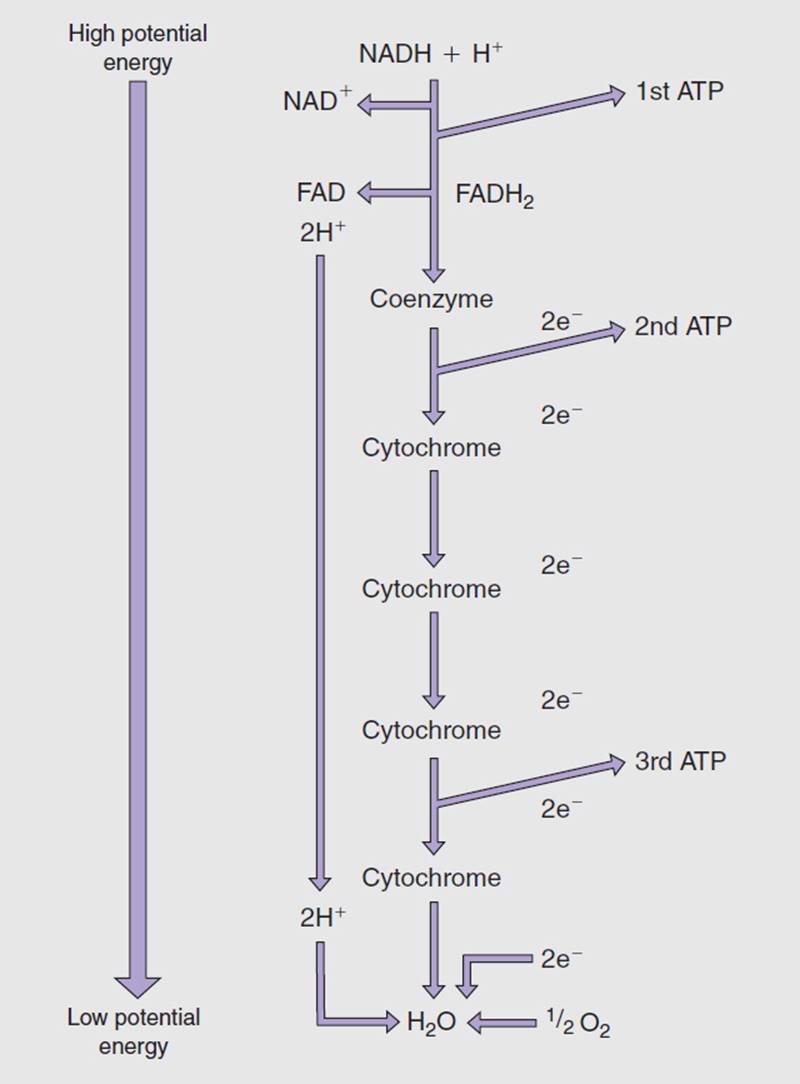
FIGURE 3-4 The production of ATP through the intramitochondrial process of oxidative phosphorylation. Note the production of metabolic water as an end product, and the production of ATP as a by-product.
Oxidative phosphorylation generates ATP as long as there are adequate amounts of enzymes, a supply of electrons (substrate), and oxygen. Oxidative phosphorylation predominates during low-and moderate-intensity exercise states, when oxygen supply matches demand in the production of ATP. The small amount of hydrogen ion present in the cytoplasm is rapidly cleared from the area by venous blood flow. However, during intense bouts of exercise, the demand for oxygen in exercising muscle outstrips the supply. The two hydrogens that “meet” oxygen and the two electrons to form water have no hydrogen receptor (see Fig. 3-4). Hydrogen ion builds up, the rate of hydrogen production exceeds the ability of the venous system to clear it, and the pH drops. This can have unpleasant consequences that take the form of cramping muscle pain, inhibition of muscle contraction, and the inability to continue exercise. We shall finish the story of excess hydrogen ion later in the discussion of glycolysis. Because glucose is the primary fuel source for chemical, electrical, and mechanical work, we shall examine the degradation of this molecule in some detail.
One final thought: Storage of ATP is minimal. However, ATP can be manufactured quickly through the aid of key enzymes in order to respond to sudden increases in activity levels.
THE METABOLIC MILL
Glucose is the primary substrate that powers physical activity and is the only fuel that can be used in high-intensity exercise. It is decomposed in two phases by way of a metabolic mill—glycolysis and the citric acid cycle. Glycolysis breaks down C6H12O6 into two 3-carbon fragments to the level of pyruvic acid. The remaining energy is extracted via the citric acid cycle (Krebs or tricarboxylic acid cycle).
Glycolysis
Glycolysis occurs in the cytoplasm, or watery medium of the cell. It is thus primarily an anaerobic process and is the primary mechanism for ATP production in fast-twitch, glycolytic, or “white” muscle fibers that are resident in almost all muscle groups, especially those in the upper extremity, and the tibialis anterior, etc., where speed is a primary functional goal. Food substrates, including the many types of carbohydrates, must be reduced to glucose in order to enter the metabolic mill at stage I (see Fig. 3-5). This figure shows 10 chemical reactions that first reduce glucose to two 3-carbon fragments and finally degrade glucose down to 2 molecules of pyruvic acid. The process of glycolysis is essentially a downhill series of chemical reactions that break chemical bonds and release energy. Along the way, however, this released energy is used to drive uphill chemical reactions that capture this energy in the form of ATP. Evidence of anaerobic (substrate) phosphorylation is found at points C and D. Also of note is the early utilization of ATP (points A and B). This represents the energy of activation, initial energy that must be put into the system in order to “prime the pump.” Finally, note that a total of four ATP are produced via oxidative phosphorylation, as two pairs of hydrogen electrons get passed to FAD, bypassing the formation of the first ATP, before being sent down the electron transport system (see Fig. 3-4).
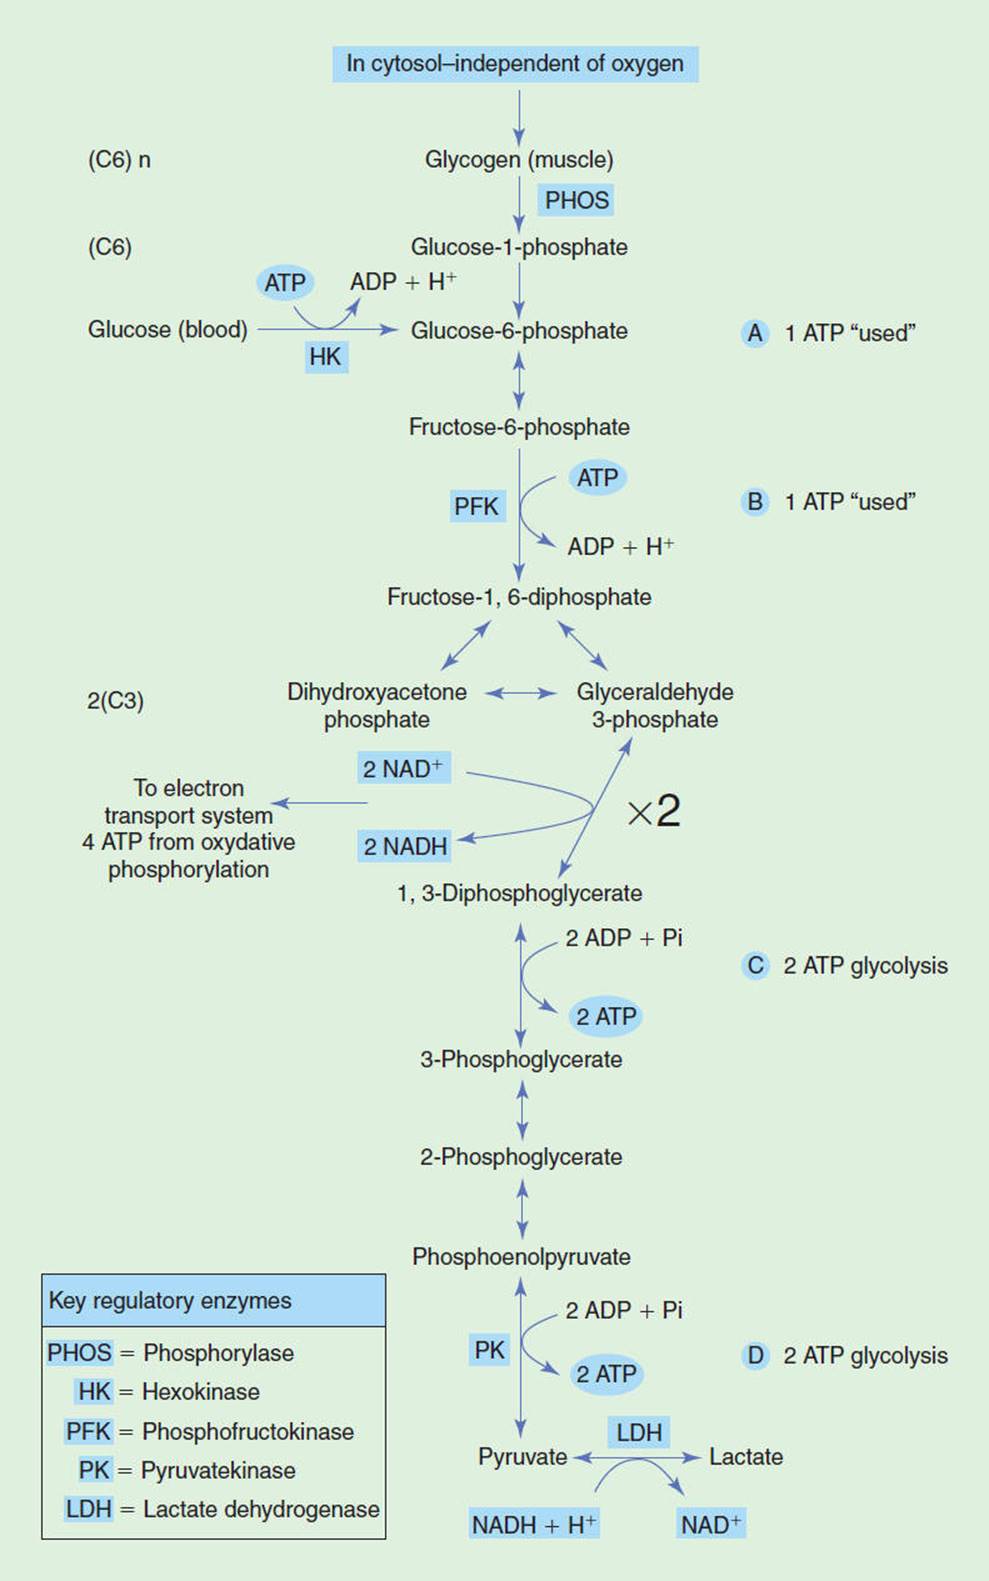
FIGURE 3-5 The degradation of the glucose molecule to the level of pyruvate in the cell cytoplasm of skeletal muscle via glycolysis. This process allows the rapid production of a small quantity of ATP via substrate phosphorylation. (Modified with permission from Foss M, Keteyian S. Fox’s: Physiological Basis for Exercise and Sport. 6th ed. Boston, MA: WCB McGraw-Hill; 1998.)
By the time the glucose molecule has been reduced to pyruvic acid, a NET total of two ATP have been produced via substrate phosphorylation and four ATP have been produced via oxidative phosphorylation in skeletal muscle.62It should be noted that in cardiac muscle, a total of six ATP are produced via oxidative phosphorylation, as the two pairs of hydrogen electrons get shuttled to intermitochondrial NAD, producing three ATP per electron pair.
There are a multitude of enzymes associated with the stages of glycolysis, making the production of ATP via substrate phosphorylation relatively rapid. However, only a small amount of ATP can be generated during glycolysis. Glycolysis is unable to make large quantities of ATP. However, the series of chemical reactions can occur very quickly. Thus, glycolysis is capable of powering high-intensity exercise but can only sustain this intensity for a short period of time.
The formation of pyruvic acid marks the end of glycolysis. Pyruvic acid is a close cousin to lactic acid, the latter molecule having an additional two hydrogens. These two compounds play an important role during high exercise states when oxidative phosphorylation becomes inefficient, as oxygen becomes unavailable and hydrogen ion builds up in the cytoplasm. During high-intensity exercise, local skeletal muscle pH drops, producing a crampy pain that can be very uncomfortable. A coenzyme, NAD, picks up excess hydrogen as pairs and delivers them to pyruvic acid, which then changes its name to lactic acid:
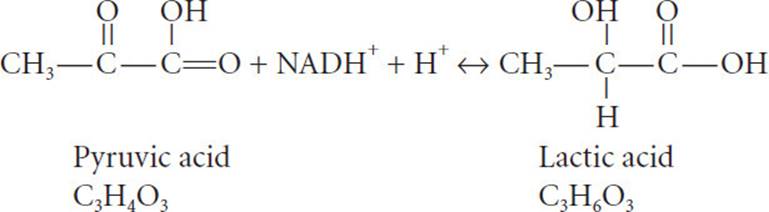
Lactic acid thus serves as a sump that picks up excess hydrogen and brings the pH back up. Lactic acid gets recirculated to myocardial tissue, where it is used to power myocar-dial contraction. In addition, lactic acid gets carried by the bloodstream to the liver, where it is converted back to pyruvic acid for ultimate resynthesis back into glucose. This may sound like an efficient system, and it is! But only 5% of the total potential energy of a mole of glucose is extracted in glycolysis. The citric acid cycle extracts the remaining 95%.
Citric Acid Cycle
The citric acid (Krebs) cycle occurs in the mitochondria of the cell. It is, thus, primarily an aerobic process and is the primary mechanism for ATP production in type I oxidative slow-twitch, “red” muscle fibers that are resident in all skeletal muscles but predominate in muscles of the trunk, where tonic sustained muscle contraction is a primary goal. The two molecules of pyruvic acid formed at the end of glycolysis enter the metabolic mill at stage I (see Fig. 3-6). This figure shows a series of chemical reactions that first reduce pyruvic acid to acetyl CoA and then spin the remaining fragments around in a cycle that allows the coenzymes NAD and FAD to cleave off hydrogens for further processing down the electron transport system as part of oxidative phosphorylation. Because NAD is picking up hydrogens as pairs of electrons within the mitochondria, each pair of electrons produces a total of three ATP via oxidative phosphorylation; intramitochondrial FAD produces two ATP. In the citric acid cycle, a total of 30 ATP are produced via oxidative phosphorylation, and 2 ATP from guanosine triphosphate as part of substrate phosphorylation. The citric acid cycle supplies large quantities of hydrogen atoms, which get sent down the electron transport system within the mitochondria. This process produces a lot of ATP via oxidative phosphorylation. However, this series of chemical reactions occurs more slowly than glycolysis. Thus, the citric acid cycle is capable of powering moderate-intensity exercise, which can be sustained for a protracted period of time.
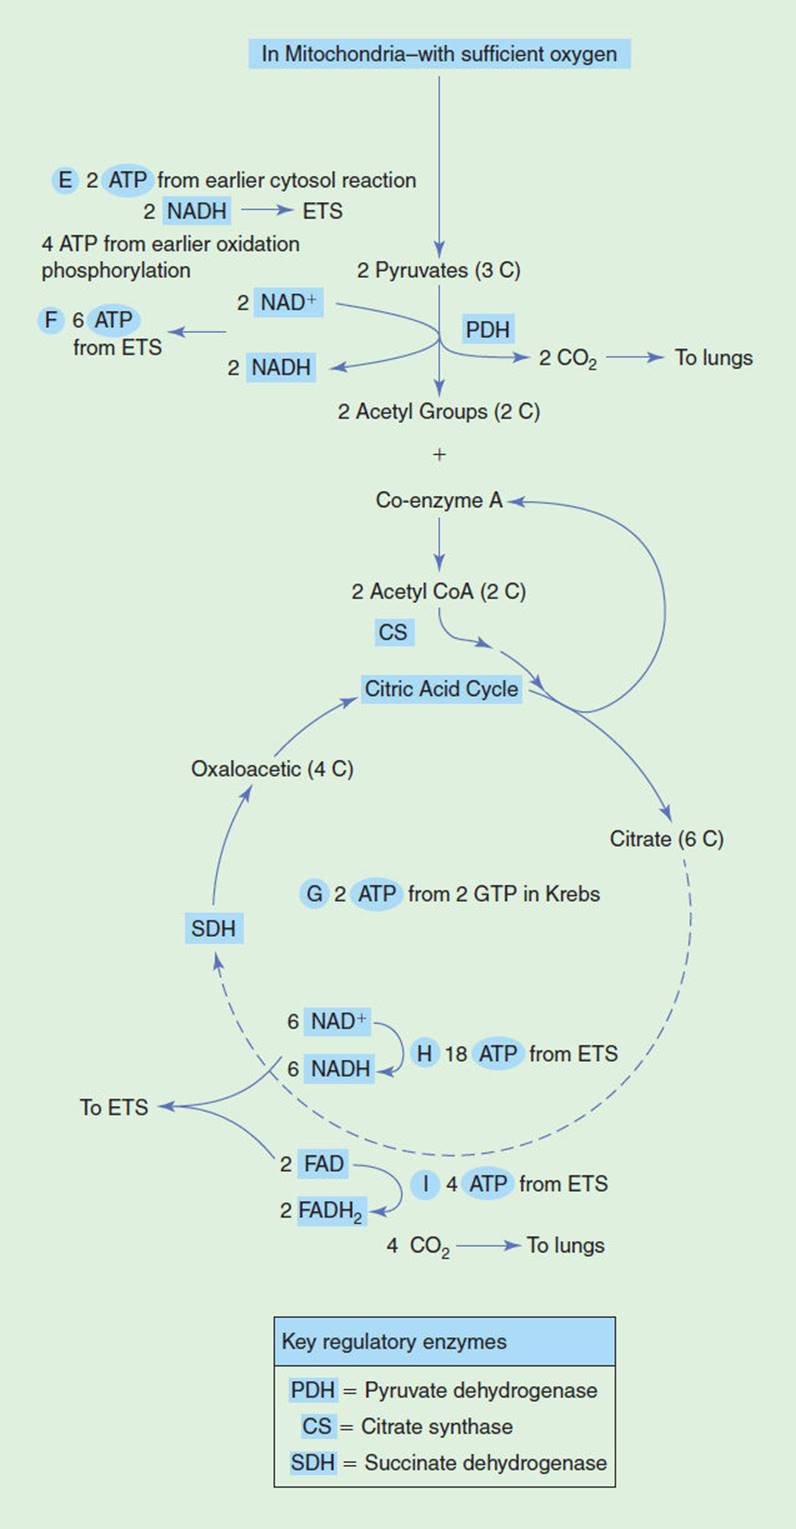
FIGURE 3-6 The degradation of pyruvate in the mitochondria of a skeletal muscle cell, producing a large quantity of ATP via oxidative phosphorylation in the citric acid cycle. (Modified with permission from Foss M, Keteyian S. Fox’s: Physiological Basis for Exercise and Sport. 6th ed. Boston, MA: WCB McGraw-Hill; 1998.)
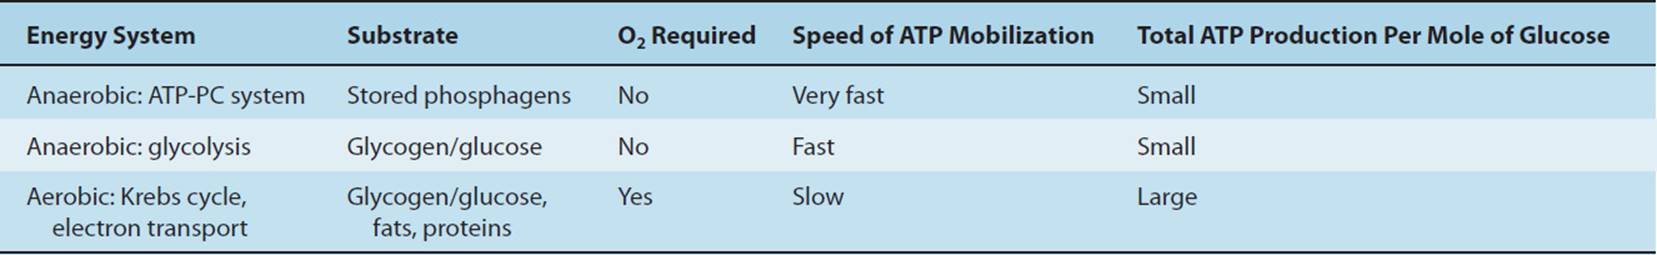
To summarize: The total degradation of a mole of glucose is accomplished anaerobically via glycolysis and aerobically via the citric acid cycle, yielding 686 kcal of energy, which is used to produce a total of 36 ATP from blood glucose in skeletal muscle and 38 ATP in cardiac muscle. This remarkable process increases or decreases its production of ATP depending on the metabolic need. The intensity of exercise, or the time rate of change of doing work, is an important signal that triggers the production of ATP. Glycolysis may predominate when the intensity of effort is high; the citric acid cycle may predominate when the metabolic demand for energy (ATP) is moderate or effort is of long duration.Table 3-2 summarizes the relationship between energy systems and their ability to manufacture ATP.
Fat Utilization
Fat is stored in the body as triglyceride. This molecule gets mobilized, especially by slow-twitch oxidative type I, “red” muscle fibers, during low levels of exercise and during prolonged exercise of moderate intensity when glycogen stores become depleted. The breakdown of triglyceride begins with the separation of the glycerol component from the three glycerides. Glycerol enters into the metabolic mill as glyceralde-hyde 3-phosphate. It then becomes reduced to pyruvic acid, just like glucose, and enters the citric acid cycle for further reduction. Each of the 3 fatty acids undergoes β-oxidation in the mitochondrion, releasing hydrogen atoms that get sent down the electron transport chain, with subsequent ATP production. The amount of ATP produced per mole of triglyceride is enormous, compared to glucose (38 ATP):
TABLE 3-2 Summary of Interrelationship Between Energy Systems
glycerol: 19 ATP,
3 fatty acids: 147 × 3 = 441 ATP,
and
total: 460 ATP
This makes fat a very efficient source of energy.
One final comment on the degradation of carbohydrate and fat for energy: It has been said that carbohydrates serve as a primer for fat catabolism. In order for the metabolic mill to function properly, carbohydrate (glucose) must be broken down in the presence of fat so that fat can be broken down properly. If there is no glucose present, and fat becomes the sole substrate, lipid will be broken down incompletely. This can happen in the presence of a disease, for example, diabetes or during extreme exercise states when glycogen stores have depleted. Lipid degradation under hypoglycemic conditions leads to the formation of ketone bodies that reduce the pH of body fluids and can result in a toxic condition called ketoacidosis. Diabetics and individuals on low/no-carbohydrate diets are particularly prone to this condition.
ENERGY SYSTEMS
So far, this chapter has introduced carbohydrate, fat, and protein as substrates that serve as sources for energy. We have seen how carbohydrate and fat are broken down through glycolysis and the citric acid cycle—the metabolic mill that is present in muscle cells. The energy that is released is packaged in the form of ATP. This high-energy phosphate compound is produced both aerobically and anaerobically. The manner in which it is manufactured depends in large part on the need. These substrates and metabolic pathways will now be brought together so that the patient’s response to exercise can be appreciated within the context of metabolic energy systems.
Immediate Energy System
This energy system becomes activated when the subject moves from a resting state and first begins to exercise, as one changes steady states, and during bursts of vigorous efforts. ATP for these efforts is derived from PC present in muscle fibers. The amount of stored phosphagens is small and is generally not sufficient to power exercise for more than 40 seconds. The kinds of exercise that tend to preferentially utilize the immediate energy system include lifting a heavy package from the floor to the counter and jumping out of the way of a person trying to catch a bus! This energy system can be selectively trained by performing short bouts of maximal efforts. However, improvement is limited and may be related to genetic ability. Successful acquisition of a training effect increases intramuscular stores of ATP and PC,63,64 and facilitates recruitment and improves the firing sequence of those motor units involved in the task.
The Short-Term Energy System
This energy system “turns on” during high-intensity, near-maximal efforts beyond the first few seconds when stored phosphagens have been reduced. Bicycling up a steep hill, or sprinting to catch a bus, preferentially activates this system. It relies on the rapid, anaerobic production of ATP through glycolysis. Glucose is the only fuel substrate that can be utilized to power this kind of exercise.
In normal subjects, shortness of breath during exercise is a symptom that is usually associated with glycolysis and the activation of the short-term energy system. At a critical exercise intensity, usually 60% to 70% of maximum exercise, hydrogen ion begins to accumulate in the blood, as the rate of lactic acid production and passage into the bloodstream exceeds the rate of removal by the liver, kidney, and other tissues. This elevation in hydrogen ion causes a reduction in blood pH. The hypothalamus responds to this relative acid state by increasing the respiratory drive, in an effort to reduce hydrogen concentration by “blowing off” carbon dioxide. This increase in minute ventilation partly compensates for the metabolic acidosis related to lactate accumulation—but only up to a point. As exercise continues, subjects ultimately hyper-ventilate and become short of breath as the production of lactic acid outstrips the ability of the pulmonary system to vent CO2. On a local skeletal muscle level, shortness of breath is often accompanied by a cramping or burning sensation in these muscles, as the production of lactic acid exceeds its clearance from the area by the bloodstream.
During a graded exercise test, the power output or percent of ![]() O2peak at which ventilation departs from linearity is known as the ventilatory threshold. This ventilatory threshold is identified by an increase in the rate and depth of breathing and coincides with the onset of blood lactate accumulation (OBLA)65 (see Fig. 3-7). Muscular fatigue at an intensity of sustained exercise greater than the OBLA is associated with the progressive accumulation of lactate in blood. However, in prolonged exercise at an intensity below OBLA, blood lactate levels reach a steady state as production is matched by clearance. In the latter instance, fatigue is usually associated with a variety of other factors, including depletion of muscular glycogen stores, dehydration, and electrolyte disturbance.
O2peak at which ventilation departs from linearity is known as the ventilatory threshold. This ventilatory threshold is identified by an increase in the rate and depth of breathing and coincides with the onset of blood lactate accumulation (OBLA)65 (see Fig. 3-7). Muscular fatigue at an intensity of sustained exercise greater than the OBLA is associated with the progressive accumulation of lactate in blood. However, in prolonged exercise at an intensity below OBLA, blood lactate levels reach a steady state as production is matched by clearance. In the latter instance, fatigue is usually associated with a variety of other factors, including depletion of muscular glycogen stores, dehydration, and electrolyte disturbance.
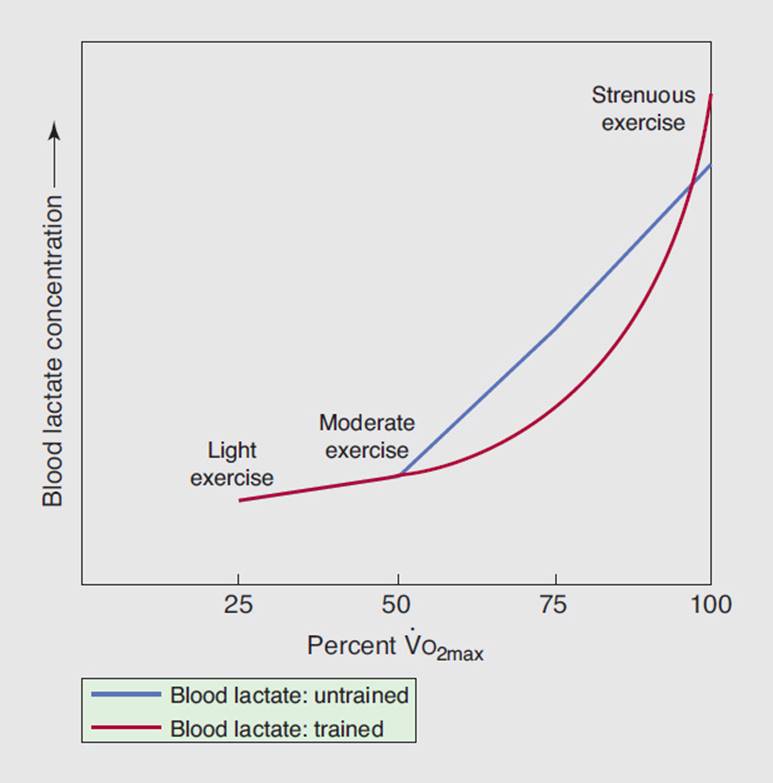
FIGURE 3-7 Onset of blood lactate accumulation (OBLA) for trained versus untrained individuals. The trained subject can perform more exercise before OBLA and can tolerate higher absolute levels.
The OBLA has also been used to document the acquisition of a training effect of the short-term energy system. Training this system causes a shift in OBLA and the ventilatory threshold to higher levels of exercise, such that a glycolytically trained individual can exercise to a higher percentage of maximal ![]() O2 before lactate begins to build up. Training the short-term energy system will permit a greater tolerance to lactic acid, thus postponing the onset of fatigue (see Fig. 3-7).
O2 before lactate begins to build up. Training the short-term energy system will permit a greater tolerance to lactic acid, thus postponing the onset of fatigue (see Fig. 3-7).
The clinical decision to train the short-term energy system should be made on the basis of the age of the patient, the kinds of activities that the patient will engage in, and the presence of comorbidities, like cardiopulmonary disease. Athletes recovering from orthopedic injury who engage in soccer, basketball, or other sports requiring high-intensity efforts may be trained glycolytically. However, HR and blood pressure elevate quickly and to high levels, placing extra work on the heart. This kind of exercise can also provoke a Valsalva maneuver, which impedes blood flow back to the heart and invoke a pressor response that further compromises cardiac function.
CLINICAL CORRELATE
Physical therapists should avoid prolonged activation of the short-term energy system in patients with cardiopulmonary disease because of the increased “pressure” workload on the heart. The appearance of shortness of breath during exercise, or a sudden change in the ventilatory pattern relative to the workload, signals the activation of this energy system.
Physical therapists should also be aware that many patients with chronic obstructive pulmonary disease fail to achieve a level of exercise that produces metabolic acidosis and thus a ventilatory threshold. This is most likely due to low exercise capacity, when the ability to attain the ventilatory threshold is precluded by the onset of shortness of breath.66
The Long-Term Energy System
This energy system predominates during moderate-intensity efforts. Walking or jogging at a comfortable pace preferentially activates this system. It relies on the slower, aerobic production of ATP through the citric acid cycle. Indeed, the hallmark of the activation of the long-term energy system is the utilization of oxygen. As long as the demand for oxygen by active skeletal muscle is matched by an adequate supply, exercise can be continued for a protracted period of time. Activation of the long-term, or aerobic endurance, energy system tends to cause a “volume” workload on the heart, which places less stress on the heart than the higher “pressure” workload that is associated with the high-intensity, short-term energy system.
CLINICAL CORRELATE
The heart rate response to activation of this system is fairly linear and proportionate to the workload. The rate at which systemic oxygen is consumed is predictable and proportionate to the workload as well. This fact allows the clinician to quantify the amount of exercise that a patient receives.
In the way that these three energy states have been presented, it may appear that the immediate, short-term, and long-term energy systems are three discrete entities that “turn on and off” without overlap. This is not the case. Movement across exercise states and utilization of appropriate fuel substrates occur as a smooth integration of systems. All three metabolic pathways are in continuous operation; the intensity and duration of exercise determine which system predominates67 (see Fig. 3-8).
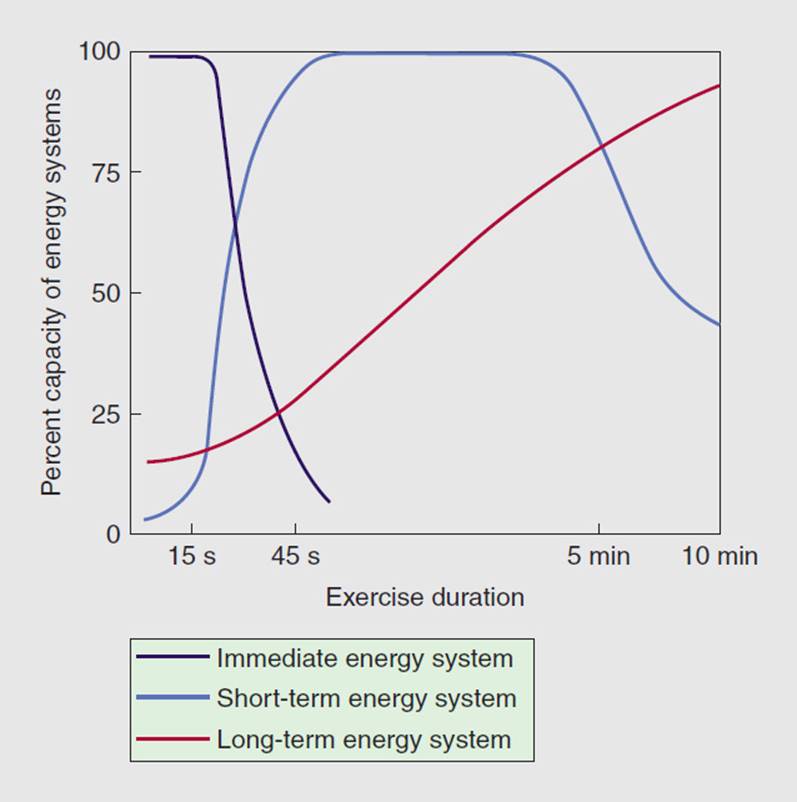
FIGURE 3-8 Utilization of three metabolic energy pathways in moving from the resting state to a moderate, prolonged level of exercise. (Modified with permission from McArdle WD, Katch FI, Katch VL. Exercise Physiology: Energy, Nutrition, and Human Performance. 5th ed. Philadelphia, PA: Lippincott Williams & Wilkins, 2001.)
CARDIOVASCULAR AND PULMONARY RESPONSE TO EXERCISE
Immediate Response to Exercise: Cardiac
Exercise presents an ultimate challenge to the cardiovascular and pulmonary systems. The metabolic need for more oxygen and nutrients in working skeletal muscle during exercise initiates a long and complex series of feedforward and feedback mechanisms that occur through a dynamic interplay among somatosensory, musculoskeletal, cardiovascular and pulmonary systems. It is the amalgamation of these processes that ultimately propels the human body from point A to point B.
If metabolic need initiates the process, then cardiac output drives the process. Arterial blood carries oxygen and nutrients into metabolically active tissue, and venous blood removes metabolites and oxygen-reduced red blood cells from the area. This section will demonstrate by example what happens to these and other variables when a subject moves from rest to exercise.
Heart Rate: Revision of the Age-Related Maximum Heart Rate
During graded exercise, HR rises linearly with increasing workload. The increase in HR occurs as a result of a withdrawal in parasympathetic tone and by augmentation of sympathetic neural input to the sinoatrial node. HR linearity will continue until a maximum HR (HRmax) is achieved, at which point exercise must stop, as cardiac output is no longer able to match metabolic need. HRmax decreases with age and traditionally has been calculated as 220 – age. The notion of an age-related maximum HR (ARMHR) has been universally accepted and widely used for many years. It has served as an endpoint for maximal exercise testing and has also been used as a basis for prescribing intensity of effort in rehabilitation programs. The ARMHR is constant across both gender and state of training. However, the validity of the ARMHR equation has never been established, particularly for older adults.
A recent study has sought to validate the ARMHR among healthy men and women ranging widely in age.68 Tanaka et al. performed a meta-analysis on a total of 351 peer-reviewed research papers that met the following criteria: (1) subjects were both men and women and analyzed separately; (2) subjects were nonmedicated nonsmokers; (3) subjects were adults; and (4) maximum exercise was determined by using objective criteria. Tanaka et al. went on to perform their own research study by exposing 514 healthy men and women to maximum exercise testing. Forward stepwise multiple regression analyses demonstrated that age alone accounted for 80% of the individual variance in HRmax. The regression formula obtained from the research experiment was virtually identical to that of the meta-analysis. There was no significant difference in the regression equation between men and women or between sedentary and endurance-trained individuals. It was concluded that the traditional 220 – age formula overestimates true HRmax in young adults and underestimates true HRmax in persons older than 40 years. The following formula more accurately identifies true HRmax among healthy adults across the life span:
HRmax = 208 − 0.7 × age.
Utilization of the new, revised formula has clinical implications. The revised formula allows older individuals to exercise to a higher HR before termination, resulting in better diagnostic validity as well as a higher level of training exercise intensity. However, it should be stressed that this formula, like 220 – age, provides only an estimate of HRmax. Significant variance exists at any given age. Indeed, 1 SD HRmaxis 10 to 12 beats per minute (bpm). Finally, these results are only applicable to healthy normal adults. Individuals with overt cardiovascular disease may have a very different regression formula.
CLINICAL CORRELATE
It is thus inappropriate to apply the revised regression formula for HRmax to patients with cardiovascular disease for the purpose of writing an exercise prescription. These patients require a maximum symptom-limited exercise test in order to identify their specific HRmax and individuate their exercise prescription.
The Rate–Pressure Product
The rate–pressure product (RPP) is found by multiplying the HR and the SBP. It is usually expressed by a power of 3. Thus, for example,
Heart rate = 105 bpm,
Systolic blood pressure = 150 mm Hg,
RPP = 15.7 × 10³.
There is a strong linear correlation between the RPP and myocardial oxygen consumption (M![]() O2) during progressive, aerobic lower-extremity exercise.69,70 The RPP has particular utility for physical therapists who treat patients with heart disease in that both the HR and SBP response to exercise are often abnormal in these patients. HR and contractility, both major determinants of M
O2) during progressive, aerobic lower-extremity exercise.69,70 The RPP has particular utility for physical therapists who treat patients with heart disease in that both the HR and SBP response to exercise are often abnormal in these patients. HR and contractility, both major determinants of M![]() O2, may be compromised by way of ischemia or necrosis; alterations in afterload as a function of left ventricular mechanical dysfunction can also affect M
O2, may be compromised by way of ischemia or necrosis; alterations in afterload as a function of left ventricular mechanical dysfunction can also affect M![]() O2. Both of these findings are captured in the measurement of the RPP. The benefit of its use in monitoring tolerance to exercise and individuating an aerobic exercise prescription is that the dynamic interplay between both HR and BP is reflected in the equation.
O2. Both of these findings are captured in the measurement of the RPP. The benefit of its use in monitoring tolerance to exercise and individuating an aerobic exercise prescription is that the dynamic interplay between both HR and BP is reflected in the equation.
The cardiac response to exercise is highly individual; that is, the HR and SBP responses to exercise vary widely across individuals, especially in persons with heart disease. However, recent work by Hui and colleagues presents normative values for resting and exercise RPP among healthy normal subjects.71 Data obtained from 1,623 subjects were used to develop a multiple regression model that recognized several factors, including age, gender, and BMI, that contribute to calculation of RPP.
The reader will recall that quantifying the amount of exercise that the physical therapist prescribes to a patient through the use of METs provides a basis for comparisons between subjects. This is not the case with the RPP, which is highly variable across patients with heart disease.
CLINICAL CORRELATE
Use of the RPP to monitor exercise benefits to the patient with heart disease because it reflects cardiac function. While comparison across patients is not possible, it can be used to monitor individual patient progress. Successful acquisition of an aerobic endurance training effect is demonstrated by a reduction of the RPP at any given submaximal workload.
Cardiac Function Curve
A cardiac function curve is a graphical depiction of the heart’s ability to receive blood from the venous system and to pump blood out through the arterial system. Examine the cardiac function curve of a healthy normal 24-year-old individual about to begin ambulation on a treadmill72 (Fig. 3-9). This figure isolates left heart function (curved, moving from left to right) from right heart function (more linear, moving from right to left). Cardiac output represents a balance between blood coming into the heart from the periphery and blood leaving the heart from the left ventricle. The balance occurs where the two solid lines cross (point A), which indicates a cardiac output of 5.0 L/min at rest. Notice that right atrial pressure (Pra) is zero at point A: This healthy heart is pumping out the same volume that is coming in.
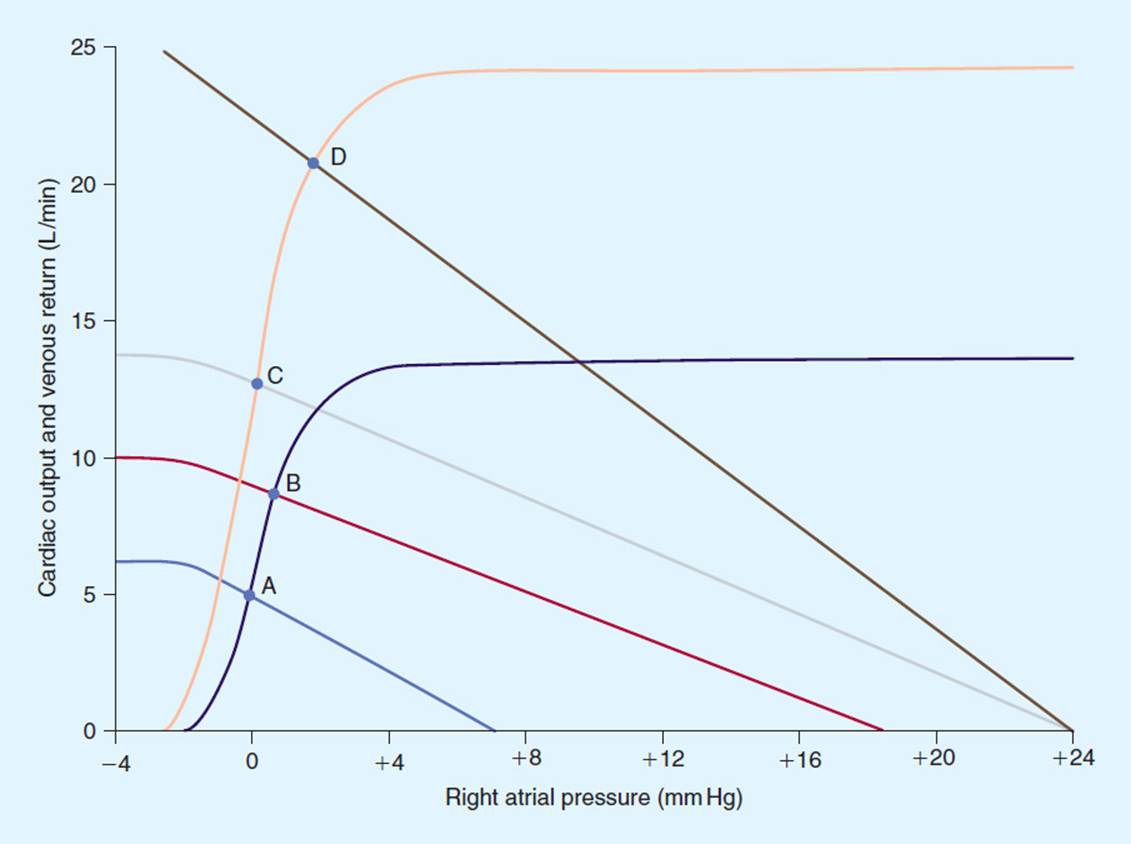
FIGURE 3-9 Cardiac function curve from a healthy untrained 24-year-old subject, representing the change in left heart and right heart function as the subject moves from the resting state to maximum exercise. Note that points A, B, C, and D represent cardiac outputs obtained during that time period. (Modified with permission from Guyton A, Jones C, Coleman T. Circulatory Physiology: Cardiac Output and Its Regulation. 2nd ed. Philadelphia, PA: WB Saunders; 1973.)
One of the first things that happen during the initiation of exercise is activation of the skeletal muscle pump. This causes an increase in venous return, a transient small increase in right atrial pressure, and thus a new right heart function curve (dashed line). Left heart function remains unchanged. There is new equilibration at point B, with a new cardiac output of 8.0 L/min. Within the next 15 to 20 seconds, the neurological system becomes activated. The sympathetic nervous system turns on, producing an increased force of contraction of both the left and the right heart and a new set of function curves that equilibrate at point C (12.5 L/min). A final development in this model is the onset of a reduction in resistance to blood flow, which occurs at the local skeletal muscle level, as a result of metabolites that cause local vasodilatation. Final cardiac output is at 21.0 L/min, a peak exercise level that is typical for a young, healthy normal adult.
Behavioral Characteristics of Cardiac Output
Cardiac output is a function of both HR and stroke volume (see Table 3-3). This model shows HR and stroke volume data from the same individual when moving from rest to maximum exercise. Notice that the fourfold increase in cardiac output is mostly provided by an almost threefold increase in HR. Indeed, a fairly linear relationship exists between increases in HR and cardiac output for submaximal lower extremity exercise in the upright position. Stroke volume is an important, but relatively minor contributor. Stroke volume increases linearly with cardiac output in the early stages of progressive exercise. However, at approximately 40% of maximum work, stroke volume will increase at a much slower rate. Beyond 40% maximum work, the majority of further increases in exercise levels are a function of an increase in HR.
TABLE 3-3 Cardiac Response of a Healthy Untrained 24-Year-Old Individual When Moving from Rest to Maximum Exercise
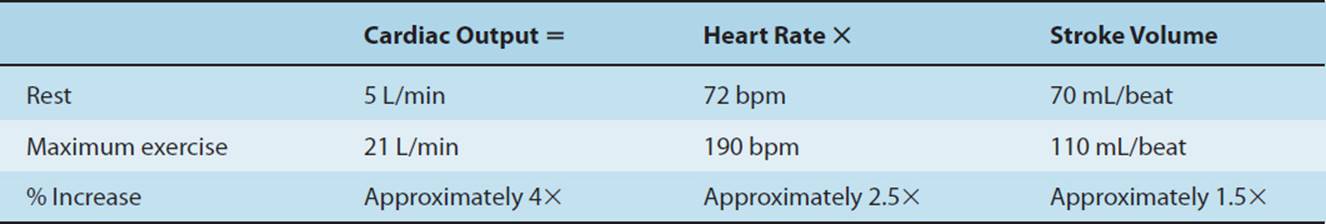
Oxygen consumption—Maintenance of the resting state requires 3.5 mL O2/kg/min. In our 70-kg healthy 24-year-old subject, this corresponds to approximately 250 mL O2/min in 5.0 L of blood. Measurement of ![]() O2 at peak exercise yielded a value of 3,000 mL O2/min—a 12-fold increase in
O2 at peak exercise yielded a value of 3,000 mL O2/min—a 12-fold increase in ![]() O2, a typical increase in a young untrained individual.
O2, a typical increase in a young untrained individual.
Fick equation—At this point, the reader may be wondering how a 12-fold increase in ![]() O2 can be matched by only a 4-fold increase in cardiac output. The answer lies in the ability of working skeletal muscle to increase its extraction of oxygen, as represented by the Fick equation:
O2 can be matched by only a 4-fold increase in cardiac output. The answer lies in the ability of working skeletal muscle to increase its extraction of oxygen, as represented by the Fick equation:
![]() O2 = cardiac output × a-
O2 = cardiac output × a-![]() O2 difference.
O2 difference.
At rest, muscle extracts approximately 25% of the available oxygen in arterial blood. The rate of oxygen removal is dependent on muscle capillarity, myoglobin content, mitochondrial number and size, and the oxidative capacity of mitochondrial units. At maximal levels of exercise, oxygen extraction can triple from a resting value of 250 mL O2/min to 750 mL O2/min. This phenomenon maintains tissue viability during exercise and keeps cardiac output, especially HR, from bearing the full responsibility of oxygenating tissues. Imagine the impossibility of developing HRs in excess of 600 bpm if there was a one-to-one match of cardiac output to ![]() O2!
O2!
Immediate Response to Exercise: Pulmonary
Initiation of the exercise state provokes an increase in ![]() E as a function of both tidal volume and frequency (see Table 3-4). The profound increase in tidal volume is an energy-efficient way of increasing
E as a function of both tidal volume and frequency (see Table 3-4). The profound increase in tidal volume is an energy-efficient way of increasing ![]() E while keeping breathing frequency relatively low. Tidal volume increases until approximately 50% to 60% of vital capacity. Beyond this point, further increases in ventilation are primarily the result of increases in breathing frequency. Chest wall movement during exercise involves not only increased use of the diaphragm but also recruitment of the accessory muscles of ventilation.
E while keeping breathing frequency relatively low. Tidal volume increases until approximately 50% to 60% of vital capacity. Beyond this point, further increases in ventilation are primarily the result of increases in breathing frequency. Chest wall movement during exercise involves not only increased use of the diaphragm but also recruitment of the accessory muscles of ventilation.
TABLE 3-4 Pulmonary Response of a Healthy Untrained 24-Year-Old Individual When Moving from Rest to Maximum Exercise
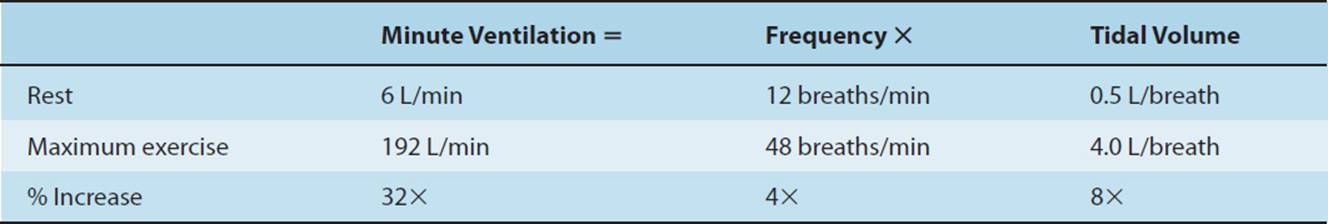
Other Factors
Exercise provokes a massive shunting of blood away from metabolically less active tissues and toward active skeletal muscle. This is brought about by sympathetically mediated mass vasoconstriction in the renal and splanchnic circulations, skin, and inactive skeletal muscle. Vasodilatation results in an increase in blood flow to working muscle and vital organs. Indeed, blood flow to the brain and heart increases up to 25% from resting levels at maximum exercise. At rest, skeletal muscle receives only approximately 20% of total cardiac output; at maximal exercise, skeletal muscle may receive up to 80% of total cardiac output. Blood flow to kidneys may be reduced by more than 30%.
Global sympathetic stimulation, catecholamine release by the adrenal glands, and resultant shunting of blood cause an exercise-induced rise in SBP. This elevation tends to rise linearly to progressive increases in workload. Diastolic blood pressure tends to remain fairly static as exercise increases.
Gas Exchange
The process of gas exchange depends on the difference in the partial pressure of oxygen (PO2) between lung alveoli (PAO2) and pulmonary capillary blood (PaO2) as well as the matching of alveolar ventilation and perfusion. During exercise, the PAO2 rises due to an increase in alveolar ventilation. The partial pressure of oxygen of mixed venous blood is also reduced as a result of greater oxygen uptake by skeletal muscle, resulting in a greater partial pressure gradient for oxygen across the alveolar–capillary membrane. As a consequence of the overall alveolar ventilation and opening of pulmonary capillaries, matching of pulmonary ventilation to perfusion is also optimized during exercise. The saturation of hemoglobin (SaO2) in arterial blood remains greater than 95% up to maximal exercise in healthy subjects. The oxygen content of arterial blood depends not only on the PO2 gradient between the lung and the pulmonary capillaries but also on the oxygen-carrying capacity of blood. If hemoglobin levels are reduced (eg, anemia), the oxygen content of arterial blood will be lowered and ![]() O2peak may be reduced.
O2peak may be reduced.
The Athletic Heart
The heart is composed of specialized contractile tissue, myocardium, that can respond to repetitively applied workloads in ways similar to that of skeletal muscle. The athletic heart exemplifies these adaptations to the highest degree. Like skeletal muscle, myocardium can undergo an increase in cell size, or hypertrophy. This hypertrophy is usually confined to the left ventricle, which enlarges in response to high afterload imposed by exercise. The kind of exercise that prompts left ventricular hypertrophy (LVH) has come under recent scrutiny.73–75 A recent review of the literature73 related to left ventricular hypertrophy in the setting of resistance training has demonstrated only modest increases in left ventricular size, compared to the greater increases in size with endurance training.76 It should be noted that resistance and endurance training produces increases that are substantially less than those found in patients with high blood pressure, cardiomyopathy, or valvular heart disease.
Athletes may also possess an adventitious, or extra, heart sound. The S3 heart sound closely follows the normal S2 heart sound, which represents closure of the aortic and pulmonic valves (see Chapter 10). Although S3 is strongly associated with the presence of congestive heart failure in patients with heart disease, its presence in the athlete probably reflects a larger left ventricular chamber size, coupled with increased left ventricular muscle mass, and is, therefore, considered normal in this population.
Athletes may also be prone to alterations in HR and rhythm. Slow resting HRs (eg, sinus bradycardia) are quite common, particularly among endurance-trained athletes. This is often accompanied by a slowing of conduction through a secondary pacemaker of the heart, the atrioventricular (AV) node (ie, first-degree AV block) (see Chapter 11). Both of these findings are considered normal, as they reflect greater cardiovascular efficiency and a general shift toward vagal parasympathetic tone.
It is a tragic, though thankfully a rare event, when a young athlete dies suddenly during an athletic endeavor. These events are almost always cardiogenic and more specifically, arrhythmogenic. Lethal ventricular arrhythmias occur in the setting of preexisting structural abnormalities that are either genetically determined or acquired. The most common genetic abnormality contributing to sudden death is underlying cardiomyopathy; coronary artery disease and myocarditis are the most common of the acquired diseases. Ventricular arrhythmias that have no structural condition are not thought to be dangerous. Structural arrhythmias are life-threatening.77 Identification of young athletic individuals judged to be at risk for sudden death is difficult. However, current best practice calls for a complete evaluation of those athletes with structural cardiac abnormalities and history of loss of consciousness (syncope).78,79
CLINICAL CORRELATE
Left ventricular hypertrophy and extra heart sounds due to athletic endeavors are considered normal; these findings should not be confused with the LVH and extra heart sounds associated with chronic high blood pressure. Slow heart rates among athletes are also considered normal variants. Physical therapists should evaluate all the data and look at the total patient before making clinical decisions regarding the presence of cardiac impairment. Physical therapists should also be alert to a patient history of childhood cardiac disease and episodes of syncope and make appropriate referrals.
EXERCISE TESTING
Direct Measurement of Peak Oxygen Consumption
Most of our activities of daily living are carried out using substrates that are degraded in the presence of oxygen. Patients with cardiopulmonary disease and patients with other diseases who are deconditioned usually benefit from physical therapy interventions directed toward training the long-term (aerobic endurance) energy system. This section will describe direct and indirect measurement of ![]() O2 during exercise as a means of both directing treatment and measuring outcome.
O2 during exercise as a means of both directing treatment and measuring outcome.
Traditional Modes of Exercise Testing
The measurement of ![]() O2 is usually obtained during the application of a standardized bout of exercise, termed an exercise test or stress test. These exercise tests are typically graded from a low level to a moderate or high level. They consist of stages, each of which may last from 2 to 3 minutes. The duration of the stages and the level of exercise that each stage represents form an exercise test protocol. There are numerous exercise test protocols in existence, utilizing a variety of modalities, or ergometers. See Chapter 10 for examples of exercise test protocols and modalities.
O2 is usually obtained during the application of a standardized bout of exercise, termed an exercise test or stress test. These exercise tests are typically graded from a low level to a moderate or high level. They consist of stages, each of which may last from 2 to 3 minutes. The duration of the stages and the level of exercise that each stage represents form an exercise test protocol. There are numerous exercise test protocols in existence, utilizing a variety of modalities, or ergometers. See Chapter 10 for examples of exercise test protocols and modalities.
CLINICAL CORRELATE
The measurement of ![]() O2 during a standardized exercise test allows for the comparison of results across subjects and within the same subject as a pre- and postintervention comparison.
O2 during a standardized exercise test allows for the comparison of results across subjects and within the same subject as a pre- and postintervention comparison.
Direct measures of ![]() O2peak are obtained through open-circuit spirometry. With the nose occluded, or while the subject wears a mask, the subject breathes through a low-resistance valve, while pulmonary ventilation and fractions of O2 and CO2 are measured in expired air samples.
O2peak are obtained through open-circuit spirometry. With the nose occluded, or while the subject wears a mask, the subject breathes through a low-resistance valve, while pulmonary ventilation and fractions of O2 and CO2 are measured in expired air samples. ![]() O2 can be expressed in either absolute (L O2/min) or weight-relative units (mL O2/kg/min or METs). Absolute maximal aerobic power reflects the ability to perform external work. The greater the amount of the oxygen consumed at peak exercise, the more fit is the individual. When evaluating cardiorespira-tory endurance,
O2 can be expressed in either absolute (L O2/min) or weight-relative units (mL O2/kg/min or METs). Absolute maximal aerobic power reflects the ability to perform external work. The greater the amount of the oxygen consumed at peak exercise, the more fit is the individual. When evaluating cardiorespira-tory endurance, ![]() O2 values are typically expressed relative to kilogram of body weight, as METs. Relative peak aerobic power is a better reflection of the ability to move one’s body mass and is related inversely to body fatness. Classification of cardiorespiratory fitness is provided in Table 3-5.
O2 values are typically expressed relative to kilogram of body weight, as METs. Relative peak aerobic power is a better reflection of the ability to move one’s body mass and is related inversely to body fatness. Classification of cardiorespiratory fitness is provided in Table 3-5.
TABLE 3-5 Cardiorespiratory Fitness
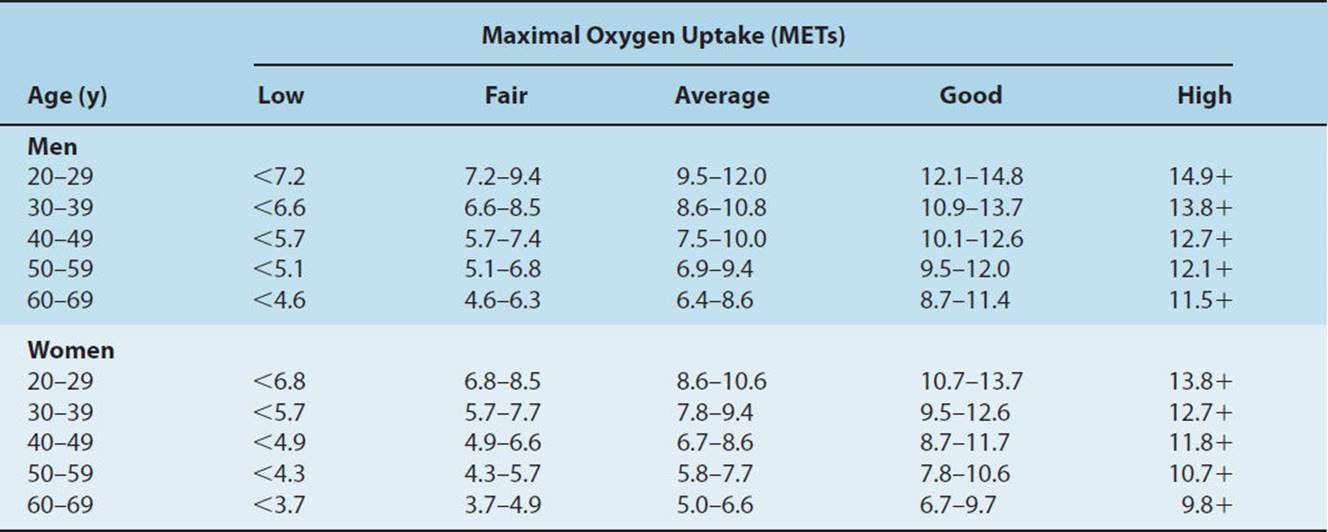
Even in healthy individuals, many physiological variables influence and alter ![]() O2peak. Higher levels of
O2peak. Higher levels of ![]() O2peak can be achieved when a larger percentage of muscle mass is involved in testing. For example, lower extremity protocols elicit a higher
O2peak can be achieved when a larger percentage of muscle mass is involved in testing. For example, lower extremity protocols elicit a higher ![]() O2peak than exercise tests that rely solely on upper extremity muscle mass. These values can be slightly increased when upper extremity mass is added to lower extremity mass. Mean values for women are approximately 10% to 20% lower than those for men of comparable age and physical fitness due to the average reduction in muscle mass, higher percentage of body fat, lower hemoglobin concentration, and smaller lungs. Cross-sectional studies have shown that after the age of 25 years,
O2peak than exercise tests that rely solely on upper extremity muscle mass. These values can be slightly increased when upper extremity mass is added to lower extremity mass. Mean values for women are approximately 10% to 20% lower than those for men of comparable age and physical fitness due to the average reduction in muscle mass, higher percentage of body fat, lower hemoglobin concentration, and smaller lungs. Cross-sectional studies have shown that after the age of 25 years, ![]() O2peak declines approximately 9% per decade in sedentary individuals. It is unclear how much of this decline is due to the aging process or to reduced physical activity.
O2peak declines approximately 9% per decade in sedentary individuals. It is unclear how much of this decline is due to the aging process or to reduced physical activity. ![]() O2peak is also reduced by environmental challenges such as heat stress, air pollution, or exposure to altitude.28
O2peak is also reduced by environmental challenges such as heat stress, air pollution, or exposure to altitude.28
![]() O2 can be measured with automated measurement systems, or metabolic carts, which provide breath-by-breath and time-averaged data, with on-screen graphics and digital display of
O2 can be measured with automated measurement systems, or metabolic carts, which provide breath-by-breath and time-averaged data, with on-screen graphics and digital display of ![]() O2, volume of carbon dioxide produced (
O2, volume of carbon dioxide produced (![]() CO2), and minute ventilation. Reports may be readily generated and data may be stored for clinical and research applications. Accurate results depend on frequent calibration of the pneumotachometer and the gas analyzers using “span gases” of known concentration (see Fig. 3-10).
CO2), and minute ventilation. Reports may be readily generated and data may be stored for clinical and research applications. Accurate results depend on frequent calibration of the pneumotachometer and the gas analyzers using “span gases” of known concentration (see Fig. 3-10).
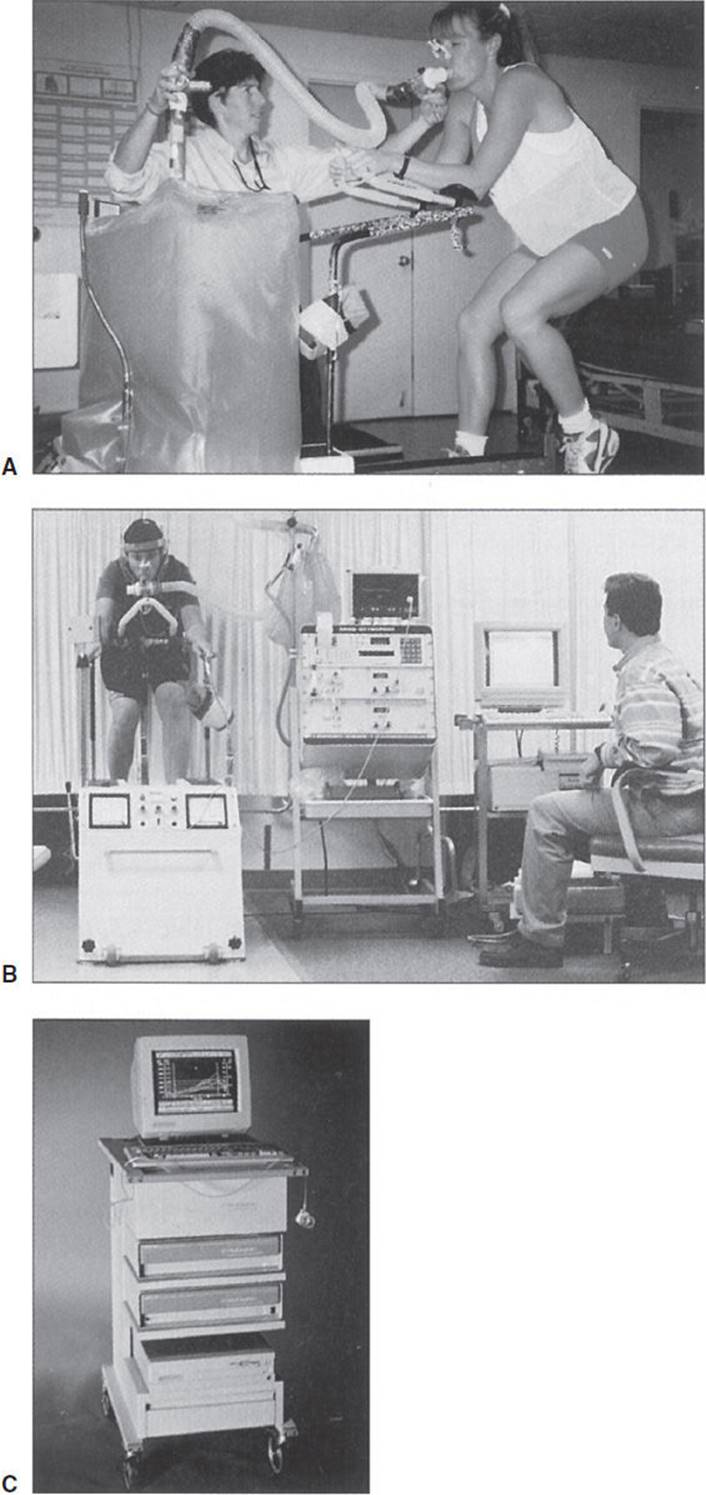
FIGURE 3-10 Common methods used to collect and sample expired gases during indirect gas analysis calorimetry. (A) Douglas bags, gas analyzers, and gas flow meters. (B) A simple, portable, time-averaged system for indirect calorimetry. (C) A breath-by-breath system. (Used with permission from Robergs R, Roberts S. Exercise Physiology: Exercise Performance and Clinical Applications. The McGraw-Hill Companies; 1997.)
The ability to continue to consume oxygen at high levels of exercise is the hallmark of aerobic fitness. Knowing that glucose is the only substrate utilized during near-maximal anaerobic effort allows the examiner to assess the subject’s level of physical fitness by identifying the anaerobic threshold. This can be accomplished by measuring the ratio of carbon dioxide blown off to oxygen consumed. The respiratory exchange ratio (RER) is expressed as ![]() CO2/
CO2/![]() O2 and is a ventilatory measurement obtained from the metabolic cart that reflects gas exchange between the lungs and pulmonary blood. During heavy, non–steady-state exercise, RER may exceed 1.0. This is due to the increased
O2 and is a ventilatory measurement obtained from the metabolic cart that reflects gas exchange between the lungs and pulmonary blood. During heavy, non–steady-state exercise, RER may exceed 1.0. This is due to the increased ![]() CO2 released through pulmonary hyperventilation and nonmetabolic sources of CO2 provided from lactic acid buffering in the blood.
CO2 released through pulmonary hyperventilation and nonmetabolic sources of CO2 provided from lactic acid buffering in the blood.
Table 3-6 illustrates the RER and energy equivalents for various mixes of carbohydrate and fat. This table shows that RERs that fall around 0.70 indicate that fat is the predominant fuel substrate. Similarly, RERs that approach 1.0 indicate that carbohydrate is being preferentially utilized. An RER of 0.90 indicates that the subject is utilizing approximately two-third carbohydrate and one-third fat.
TABLE 3-6 Relationship Among RER, Substrate Utilized, and Energy
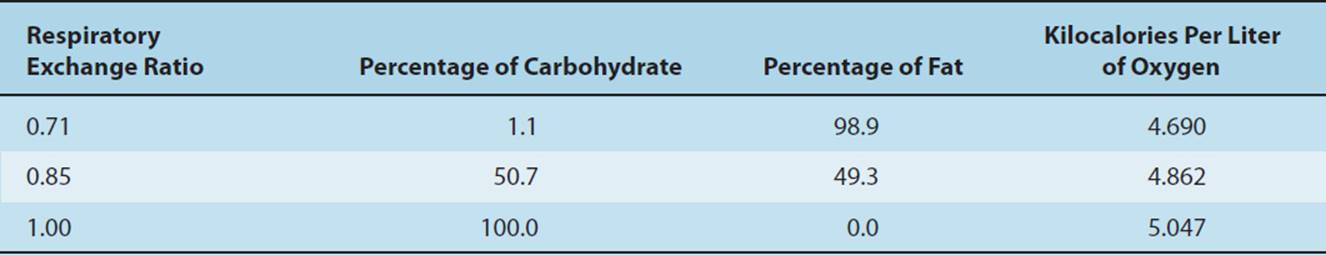
The utility of measuring RER using a metabolic cart becomes apparent during performance of a graded exercise test. The subject starts out at a low level of exercise: Measured RERs typically fall around 0.70, indicating utilization of free fatty acids that become catabolized in the presence of oxygen. As exercise intensity increases, the measured RER will approach 1.0, indicating more reliance on glucose as a fuel substrate, as the demand for oxygen outstrips supply and as the subject becomes more dependent on anaerobic glycolysis to continue. At peak exercise, the RER is around 1.0, indicating near-total reliance on glucose and extreme fatigue. This is because glucose is the only fuel substrate that can be used during high levels of exercise intensity. In summary, it may be said that measurement of the RER by way of the metabolic cart allows the clinician to determine the relative mix of carbohydrate and fat at progressive levels of exercise and is an indication of which energy system is predominant. In this way, it measures the subject’s level of physical fitness. Measurement of an RER value in excess of 1.0 indicates a maximal effort, whereas an RER value of less than 1.0 suggests a submaximal effort.
The energy expenditure (kcal) associated with a given level of ![]() O2 varies slightly with the fuel substrate being utilized and with the RER. In clinical practice and in the absence of a metabolic cart, the precise dietary mix of carbohydrate and fat is unknown. However, if a mixed diet of carbohydrate and fat is assumed, it may be said that for every liter of oxygen consumed, 5.0 kcal of energy is liberated.
O2 varies slightly with the fuel substrate being utilized and with the RER. In clinical practice and in the absence of a metabolic cart, the precise dietary mix of carbohydrate and fat is unknown. However, if a mixed diet of carbohydrate and fat is assumed, it may be said that for every liter of oxygen consumed, 5.0 kcal of energy is liberated.
The following example illustrates the utility of this conversion.
A 70-kg subject consumes that 4.0-oz slice of cheesecake referred to at the beginning of the chapter. Use of a bomb calorimeter has determined that the energy value of the cheesecake is 350 kcal. Recall that
1 MET = 3.5 mL O2/kg/min
and
NET = gross − resting energy expenditure.
How long must the subject exercise on a treadmill at a physiological workload of 5 METs in order to expend 350 kcal of energy? The answer can be calculated as follows:
NET = gross – resting energy expenditure,
4 METs = 5 METs – MET,
4 METs × 3.5 mL O2/kg/min = 14.0 mL O2/kg/min,
14.0 mL O2/kg/min × 70 kg = 980 mL/min = 0.980 L/min,
0.980 L/min × 5 kcal/L = 4.900 kcal/min,
X min × 4.900 kcal/min = 350 kcal,
and
350 kcal/4.900 kcal/min = 71.4 min.
CLINICAL CORRELATE
The ability to convert oxygen consumption to kilocalories has great utility for physical therapists involved in wellness and weight-reduction programs. If a subject exercised at this level on most days of the week and reduced his caloric intake by approximately 250 kcal/day, the net result would be a reduction of body weight by 1 lb/wk (1 lb = 3500 kcal).
Indirect Measurement of Peak Oxygen Consumption
Direct measurement of ![]() O2peak is complex and expensive. It is possible only if the physical therapist has access to a metabolic cart and a properly constructed laboratory. Maximal exercise testing may also pose a risk to the patient. For these reasons, it may be more feasible to subject the patient to submaximal effort and then use this information to predict maximum workload and
O2peak is complex and expensive. It is possible only if the physical therapist has access to a metabolic cart and a properly constructed laboratory. Maximal exercise testing may also pose a risk to the patient. For these reasons, it may be more feasible to subject the patient to submaximal effort and then use this information to predict maximum workload and ![]() O2peak. This is possible through the use of standardized submaximal exercise testing and the use of regression equations that extrapolate the data to maximal levels. It should be noted that the numerous methods of estimating
O2peak. This is possible through the use of standardized submaximal exercise testing and the use of regression equations that extrapolate the data to maximal levels. It should be noted that the numerous methods of estimating ![]() O2peakare specific to a particular protocol and ergometer. One such equation80 is based on the length of time spent on the Bruce protocol for treadmill exercise test:
O2peakare specific to a particular protocol and ergometer. One such equation80 is based on the length of time spent on the Bruce protocol for treadmill exercise test:
![]() O2peak (mL O2/kg/min) = 14.8−1.379 (time in minutes) + 0.451 (time)2 − 0.0.12 (time)3
O2peak (mL O2/kg/min) = 14.8−1.379 (time in minutes) + 0.451 (time)2 − 0.0.12 (time)3
It should be pointed out that use of this formula to predict ![]() O2peak carries with it a standard error of estimate (SEE) of 3.35 mL O2/kg/min, or almost 1.0 MET. A similar formula81 can be used to predict
O2peak carries with it a standard error of estimate (SEE) of 3.35 mL O2/kg/min, or almost 1.0 MET. A similar formula81 can be used to predict ![]() O2peak during the Bruce protocol while using the treadmill handrail for support, which may be appropriate for many patients with disability:
O2peak during the Bruce protocol while using the treadmill handrail for support, which may be appropriate for many patients with disability:
![]() O2peak(mL O2/kg/min) = 2.282(time in minutes) + 8.545 SEE = 4.92 mL O2/kg/min
O2peak(mL O2/kg/min) = 2.282(time in minutes) + 8.545 SEE = 4.92 mL O2/kg/min
Extrapolation to peak ![]() O2 is appropriate for individuals who are free of known cardiovascular disease, but who may be at risk for its development.
O2 is appropriate for individuals who are free of known cardiovascular disease, but who may be at risk for its development.
Submaximal Tests for Measuring Cardiorespiratory Fitness
Direct measurement of ![]() O2peak through the use of a metabolic cart remains the gold standard for assessment of cardiorespira-tory fitness. However, direct measurement is not always possible. As such, a variety of validated exercise tests can be used to estimate
O2peak through the use of a metabolic cart remains the gold standard for assessment of cardiorespira-tory fitness. However, direct measurement is not always possible. As such, a variety of validated exercise tests can be used to estimate ![]() O2peak. These tests utilize conventional modes of exercise to obtain a submaximal HR response. An appropriate testing mode can be chosen based upon the general health status of the participant, accessibility of equipment, and consistency with the intended exercise training regime. Commonly used exercise tests include field tests, cycle ergometer tests, and step testing.
O2peak. These tests utilize conventional modes of exercise to obtain a submaximal HR response. An appropriate testing mode can be chosen based upon the general health status of the participant, accessibility of equipment, and consistency with the intended exercise training regime. Commonly used exercise tests include field tests, cycle ergometer tests, and step testing.
Field Tests
It should be noted that the results of these timed walking/running tests may be influenced by the subject’s level of motivation and pacing ability. Because maximal effort is encouraged, greater risk may exist. Therefore, these tests may not be the test of choice for sedentary individuals at increased risk for cardiovascular or musculoskeletal complications.
The Rockport 1-Mile Fitness Walking Test—As a means of estimating cardiorespiratory fitness, the Rockport 1-Mile Fitness Walking Test has gained wide popularity. During this test, the patient/client walks 1 mile as fast as possible, preferably on a track or a level surface. HR is measured in the final minute during the final 1/4 mile. An alternative is to measure a 10-second HR immediately on completion of the 1-mile walk, but this may overestimate ![]() O2peak when compared to measurement of HR during the walk. An individual’s
O2peak when compared to measurement of HR during the walk. An individual’s ![]() O2peak is predicted from the regression equation:
O2peak is predicted from the regression equation:
![]() O2peak (mL O2/kg/min) = 132.853 − 0.1692 (body mass in kg) − 0.3877 (age in years) + 6.315 (gender) − 3.2649 (time in minutes) − 0.1565 (HR).
O2peak (mL O2/kg/min) = 132.853 − 0.1692 (body mass in kg) − 0.3877 (age in years) + 6.315 (gender) − 3.2649 (time in minutes) − 0.1565 (HR).
In this equation, gender = 0 for female, 1 male, and heart rate (HR) is taken at the end of the walk.
The 1.5-mile test—In this test, the patient/client is asked to run a 1.5-mile distance in the shortest amount of time. ![]() O2peak is estimated from the equation:
O2peak is estimated from the equation:
VO2peak (mL O2/kg/min) = 3.5 + 483/time in minutes.
The Cooper 12-Minute Test—This test requires the patient/client to walk or run for 12 minutes on a running track, with the objective of covering the greatest distance in the allotted period of time. The distance covered is measured to the nearest 100-m interval. This test can also be performed by walking/running on a treadmill set at a 1% grade to best mimic outdoor terrain. An estimation of ![]() O2peak can be calculated by the following equation, if the participant is walking:
O2peak can be calculated by the following equation, if the participant is walking:
![]() O2peak (mL O2/kg/min) = 0.1 (speed) + 1.8 (speed) (grade) + 3.5 mL/kg/min,
O2peak (mL O2/kg/min) = 0.1 (speed) + 1.8 (speed) (grade) + 3.5 mL/kg/min,
whereas speed is expressed in m/min and grade is expressed as a fraction. If the participant is running, the following equation can be used to estimate ![]() O2peak:
O2peak:
![]() O2peak (mL O2/kg/min) = 0.2 (speed) + 0.9 (speed) (grade) + 3.5 mL/kg/min
O2peak (mL O2/kg/min) = 0.2 (speed) + 0.9 (speed) (grade) + 3.5 mL/kg/min
Cooper reported a correlation of 0.897 between ![]() O2max and the distance covered in a 12-minute walk/run, indicating a highly significant relationship.82 Cooper established the following normative data charts to estimate maximal
O2max and the distance covered in a 12-minute walk/run, indicating a highly significant relationship.82 Cooper established the following normative data charts to estimate maximal ![]() O2 and assess the patient/client’s fitness level from the distance value obtained.82
O2 and assess the patient/client’s fitness level from the distance value obtained.82
It should be mentioned that numerous variations have been derived from the normative data charts, providing fitness levels adjusted for gender and alternate modes of exercise (ie, swimming). These charts and formulas are easily accessible on the Web from numerous sources. Caution should be exercised when the source of data is not provided with these resources.
Cycle Ergometer Tests
The Astrand–Rhyming Cycle Ergometer Test—This is a steady-state test in which the patient/client is asked to cycle at a rate of 50 rpm for 6 minutes. The suggested work rate is adjusted for gender and fitness level as follows83:
Men, unconditioned: 300 or 600 kg/m/min (50 or 100 W)
Men, conditioned: 600 or 900 kg/m/min (100 or 150 W)
Women, unconditioned: 300 or 450 kg/m/min (50 or 75 W)
Women, conditioned: 450 or 600 kg/m/min (75 or 100 W)
The goal is to obtain an HR value between 125 and 170 bpm. HR measurements taken at 5 and 6 minutes of work are averaged, and then compared to the Astrand–Rhyming nomo-gram for estimation of ![]() O2peak (see Fig. 3-11). This value must then be adjusted for age by multiplying the
O2peak (see Fig. 3-11). This value must then be adjusted for age by multiplying the ![]() O2peak value by the appropriate correction factor (see Fig. 3-11).
O2peak value by the appropriate correction factor (see Fig. 3-11).
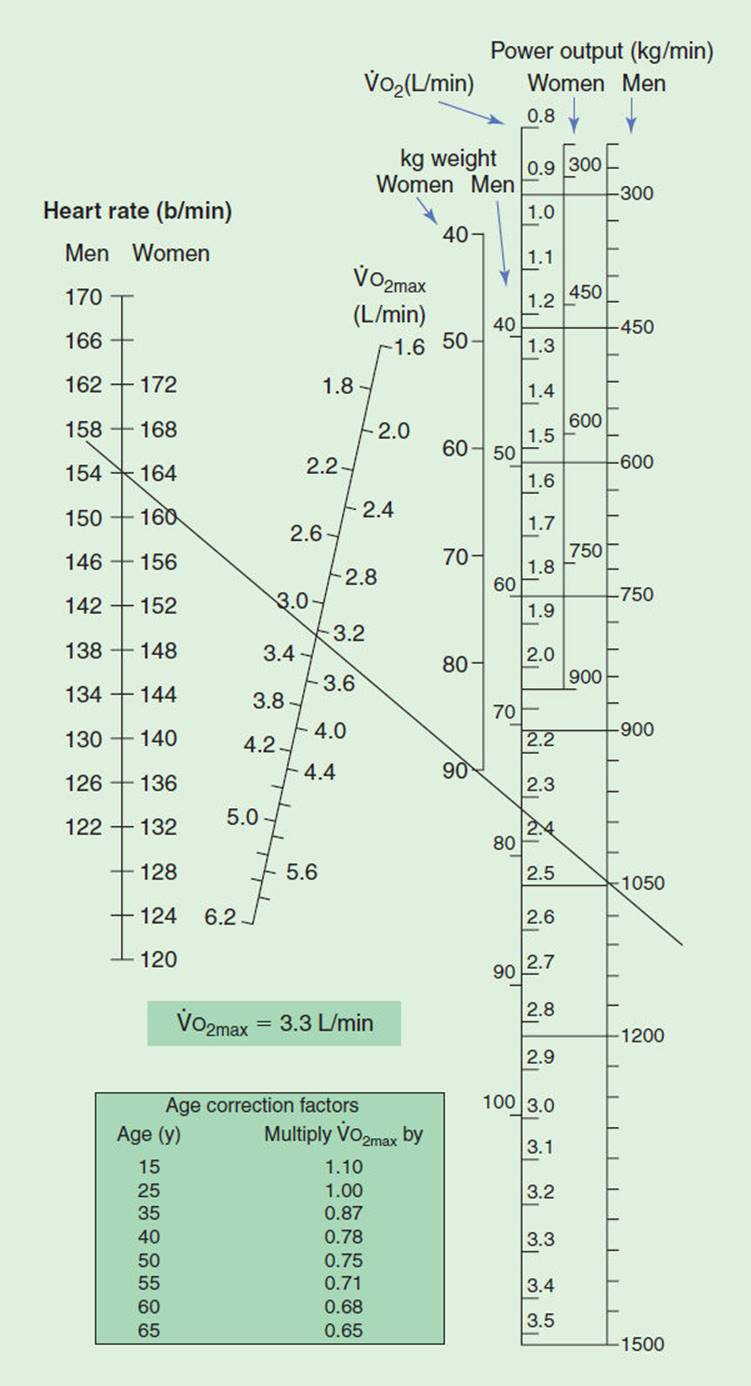
FIGURE 3-11 The Astrand–Rhyming nomogram for estimating during steady-state cycle ergometer exercise. This estimation is derived from a single submaximal effort. (Reproduced with permission from Robergs R, Roberts S. Exercise Physiology: Exercise, Performance, and Clinical Applications. The McGraw-Hill Companies; 1997.)
The YMCA Cycle Ergometer Test—This submaximal test has become one of the most popular assessment tools to estimate ![]() O2peak. The YMCA Cycle Ergometer Test measures the patient/client’s HR at a series of work rates and adjusts the response to the subject’s age-predicted maximal HR. The YMCA protocol requires the patient/client to cycle continuously for two to four 3-minute bouts, with the objective of raising the subject’s steady-state HR between 110 bpm and 85% of the age-predicted maximal HR (see Fig. 3-12). HRs are taken during the last 15 to 30 seconds of the second and third minutes of each stage and must fall into the desired range for two consecutive bouts to be considered a valid predictor of
O2peak. The YMCA Cycle Ergometer Test measures the patient/client’s HR at a series of work rates and adjusts the response to the subject’s age-predicted maximal HR. The YMCA protocol requires the patient/client to cycle continuously for two to four 3-minute bouts, with the objective of raising the subject’s steady-state HR between 110 bpm and 85% of the age-predicted maximal HR (see Fig. 3-12). HRs are taken during the last 15 to 30 seconds of the second and third minutes of each stage and must fall into the desired range for two consecutive bouts to be considered a valid predictor of ![]() O2peak.
O2peak.
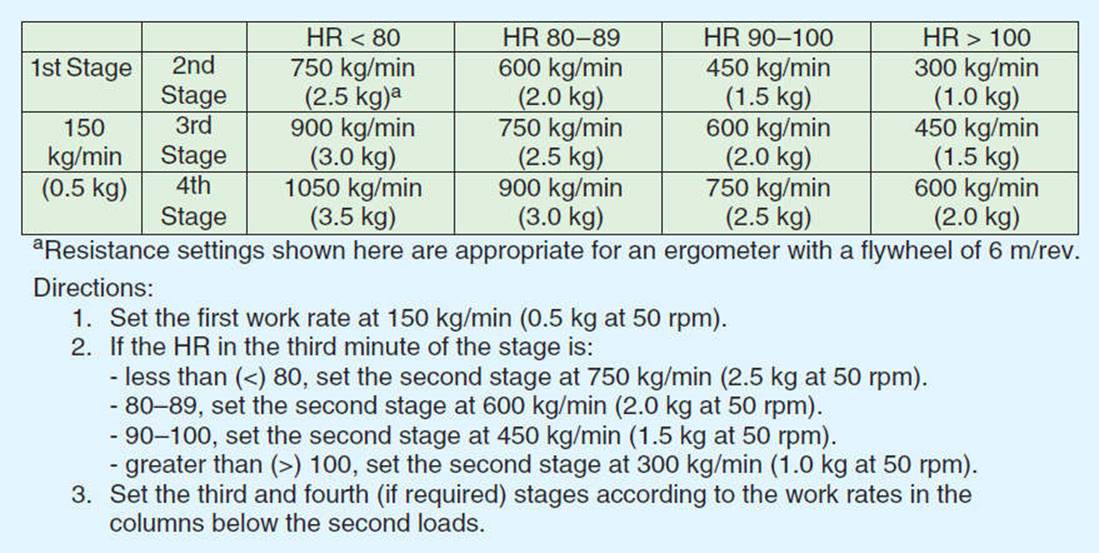
FIGURE 3-12 YMCA cycle ergometry protocol. (Adapted from American College of Sports Medicine. ACSM’s Guidelines for Exercise Testing and Prescription. 7th ed. Lippincott Williams & Wilkins; 2006.)
Step Tests
Step tests have been developed to estimate the subject’s cardiovascular fitness based upon estimates of ![]() O2peak from direct HR response, as well as HR recovery following standardized sub-maximal exercise testing. Astrand and Rhyming84 designed a step test, using a step height of 33 cm for women and 40 cm for men. The patient/client is asked to step at a rate of 22.5 steps/min, requiring oxygen uptakes of 25.8 and 29.5, respectively, for men and women. HR measurements taken at 5 and 6 minutes of work are averaged and then compared to the Astrand–Rhyming nomogram for estimation of
O2peak from direct HR response, as well as HR recovery following standardized sub-maximal exercise testing. Astrand and Rhyming84 designed a step test, using a step height of 33 cm for women and 40 cm for men. The patient/client is asked to step at a rate of 22.5 steps/min, requiring oxygen uptakes of 25.8 and 29.5, respectively, for men and women. HR measurements taken at 5 and 6 minutes of work are averaged and then compared to the Astrand–Rhyming nomogram for estimation of ![]() O2peak (see Fig. 3-11).
O2peak (see Fig. 3-11).
The 3-Minute YMCA Step Test—This is a popular test designed to estimate the subject’s cardiovascular fitness based upon the patient/client’s HR recovery following a 3-minute bout of continuous exercise. The patient/client is asked to step at a rate of 24 steps/min, using a 30.5-cm step. Within 5 seconds from the completion of exercise, the patient is asked to sit and their HR is recorded for 1 minute.85 This HR is used to obtain a qualitative rating of fitness from published normative tables (see Tables 3-7 and 3-8).
TABLE 3-7 3-Minute Step Test (Men)
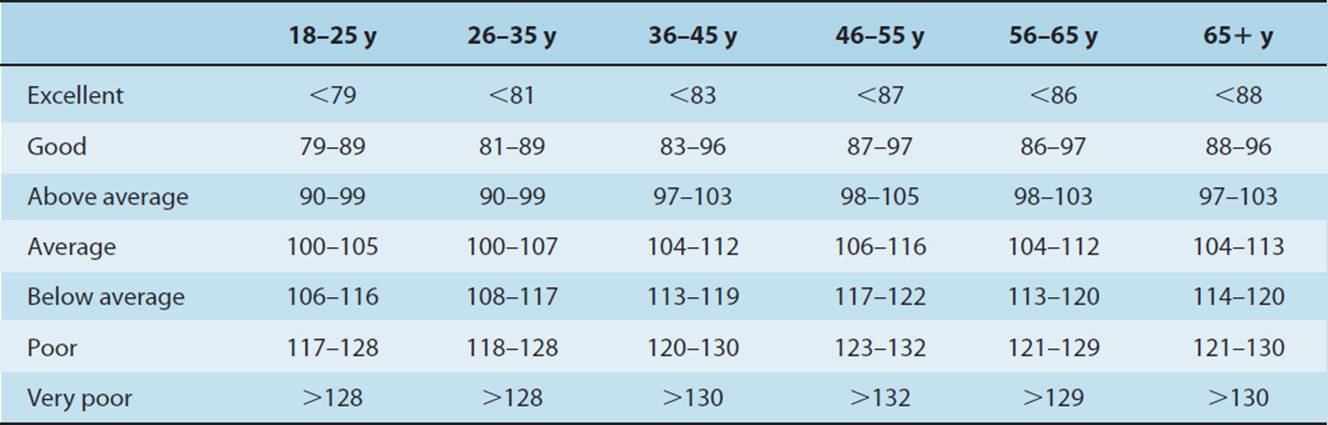
TABLE 3-8 3-Minute Step Test (Women)
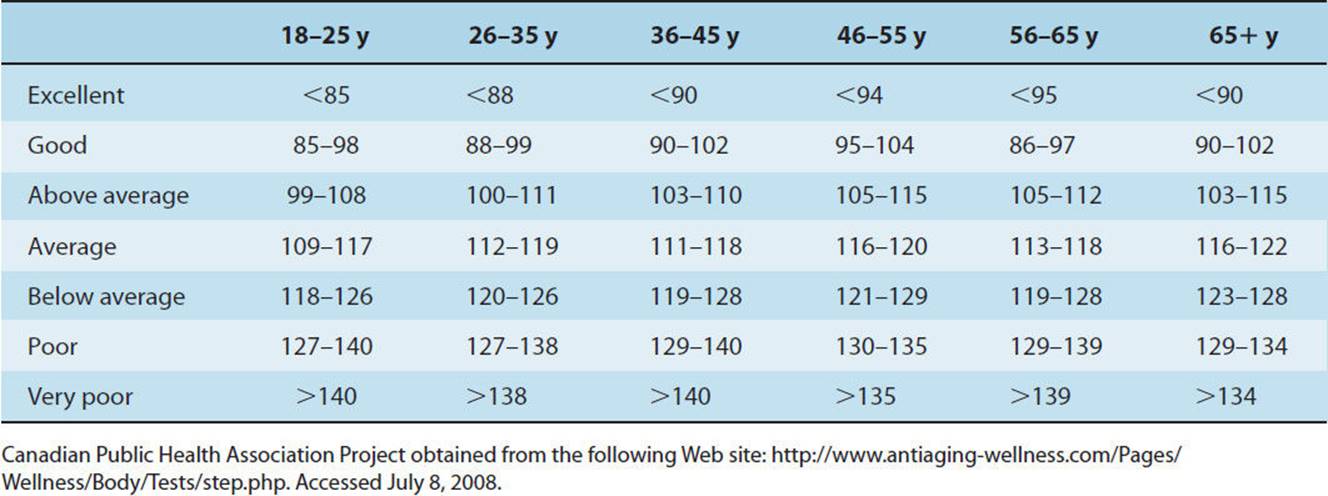
ENDURANCE TRAINING FOR THE HEALTHY INDIVIDUAL
Physical Activity
In the past 5 years, several scientific statements, consensus development conferences, and position stands have emphasized that physical inactivity is a major health problem in the United States. More than 60% of adults are not physically active on a regular basis and 25% are not active at all.86 It is well accepted that men and women of all ages benefit from regular physical activity, and physical activity is often very beneficial in the treatment of persons with chronic disease and disabilities. People who are sedentary can improve their health, fitness, and well-being by becoming moderately active. Because vigorous physical activity can result in anginal episodes, heart attack, musculoskeletal complications, and other adverse responses in certain individuals, exercise testing and prescription are important skills for the practitioner to master.
Physical activity is a broad term used to describe all forms of large muscle movements including sports, dance, work, games, exercise, and lifestyle activities. Many health and quality-of-life benefits are derived from being physically active (Box 3-5).
BOX 3-5
Possible Health Benefits of Physical Activity
Reduces the risk of premature death
Reduces the risk of death due to heart disease
Reduces the risk of developing hypertension
Helps reduce blood pressure in people with hypertension
Reduces the risk of developing colon cancer
Helps control body weight
Helps build and maintain healthy bones, muscles, and joints
Reduces feelings of depression and anxiety
Improves strength in older adults and reduces falls
Promotes psychological well-being and self-efficacy
Adapted from U.S. Department of Health and Human Services. The Surgeon General’s Report on Physical Activity and Health.
In order to encourage more individuals to participate in physical activity, the Surgeon General’s Report on Physical Activity and Health86 and the American College of Sports Medicine (ACSM)83,87 have outlined a basic recommendation for lifelong physical activity. Every U.S. adult should accumulate 30 minutes or more of moderate-intensity physical activity on most, preferably all, days of the week.
Strenuous physical activity is not required to achieve health benefits. Increasing evidence has shown that moderate-intensity physical activity (3–6 METs) leads to health benefits even when ![]() O2peakremains unchanged. Benefits of moderate activity may be achieved in longer sessions of moderately intense activities (ie, 40 minutes of brisk walking) or in shorter sessions of more strenuous exercise (15–20 minutes of running). A moderate amount of physical activity is approximately equivalent to physical activity that uses 150 kcal/day, or 1,000 kcal/wk.86 Physical activity may be structured (walking, running) or unstructured (washing the car, raking leaves). This report also suggests that adults who maintain a regular routine of physical activity that is of longer duration or greater intensity are likely to derive additional benefits, while excessive amounts of high-intensity exercise may increase the risk of injury or other health problems. Table 3-9 provides other examples of moderate physical activity that meet the activity recommendation.
O2peakremains unchanged. Benefits of moderate activity may be achieved in longer sessions of moderately intense activities (ie, 40 minutes of brisk walking) or in shorter sessions of more strenuous exercise (15–20 minutes of running). A moderate amount of physical activity is approximately equivalent to physical activity that uses 150 kcal/day, or 1,000 kcal/wk.86 Physical activity may be structured (walking, running) or unstructured (washing the car, raking leaves). This report also suggests that adults who maintain a regular routine of physical activity that is of longer duration or greater intensity are likely to derive additional benefits, while excessive amounts of high-intensity exercise may increase the risk of injury or other health problems. Table 3-9 provides other examples of moderate physical activity that meet the activity recommendation.
TABLE 3-9 Examples of Moderate Amounts of Physical Activity
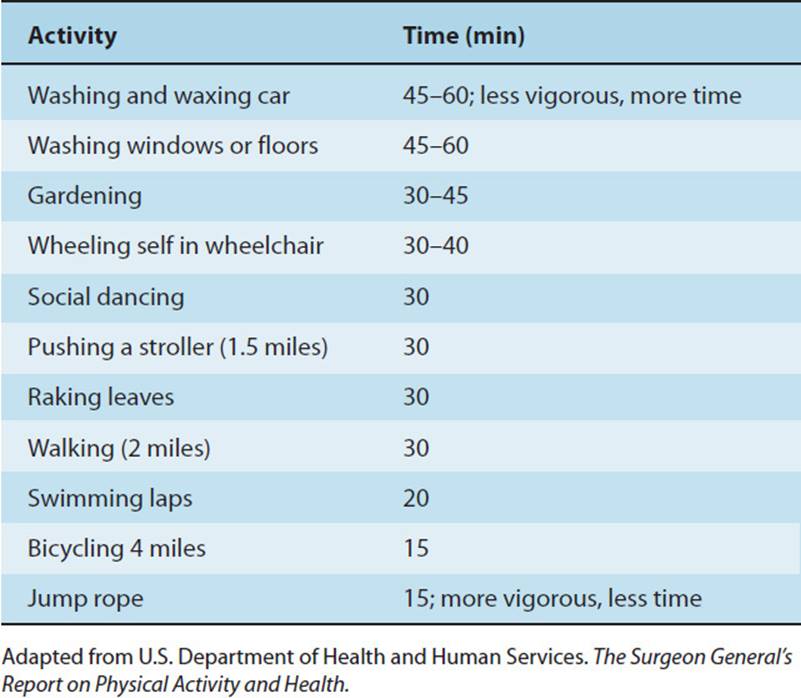
Analogous to the USDA’s Food Guide Pyramid, the Physical Activity Pyramid (PAP) has been developed to encourage a more active lifestyle. Physical therapists may use this tool to educate their patients and clients about the different types of physical activity (Fig. 3-13). As shown in this model, aerobic activities represent one way to incorporate physical activity into a healthy lifestyle. For patients or clients who are too deconditioned to meet the traditional intensities prescribed for aerobic training, a weekly activity plan incorporating activities in the base of the pyramid may result in training changes or prepare an individual to participate in a future training program. This section describes how to develop exercise prescriptions that enhance cardiorespiratory fitness and weight loss for the apparently healthy or well adult. The reader is encouraged to consult other texts for specific training recommendations for improving muscle strength, endurance, and flexibility.28,62,83
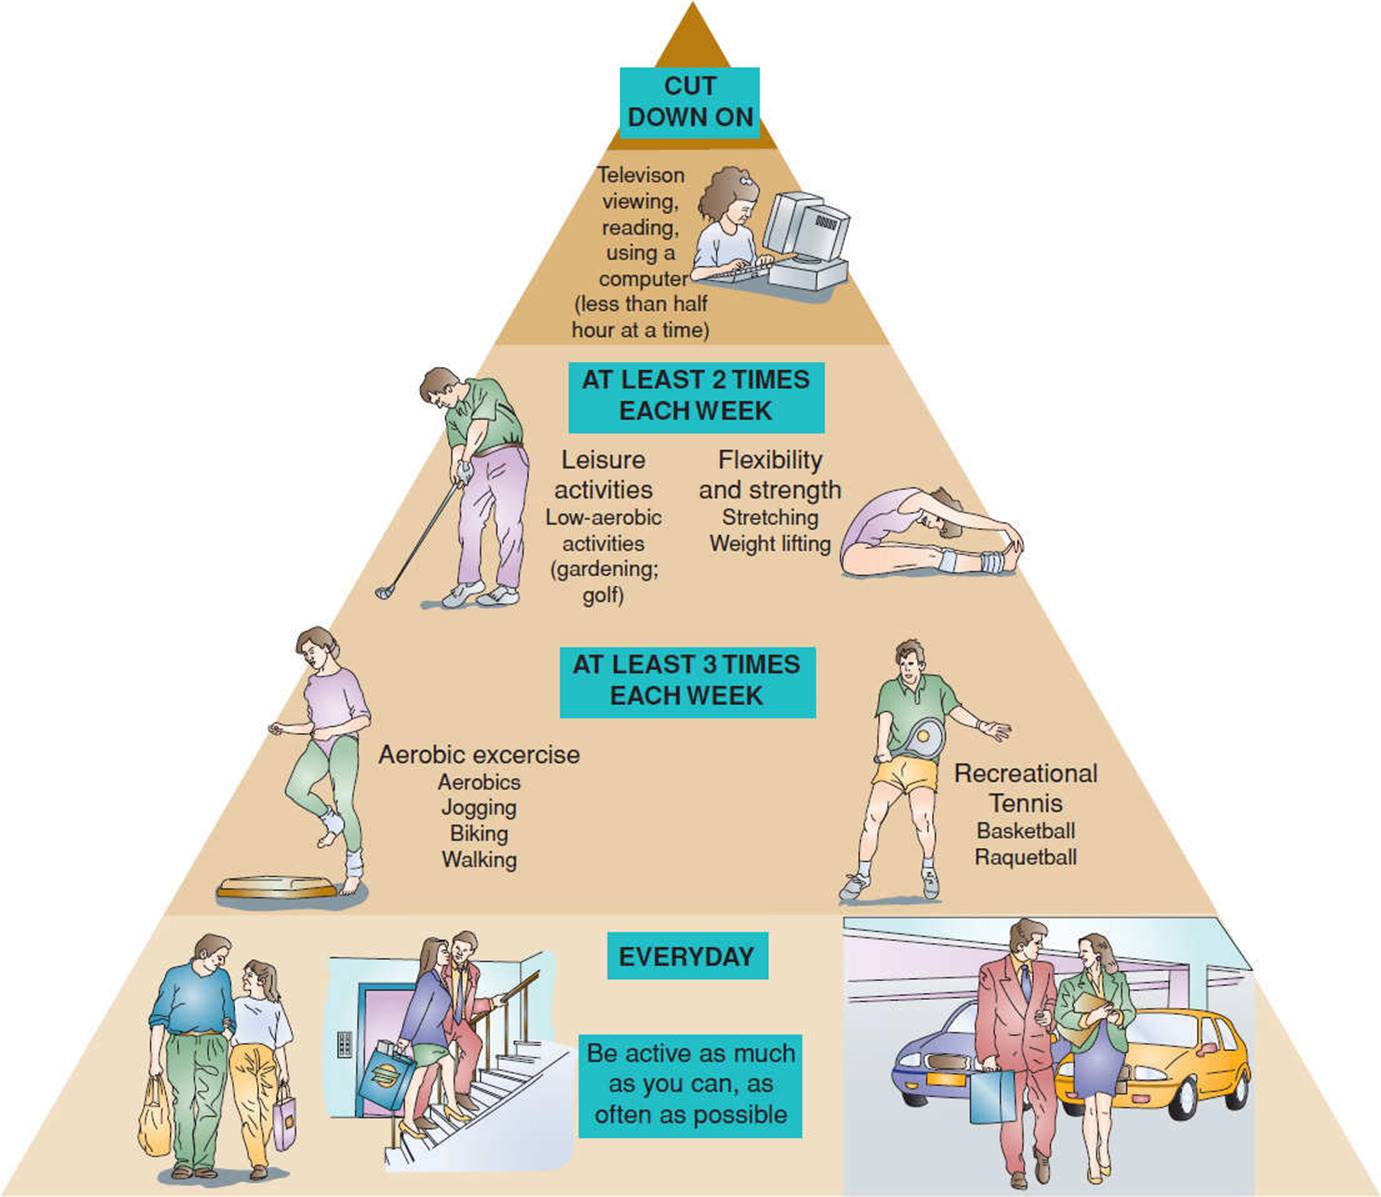
FIGURE 3-13 The Physical Activity Pyramid. (Reprinted with permission from Foss M, Keteyian S. Fox’s Physiological Basis for Exercise and Sport. Boston, MA: McGraw-Hill; 1998.)
Physical Fitness
Health-related physical fitness is a term used to denote fitness as it relates to prevention and health promotion. Pate et al.88 define health-related physical fitness as “a state characterized by (a) an ability to perform daily activities with vigor and (b) a demonstration of traits and capacities that are associated with low risk of premature development of hypokinetic diseases (ie, those associated with physical inactivity).” Physical fitness is a multifactorial construct that includes the five main health-related components of cardiorespiratory endurance, muscular strength, muscular endurance, body composition, and flexibility.
Within each component, a higher fitness level is inversely related to risk for the development of disease and functional disability. Low levels of fitness have been correlated with increased risk of premature death from all causes and specifically from cardiovascular disease.
Cardiorespiratory endurance refers to the ability to perform large-muscle, dynamic, moderate- to high-intensity exercise for prolonged periods. Performance of such exercise depends on oxidative phosphorylation of ATP and therefore preferentially utilizes the long-term energy system. This system challenges the heart, lungs, and peripheral and pulmonary circulation to provide arterial blood to working skeletal muscle. The interrelationship between systems and steps for oxygen transport are summarized in Chapter 5, Fig. 5-7.
EXERCISE PRESCRIPTION FOR THE HEALTHY INDIVIDUAL
Principles and Assumptions of Aerobic Exercise Training
The major objective in exercise training is to produce an aerobic endurance training effect, characterized by physiological adaptations that improve performance in specific tasks. Adaptation depends on the training stimulus threshold (stimulus that elicits a response) and the ability of the organism to change. Physiological adaptation to exercise varies with the magnitude of the stimulus and the length of time over which the stimulus is applied. For example, patients who are particularly deconditioned may adapt quickly to a relatively low training stimulus, whereas an athlete may require many months to show only minimal improvement with a very high training stimulus. Additionally, training adaptations vary both within an individual performing different forms of exercise and across individuals given the same training program.
CLINICAL CORRELATE
For all the reasons cited previously, an individualized exercise program is essential in order to identify a training stimulus of appropriate intensity, duration, and frequency that maximize the physiological response.
Acute Response to Aerobic Exercise
During acute aerobic exercise, the cardiorespiratory system must respond to support the energy requirements of muscle during physical exertion. The cumulative effect of adaptations in HR, stroke volume, cardiac output, blood flow, blood pressure, arteriovenous oxygen difference, and pulmonary ventilation sustain oxygen demands to the active tissues. In response to dynamic exercise, HR increases linearly with work rate and oxygen uptake. This HR response is affected by age, fitness level, intensity of the activity, blood volume, cardiac pathology, medications, body position, and environmental factors. As HR increases with higher-intensity exercise, end-diastolic volume (EDV) decreases as a result of compromised ventricular filling time. The stroke volume is the volume of blood ejected from the heart with each heart beat, and it is equal to the difference between enddiastolic volume and end-systolic volume. Thus, stroke volume initially increases with work rate, but as the cardiovascular demand increases and HR escalates, stroke volume may decrease because of decreased end-diastolic filling time. At exercise intensities up to 50% of ![]() O2peak, cardiac output increases linearly with work rate due to increases in HR and stroke volume. Thereafter, increases in cardiac output depend mostly upon rising HR, although maximum values of cardiac output are affected by age, stature, fitness level, cardiovascular pathology, and body positioning during exercise. As previously discussed, there is a linear increase in SBP with increasing exercise intensity, while diastolic blood pressure may decrease slightly or remain unchanged. An SBP that fails to rise or drops in response to an exercise stimulus can signal a plateau or decrease in cardiac output and may be indicative of underlying cardiac pathology.
O2peak, cardiac output increases linearly with work rate due to increases in HR and stroke volume. Thereafter, increases in cardiac output depend mostly upon rising HR, although maximum values of cardiac output are affected by age, stature, fitness level, cardiovascular pathology, and body positioning during exercise. As previously discussed, there is a linear increase in SBP with increasing exercise intensity, while diastolic blood pressure may decrease slightly or remain unchanged. An SBP that fails to rise or drops in response to an exercise stimulus can signal a plateau or decrease in cardiac output and may be indicative of underlying cardiac pathology.
CLINICAL CORRELATE
While performing exercise testing on a patient/client, exertional hypotension is characterized by an SBP which decreases below baseline toward the end of the test stage or initially rises with exercise stimulus and then falls 20 mmHg or more thereafter. Exercise testing/training should be terminated immediately in subjects demonstrating exertional hypotension, as this response has been shown to correlate with myocardial ischemia, left ventricular dysfunction, and increased risk of cardiac events during follow-up.89 See Chapter 12 for a discussion of the clinical relevance of exertional hypotension.
Pulmonary ventilation during mild- to moderate-intensity exercise increases primarily due to a rise in tidal volume, while respiratory rate response is more important to support ![]() A during high-intensity exercise.
A during high-intensity exercise.
Body Positioning
Posture has an effect on end-diastolic filling, which directly affects stroke volume and the overall strain placed upon the heart with steady work rate. End-diastolic volume is the highest in supine and decreases progressively as the body shifts to semirecumbent, sitting and standing postures at rest. During exercise, end-diastolic volume remains unchanged in the supine position, while it progressively decreases in upright position, placing an increased load on the heart. Stroke volume is also highest in the supine position, resulting in a lower HR and myocardial oxygen demand at a given submaximal work rate.
CLINICAL CORRELATE
Clinicians should be aware that when working with patients with cardiac pathology, initiating exercise in the supine position allows for the highest end-diastolic volume and stroke volume, thereby placing the least amount of strain on the heart. Exercising in upright positions places an increasing demand on cardiac tissues and should be monitored appropriately as the patient is progressively challenged.
Upper Extremity Versus Lower Extremity Exercise
HR, SBP, DBP, pulmonary ventilation, and ![]() O2 are higher, while stroke volume and anaerobic threshold are lower, with upper extremity than lower extremity exercise at a steady work rate. This may reflect the dynamic involvement of smaller muscle groups, with concomitant isometric contraction and vasoconstriction of peripheral vessels in larger leg muscles during exertion. A comparison of mean RPP and estimated M
O2 are higher, while stroke volume and anaerobic threshold are lower, with upper extremity than lower extremity exercise at a steady work rate. This may reflect the dynamic involvement of smaller muscle groups, with concomitant isometric contraction and vasoconstriction of peripheral vessels in larger leg muscles during exertion. A comparison of mean RPP and estimated M![]() O2 during upper extremity and lower extremity exercise is shown in Fig. 3-14. During arm exercise,
O2 during upper extremity and lower extremity exercise is shown in Fig. 3-14. During arm exercise, ![]() O2peak generally varies between 64% and 80% of
O2peak generally varies between 64% and 80% of ![]() O2peak with leg exercise.90 At high workloads, maximal HR, SBP, and RPP are similar or slightly lower with arm exercise. As such, in order to avoid an overestimation of maximal HR during upper extremity training, the prescribed target HR from lower extremity training should be reduced by approximately 10 bpm.91
O2peak with leg exercise.90 At high workloads, maximal HR, SBP, and RPP are similar or slightly lower with arm exercise. As such, in order to avoid an overestimation of maximal HR during upper extremity training, the prescribed target HR from lower extremity training should be reduced by approximately 10 bpm.91
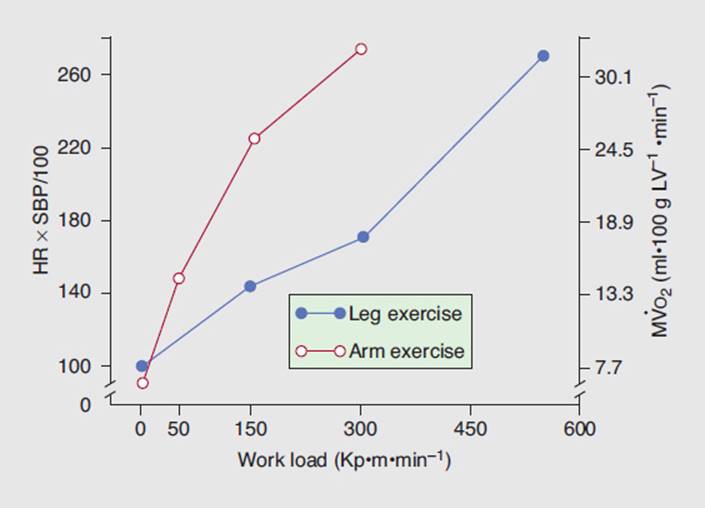
FIGURE 3-14 Mean rate–pressure product and estimated myocardial oxygen consumption (M![]() O2) during arm (broken line) and leg (solid line) exercise. M
O2) during arm (broken line) and leg (solid line) exercise. M![]() O2 is estimated from its hemodynamic correlates, heart rate (HR) multiplied by systolic blood pressure (SBP). (Adapted with permission from Schwade J, Blomqvist CG, Shapiro W. A comparison of the response to arm and leg work in patients with ischemic heart disease. Am Heart J. 1977;94:203-208, and American College of Sports Medicine. ACSM’s Resource Manual for Guidelines for Exercise Testing and Prescription. 5th ed. Philadelphia, PA: Lippincott Williams & Wilkins; 2006.)
O2 is estimated from its hemodynamic correlates, heart rate (HR) multiplied by systolic blood pressure (SBP). (Adapted with permission from Schwade J, Blomqvist CG, Shapiro W. A comparison of the response to arm and leg work in patients with ischemic heart disease. Am Heart J. 1977;94:203-208, and American College of Sports Medicine. ACSM’s Resource Manual for Guidelines for Exercise Testing and Prescription. 5th ed. Philadelphia, PA: Lippincott Williams & Wilkins; 2006.)
CLINICAL CORRELATE
The difference between cardiac response between arm and leg exercise has clinical relevance for the physical therapist. Recommendations regarding intensity of arm exercise training must be reduced by approximately 10 bpm to avoid overestimation of the target HR.
Low-Resistance Versus High-Resistance Training
Resistance training has been found to improve cardiorespira-tory function by creating small volumes of blood that are pumped at very high pressures to the involved muscles. There is a dramatic increase in systolic and diastolic blood pressure with dynamic resistive exercise, especially during the concentric phase of the muscle contraction. For example, MacDougall et al.92 reported a mean BP of 320/250 during the double leg press. Despite speculation that this type of exercise might, therefore, increase resting blood pressure, a recent meta-analysis concluded that resistance training results in decreases of 2% and 4% for resting systolic and diastolic pressures, respectively.93 HR also increases substantially in response to a resistive exercise stimulus, peaking during the last few repetitions of a set. There is no difference in HR response related to the phase of muscle contraction (concentric vs eccentric). Resistance-trained individuals demonstrate resting HRs that are equal or lower than averages for the untrained. In response to resistive exercise training, maximal ![]() O2 has been found to improve slightly with circuit training and for untrained individuals. Resistance training does little to increase
O2 has been found to improve slightly with circuit training and for untrained individuals. Resistance training does little to increase ![]() O2peak, although it may improve cardiovascular endurance by increasing muscle strength and endurance.83 Lower resting HR (HRrest), BP, and, consequently, RPP are positive adaptations of the cardiorespiratory system in response to resistive exercise training.
O2peak, although it may improve cardiovascular endurance by increasing muscle strength and endurance.83 Lower resting HR (HRrest), BP, and, consequently, RPP are positive adaptations of the cardiorespiratory system in response to resistive exercise training.
Intensity of training is often synonymous with training load (amount of weight per repetition) and most easily represented as a percentage of an athlete’s repetition maximum (RM) for an exercise.94 A true 1 repetition maximum (1-RM) indicates that after one successful repetition, the involved muscle has reached a point of fatigue whereby its force-generating capacity would fail to contract sufficiently against the imposed resistance for a second repetition. The muscle is performing at its highest intensity. Typically, exercise sets involving high resistance with low repetition to reach muscle fatigue (1–6 RM) or 90% of the RM are considered high-intensity training stimuli. High-intensity resistance training is believed to provide the most significant gains in strength and power. Moderate-intensity resistance training falls within the parameters of 6 to 12-RM or 70% to 90% of the RM and provides submaximal gains in muscle strength, power, and endurance. Low-intensity resistance training falls below 70% of the RM, usually prescribed at 12 to 20-RM and primarily benefits muscular endurance. In accordance with the National Strength and Conditioning Association,94 the outcomes for various load assignments are that strength and power are best derived from loads greater than 80% of 1-RM, whereas general muscle hypertrophy and muscular endurance are best gained from moderate-to-low loads (60%–80% of 1-RM) with higher volumes. Novices to resistive training, detrained athletes, and those recovering from musculoskeletal injury should initiate exercise programs at low intensity (50%–60% of 1-RM) and progress from there. Children should engage in exercise programs of low-to-moderate intensity, with a high number of repetitions, until they reach puberty.95 It is recommended that cardiac rehabilitation patients follow a standard circuit training program using intensities of 40% to 60% of 1-RM.96
While 1-RM testing is the gold standard for athletes experienced in resistance training, it is not always the practical or safe means of establishing a patient/client’s appropriate training workload. Novices, detrained athletes, children, seniors, cardiac patients, and those recovering from musculoskeletal injury are all examples of individuals who should initiate exercise programs at lower intensities (higher RM values). Estimations of 1-RM can be made from tables such as Table 3-10 to avoid the risks associated with 1-RM testing. It should be mentioned that the accuracy of these tables is controversial and should be used as a starting point to be fine-tuned by the clinician, based upon the ability and response of the client/patient.
TABLE 3-10 Estimating a 1 Repetition Maximum from a Training Load
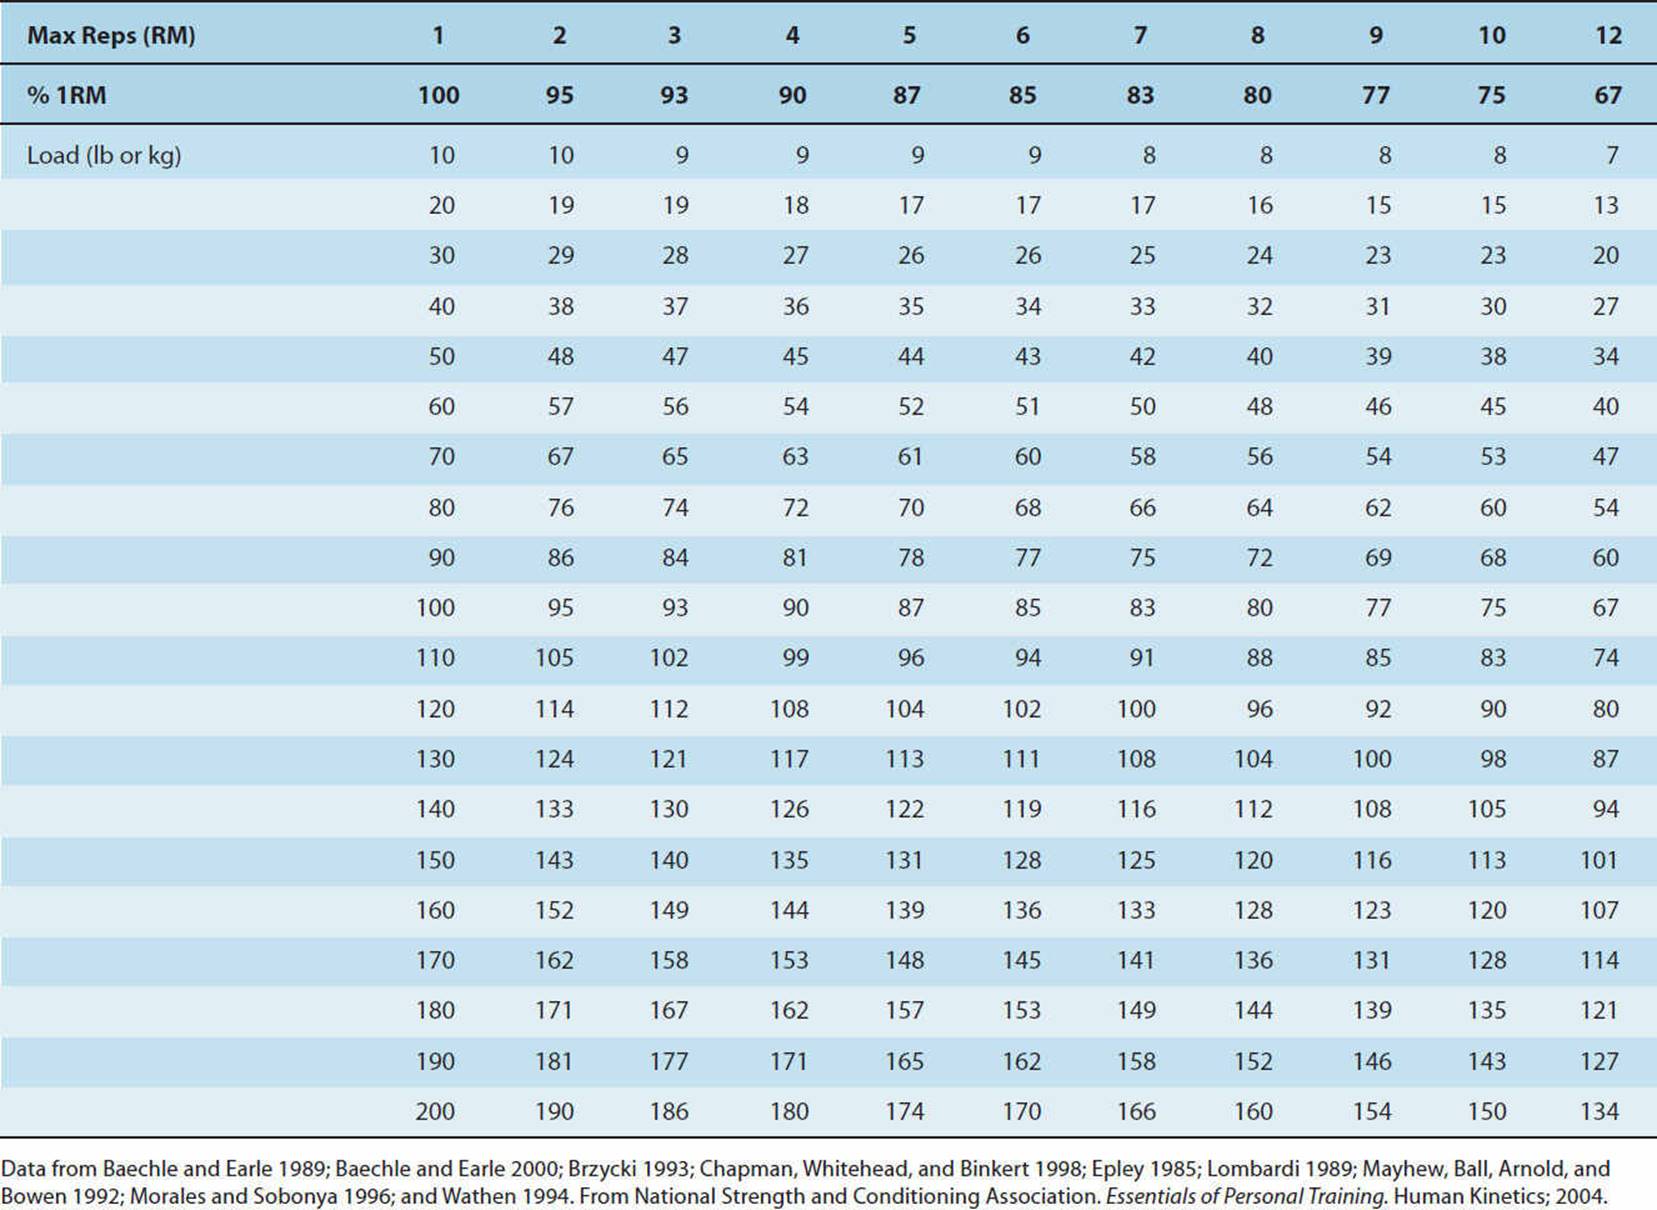
While it is accurate to say that load assignment based upon RM is the most widely accepted means for exercise prescription in athletes, the ACSM recommends using this technique as a general guideline rather than an accurate portrayal of true intensity. They postulate that intensity can be defined as the effort or how difficult the training stimulus is. It has been found that the progressive increase in muscle fiber recruitment parallels increases in blood pressure, regardless of the size of the muscle mass involved.92,97 The magnitude of the blood pressure response depends on the degree of effort (intensity), not the absolute force of contraction.92,97 The elevation in blood pressure associated with high intensity is extreme even when recruiting a small muscle mass.92 Therefore, the ACSM83 recommends that individuals with hypertension, diabetes, at risk for stroke, or at other medical risk from exposure to high blood pressures should avoid high-intensity resistance training. They advise this population to engage in lower-intensity resistance training, by terminating lifting before fatigue. An initial goal of 12 to 13 and a final goal of 15 to 16 on the RPE scale have been recommended for submaximal training.98–100 A target of 19 to 20 on the RPE scale is synonymous with high-intensity strength stimuli for healthy populations.83
CLINICAL CORRELATE
The ability to safely prescribe resistance training loads has great utility for physical therapists involved in wellness programs. While load assignment based upon RM may be used as a general guideline for healthy populations and athletes, special considerations based upon intensity must be made for populations at risk of cardiovascular insult.
Training Principles
A training stimulus must also be task specific. The principle of specificity tells us that the training effects derived from an exercise program are specific to the exercise performed and the muscles involved. In essence, performing specific exercises elicits specific adaptations, creating specific training effects. The concept of specificity should be used relative to the demands of the exercise, rather than to the metabolic pathway that predominates during exercise. For example, heavy resistance training is characterized by the application of high-resistance, low-repetition exercises that produce increases in strength, but with little or no change in endurance. Conversely, high-repetition, low-resistance exercises yield improvements in muscle endurance without significant changes in strength.
In order for a system to show functional improvements, it must be exposed to a high load to which it is not normally accustomed. This is referred to as the overload principle. Physiological adaptation occurs when exercise takes place at a level above normal. The overload principle is applicable to everyone, including the sedentary person, the athlete, persons with disabilities, and patients with cardiovascular and pulmonary disease. By progressively increasing the training variables (eg, frequency, intensity, duration), cardiovascular and/or muscular adaptations occur.
The specificity of training principle works together with the overload principle. When training for specific aerobic activities, the overload must engage the appropriate muscles required by the activity and stress central circulation. This recommendation is supported by studies that have demonstrated significant changes in aerobic capacity when the exercise used for training is also used for testing, whereas little improvement is noted when aerobic capacity is measured by a dissimilar exercise.
The overload of specific muscle groups improves exercise performance and aerobic power by enhancing the capacity of the trained muscle to generate ATP aerobically. This aerobic improvement results from an increase in both the size and the number of mitochondria; increased capillarization of active skeletal muscles, resulting in greater regional blood flow; and a more effective distribution of cardiac output.
The principle of reversibility posits that detraining occurs rapidly when a person stops exercise training. Even among highly trained athletes, the beneficial effects of exercise training are transient and reversible. For example, a study demonstrated a 25% reduction in ![]() O2max in five subjects confined to bed for 20 consecutive days.101 This reduction of nearly 1% per day was accompanied by similar reductions in maximal stroke volume, cardiac output, and the number of capillaries in the trained muscles.
O2max in five subjects confined to bed for 20 consecutive days.101 This reduction of nearly 1% per day was accompanied by similar reductions in maximal stroke volume, cardiac output, and the number of capillaries in the trained muscles.
Principles of Muscular Response to Training
Muscular Fitness
Muscular fitness is a term used to describe the integrated status of muscular strength and muscular endurance. Increasing muscular strength and endurance have been proven to directly impact an individual’s functional ability to perform activities of daily living with less physiological stress, thereby aiding in optimizing quality of life throughout the life span. Considered a health-related fitness component, muscular fitness maintains or improves bone mass, glucose tolerance, musculotendinous integrity, FFM, and RMR. Potential consequences of declining muscular fitness include weight gain and obesity, osteoporosis, type 2 diabetes mellitus, musculotendinous injury, and the inability to carry out the activities of daily living.
Muscle strength has been defined as the maximal force a muscle can generate at a given velocity, and muscle endurance refers to the ability of a muscle to make repeated contractions or to resist muscular fatigue. Tests for measuring muscle strength and endurance may be placed on a continuum. Tests that allow few repetitions are used to measure strength, whereas tests involving high numbers of repetitions may be used to measure endurance. Common tests for measuring muscle strength and endurance are provided in the following section.
Muscular Strength
Muscular strength refers to the maximal force that can be generated by a specific muscle or muscle group. Static strength (isometric strength) can be measured using handgrip dynamometers and cable tensiometers. Measures of static strength are specific to both the muscle group and joint angle involved in testing; therefore, their utility in describing overall muscle strength is limited. Peak force development in such tests is commonly referred to as the maximum voluntary contraction. Static strength is most accurately expressed in Newtons, although kilogram is commonly used.
Dynamic strength testing is commonly tested using the 1-RM. This gold standard for dynamic strength identifies the heaviest weight that can be lifted only once using good form. Normative data are available for upper-body strength and leg strength based on a 1-RM bench press and 1-RM leg press, respectively. The 6-RM and 10-RM tests have also been used as measures of muscular fitness, but estimating a 1-RM from such tests has been problematic.
Isokinetic testing involves the assessment of maximal muscle tension throughout a range of motion set at a constant angular velocity (eg, 180 degrees/s). Equipment utilizing a dynamometer that allows control of the speed of the joint rotation (degrees/s) as well as the ability to test movement around various joints is available from several commercial sources. These devices measure peak rotational force or torque. Some of these testing methods will be discussed in Chapters 9 and 10.
Muscular Endurance
There are two types of tests designed to assess muscular endurance: one, dynamic in nature; and the other, static. Dynamic muscle tests measure the ability of a muscle group to perform repeated contractions over a period of time sufficient to cause muscular fatigue. Static muscle endurance tests assess the ability of a muscle group to maintain a specific percentage of the maximum voluntary contraction for a prolonged period of time. The abdominal muscle endurance test is an example of a dynamic test. This muscle group is tested using a curl-up (crunch) test. During this test, the individual performs slow, controlled curl-ups to lift the shoulder blades off the mat in time with a metronome at a rate of 20 curl-ups/min. A posterior pelvic tilt is maintained. The number of curl-ups completed without pausing up to 75 is compared to normative data according to age and gender. The YMCA Bench Press Test102provides an example of how resistance training equipment may be adapted to measure dynamic muscular endurance. In this test, standardized repetitions are performed using a 35-lb barbell for women and an 80-lb barbell for men. Subjects are scored by the number of successful repetitions they perform at a rate of 30 lifts/min. The Sorensen test is an example of a static muscular endurance test. In this test, the subject is positioned in prone on a table with the upper trunk suspended out over the end. The subject is instructed to maintain the trunk in a static posture parallel to the floor for as long as possible. The effort is timed, and the datum is compared to a normative data set. This test has been used to identify patients at risk for the development of low back pain.
Flexibility
Flexibility is the ability to move a joint through its complete range of motion. Muscle viscosity, ligament and tendon tightness, temperature, adequate warm-up, and distensibility of the joint capsule are among the many variables that affect flexibility. Maintaining flexibility of all joints facilitates movement needed to carry out activities of daily living. When an activity moves the structures of a joint beyond its shortened range of motion, tissue damage can occur.
No single test evaluates total body flexibility. Goniometers, electrogoniometers, inclinometers, tape measures, and visual estimates of range of motion can be useful in fitness screening. Flexibility of the neck, trunk, hips, and shoulders, for example, can be assessed through joint screening tests.
The sit-and-reach test has been commonly used to assess low back and hip-joint flexibility. This test is not a good measure of low back function when the distance reached is the only measure recorded. To improve this test, the administrator should examine the quality of the movement including the angle of the sacrum (90 degrees or more) and the spinal curve. One leg should be assessed at a time to evaluate symmetry. Standardized test procedures should be followed if this test is to be used. Normative data are available based on gender and age.
Essential Components of an Exercise Program
Initial screening of participants for the presence of risk factors and/or symptoms of cardiovascular, pulmonary, and metabolic disease is needed in order to maintain safety during exercise testing and training. Screening provides a mechanism for the identification of individuals who may be at risk and who should undergo a medical examination and monitored graded exercise testing prior to program initiation. Individuals who are apparently healthy (ie, low risk) and have a functional capacity of at least 8 METs may participate in unsupervised exercise programs.83 Supervised programs are strongly recommended for those individuals who have lower functional capacities (<8 METs) or have multiple risk factors. Screening recommendations will be described in Chapters 9 and 10. The focus in this section will be on describing the essential components of an individualized exercise prescription.
Exercise prescriptions include the frequency, intensity, duration (time), mode(s), and progression of exercise. These five components should be utilized when prescribing exercise for individuals of all ages and fitness levels. The following recommendations are guidelines developed from the scientific evidence available on exercise training. An individualized exercise program should be based on the objective evaluation of individual responses to exercise, including measured or estimated ![]() O2peak, HR, blood pressure, rating of perceived exertion, signs and symptoms of exercise intolerance, and possibly an electrocardiogram. Current guidelines do not require that a graded exercise test be completed for all individuals before beginning an exercise program. However, it is recommended that individuals older than 40 years with two or more risk factors undergo formal graded exercise testing before an exercise program is implemented.83 As the exercise prescription is developed, an individual’s goals, behavioral characteristics, and exercise preferences should be considered.
O2peak, HR, blood pressure, rating of perceived exertion, signs and symptoms of exercise intolerance, and possibly an electrocardiogram. Current guidelines do not require that a graded exercise test be completed for all individuals before beginning an exercise program. However, it is recommended that individuals older than 40 years with two or more risk factors undergo formal graded exercise testing before an exercise program is implemented.83 As the exercise prescription is developed, an individual’s goals, behavioral characteristics, and exercise preferences should be considered.
Intensity
Perhaps the most challenging component of an exercise prescription is the exercise intensity. Before setting the target intensity range, or training window, the goal or desired outcome must be clearly identified. A higher training window (70%–85% of HRmax) may be used in order to enhance cardiorespiratory endurance. Deconditioned individuals benefit from intensities as low as 40% to 49% of HR reserve (HRR) or 55% to 64% of HRmax.83 A low- to moderate-intensity training window (eg, 55%–65% of HRmax), which is performed over a prolonged duration, appears to optimize weight reduction. Examples of these will be included in the following section that describes several methods available for determination of patient-specific exercise intensity.
The following approaches for computing exercise intensity may not be appropriate for the elderly and patients with two or more risk factors for heart disease, known cardiovascular disease, or other chronic diseases without appropriate screening and testing.
Oxygen uptake reserve (![]() O2R)—Because
O2R)—Because ![]() O2peak is considered the best measure of cardiorespiratory fitness, a straight percentage of measured or estimated
O2peak is considered the best measure of cardiorespiratory fitness, a straight percentage of measured or estimated ![]() O2peak may be used in prescribing exercise intensity. Traditionally, a training window of 60% to 80% of
O2peak may be used in prescribing exercise intensity. Traditionally, a training window of 60% to 80% of ![]() O2peak has been used. For example, if an individual had an estimated
O2peak has been used. For example, if an individual had an estimated ![]() O2peak of 12 METs determined by a submaximal graded exercise test, the prescribed training window would be set at 7.2 to 9.6 METs.
O2peak of 12 METs determined by a submaximal graded exercise test, the prescribed training window would be set at 7.2 to 9.6 METs.
In a 1998 position stand,103 the ACSM recommended that exercise intensity be computed using a percentage of oxygen uptake reserve (%![]() O2R). The
O2R). The ![]() O2R is the difference between the
O2R is the difference between the ![]() O2peak and resting
O2peak and resting ![]() O2 and it is computed by the following equation:
O2 and it is computed by the following equation:
Target ![]() O2 = (exercise intensity) (
O2 = (exercise intensity) (![]() O2peak −
O2peak − ![]() O2rest) +
O2rest) + ![]() O2rest
O2rest
In this equation, ![]() O2rest is 3.5 mL O2/kg/min or 1.0 MET, and the exercise intensity may range from 50% to 85%, expressed as a fraction of the equation. An intensity as low as 40% may be used in very deconditioned individuals. Because
O2rest is 3.5 mL O2/kg/min or 1.0 MET, and the exercise intensity may range from 50% to 85%, expressed as a fraction of the equation. An intensity as low as 40% may be used in very deconditioned individuals. Because ![]() O2R is highly correlated to the HRR, it is now considered the most accurate way to determine whether the exercise stimulus is intense enough to promote improvements in cardiorespira-tory fitness.
O2R is highly correlated to the HRR, it is now considered the most accurate way to determine whether the exercise stimulus is intense enough to promote improvements in cardiorespira-tory fitness.
Percent of HRmax—Historically, a training window of 70% to 85% of an individual’s HRmax has been used to prescribe exercise intensity. This corresponds to 50% to 85% of ![]() O2peak and provides an adequate stimulus to improve or maintain
O2peak and provides an adequate stimulus to improve or maintain ![]() O2peak. A higher training window of 85% to 95% HRmax may be used for individuals with higher initial fitness levels. Ideally, HRmax is determined from a multistaged exercise test. As previously discussed, when HRmax is estimated by the formula 220 – age, significant error may be introduced. Therefore, it is recommended that the revised formula68 be used:
O2peak. A higher training window of 85% to 95% HRmax may be used for individuals with higher initial fitness levels. Ideally, HRmax is determined from a multistaged exercise test. As previously discussed, when HRmax is estimated by the formula 220 – age, significant error may be introduced. Therefore, it is recommended that the revised formula68 be used:
HRmax = 208 – 0.7 × age.
Heart rate reserve method—A second method involves the use of the HRR method, also known as the Karvonen method. The HRR is computed by subtracting the HRrest from the HRmax to obtain HRR, then 60% and 80% of the HRR is computed and added to HRrest. Sixty to eighty percent of HRR approximates 50% to 85% of ![]() O2peak in most fit individuals but more closely corresponds to 60% to 80% of
O2peak in most fit individuals but more closely corresponds to 60% to 80% of ![]() O2R.
O2R.
Target heart rate range = HRrest + ([HRmax − 0.50 HRrest] × 0.50 and 0.85)
Sixty percent of HRR provides an adequate stimulus for improvement of cardiorespiratory fitness in most individuals and tends to yield a higher training target HR than that obtained from the straight percentage of HRmax.
Rating of perceived exertion—The Borg RPE scales provide important information about how the participant feels or perceives the intensity of the work performed (see Chapter 10). Although considered a more subjective method of rating exercise intensity, the RPE is highly correlated to HR and ![]() O2 in adult subjects across a variety of modes of exercise. This method provides a valuable alternative for self-monitoring in patients and clients who cannot palpate their own pulse. Using the original category Borg scale, a range of 12 (somewhat hard) to 16 (hard) corresponds to a training window intensity necessary for physiological adaptations to exercise training.
O2 in adult subjects across a variety of modes of exercise. This method provides a valuable alternative for self-monitoring in patients and clients who cannot palpate their own pulse. Using the original category Borg scale, a range of 12 (somewhat hard) to 16 (hard) corresponds to a training window intensity necessary for physiological adaptations to exercise training.
Intensity summary—Table 3-11 summarizes the corresponding intensities using three of the methods described. The intensity calculated for a given prescription must be developed in conjunction with the other components of exercise prescriptions (ie, duration, frequency). Time constraints and the individual’s goals must also be considered. If the initial goal is weight reduction, lower-intensity exercise programs performed for a longer duration result in greater kilocalorie reduction.
TABLE 3-11 Classification of Physical Activity Intensity
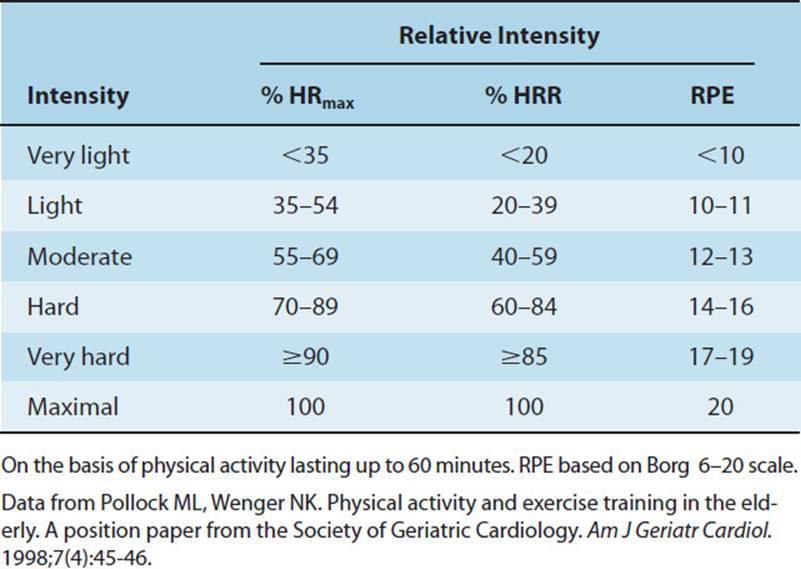
Frequency
The frequency refers to the number of times per week that an individual exercises. Because the incidence of lower-extremity injuries appears to increase with higher frequencies, the ACSM recommends an exercise frequency of 3 to 5 d/wk.83 In most individuals, two sessions per week does not typically evoke cardiovascular changes and is more likely to maintain current levels of cardiorespiratory fitness. Deconditioned individuals, however, may improve their cardiorespiratory fitness with only two workouts per week. For individuals exercising at 60% to 80% of HRR or 70% to 85% of HRmax, an exercise frequency of 3 d/wk is sufficient to improve or maintain ![]() O2peak. In addition, activities involving other muscle groups involved in different types of activities may occur on the off days and may consist of resistance training or recreational activities. It should be noted that lower-intensity exercise prescribed for weight loss and improved fitness goals may require 6 to 7 d/wk in order to achieve the caloric expenditure that is desired.
O2peak. In addition, activities involving other muscle groups involved in different types of activities may occur on the off days and may consist of resistance training or recreational activities. It should be noted that lower-intensity exercise prescribed for weight loss and improved fitness goals may require 6 to 7 d/wk in order to achieve the caloric expenditure that is desired.
Duration
Duration refers to the length of time spent exercising in the training window. The optimal duration depends on the intensity, frequency, and fitness level of the individual. In general, the greater the intensity, the shorter the duration needed for adaptation and vice versa. As described previously, 20- to 30-minute durations are optimal for an intensity of approximately 70% HRmax. However, lower-intensity exercise may result in benefits if performed for up to 45 minutes. More frequent shorter durations (eg, completing multiple 5-minute daily bouts of exercise) may be effective in some deconditioned patients. More than 45-minute durations may increase the risk of musculoskeletal complications. Table 3-12 summarizes the dynamic interplay between intensity, frequency, and duration.
TABLE 3-12 The FIT Formula for Physical Activity—Threshold for Benefits and Target Zone for Optimal Activity Levels

Mode
The mode refers to the exercise device or activity selected to improve cardiorespiratory fitness. The best cardiovascular training activities involve the use of large muscle groups activated in a rhythmic nature for prolonged periods. Treadmills, cycle ergometers, and rowing machines are examples of popular training modalities. Additionally, walking, jogging, swimming, and cross-country skiing exemplify outdoor activities that also improve fitness. For novice exercisers, selecting a mode that requires minimal skill and can be performed at a constant intensity with minimal interindividual variation in energy expenditure is recommended. Later, activities that require more skill may be added.
The use of multiple modalities arranged in a sequence has gained recent popularity. This “circuit training” approach is designed to engage multiple muscle groups of both the upper and lower extremities, and usually includes resistance training. The participant moves from one device to the other (eg, bike, treadmill, weight machine), as quickly as possible, typically performing 1 set of 10 repetitions on each device. The goal is to maintain an elevated HR throughout the circuit, thus evoking an aerobic endurance training effect as well as a muscle strength training effect. The efficacy of these training programs has not been well substantiated. Box 3-6 groups modalities and activities appropriate to their skill level and appropriateness.
BOX 3-6
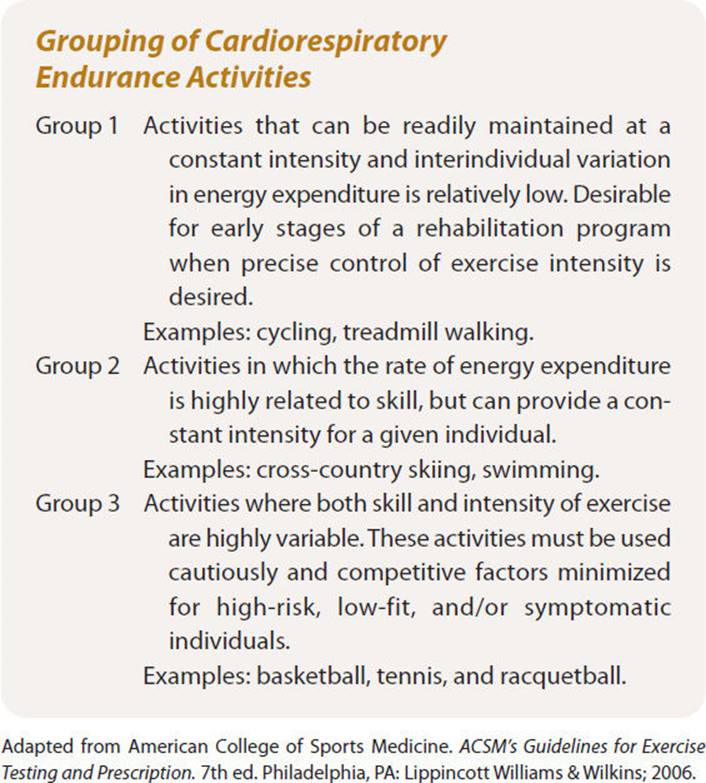
ENVIRONMENTAL CONSIDERATIONS
A variety of environmental influences can affect the acute response and long-term adaptation of the cardiorespiratory system to exercise. The physiological stress of physical exertion is often complicated by environmental conditions such as extreme temperatures, altitude, and pollutants. An understanding of the interrelationships between the environment and the body at exercise is essential for the physical therapist involved in wellness programs.
Extreme Temperatures: Heat and Cold
Thermoregulation
The human body maintains a limited core temperature range of 36.1°C to 37.8°C or 97.0°F to 100.0°F under healthy conditions. Body temperature is maintained with slight deviation by the thermoregulatory center of the hypothalamus. A fine balance exists between heat gain and heat loss within the body. This balance is affected by the individual’s metabolic rate, environmental conditions, and clothing. Physical exertion in extremes of heat and cold can place a heavy burden on thermoregulatory mechanisms, leading to impaired performance, temperature-related illnesses, and injury.
Heat
Energy metabolism generates the majority of internal heat gain. With exercise, there is an increase in metabolic rate, and thus an increase in the rate of internal heat generation. During locomotion 25% of metabolic energy expenditure is translated to mechanical work, while 75% is released as heat in contracting muscles.104 Radiation from the sun or hot surfaces can increase heat stress through conductionwhen a hot object comes in contact with the skin, or when internally generated heat contacts adjacent tissues. Heat is also transferred by the motion of hot air or water through convection. The contribution of radiation and convection to overall heat gain or loss is slight, averaging 10% to 20%. See Box 3-7.
BOX 3-7
Factors Affecting Body’s Mechanisms for Heat Balance and Environmental Stressors
• Air temperature and humidity
• Thermal radiation from the ground
• Metabolic heat production
• Conduction
• Convection
• Sweat evaporation
• Radiation
• Sky thermal radiation
• Respiratory evaporation
• Blood flow to the skin
• Solar radiation
• Reflected solar radiation
The complex interaction between environmental conditions and the athlete.
Data from Wilmore JK, Costill DL. Physiology of Sport and Exercise. 2nd ed. Human Kinetics; 1994.
During exercise, as the temperature of working muscle increases, the peripheral vascular system transports heat to central organs, raising the athlete’s core temperature. In response, cardiac output increases and blood is shunted from central organs to transport heat to the skin. Water secreted onto the skin through sweat glands absorbs this heat, vaporizing the liquid. This evaporative cooling accounts for a significant amount of heat loss from the body. Despite the fact that small amounts of sweat can dissipate large amounts of heat, this mechanism usually cannot offset heat gain sufficiently to maintain core temperature.
Sweat evaporation is limited by several factors including the rate of sweat production and dehydration during prolonged activity. Sweat production is physiologically limited by the individual’s state of acclimation, aerobic fitness level, and genetics.105 Acclimation is a physiological adaptation that occurs with repeated exposure to heat stress during exercise. Acclimation allows an individual to produce higher volumes of sweat in a shorter period of time, while conserving sodium. This physiological adaptation results in less cardiovascular strain and a lower core temperature for a given heat stress.106 The benefits of acclimation are evident within days of exposure, but lost upon prolonged removal of heat stress during exercise. It should be noted that 1 in 20 individuals are heat intolerant and unable to acclimate to heat stress.107
Sweat evaporation can also be limited by the condition of the ambient air and by clothing. The evaporative rate is dependent upon the differential between water vapor pressure on the skin and in the air. On a humid day, the water vapor pressure in the air is high, reducing the pressure gradient and decreasing evaporation rates. Air movement of 4 to 6 mph facilitates maximum evaporative cooling by convection, while lower speeds can hinder the process. Clothing can interfere with evaporation by absorbing sweat and blocking vaporization. Clothing best suited to facilitate evaporation should be a loose-fitting, lightweight fabric with an open weave, and cover the least amount of surface area. When the physiological responses to heat exposure are insufficient to balance heat gain, heat-related disorders can occur. The most common heat-related disorders encountered include heat cramps, heat syncope, dehydration, heat exhaustion, and heat stroke. See Table 3-13 for a description of the signs, symptoms, and first aid related to these disorders.
TABLE 3-13 Heat-Related Disorders, Including Symptoms, Signs, and First Aid
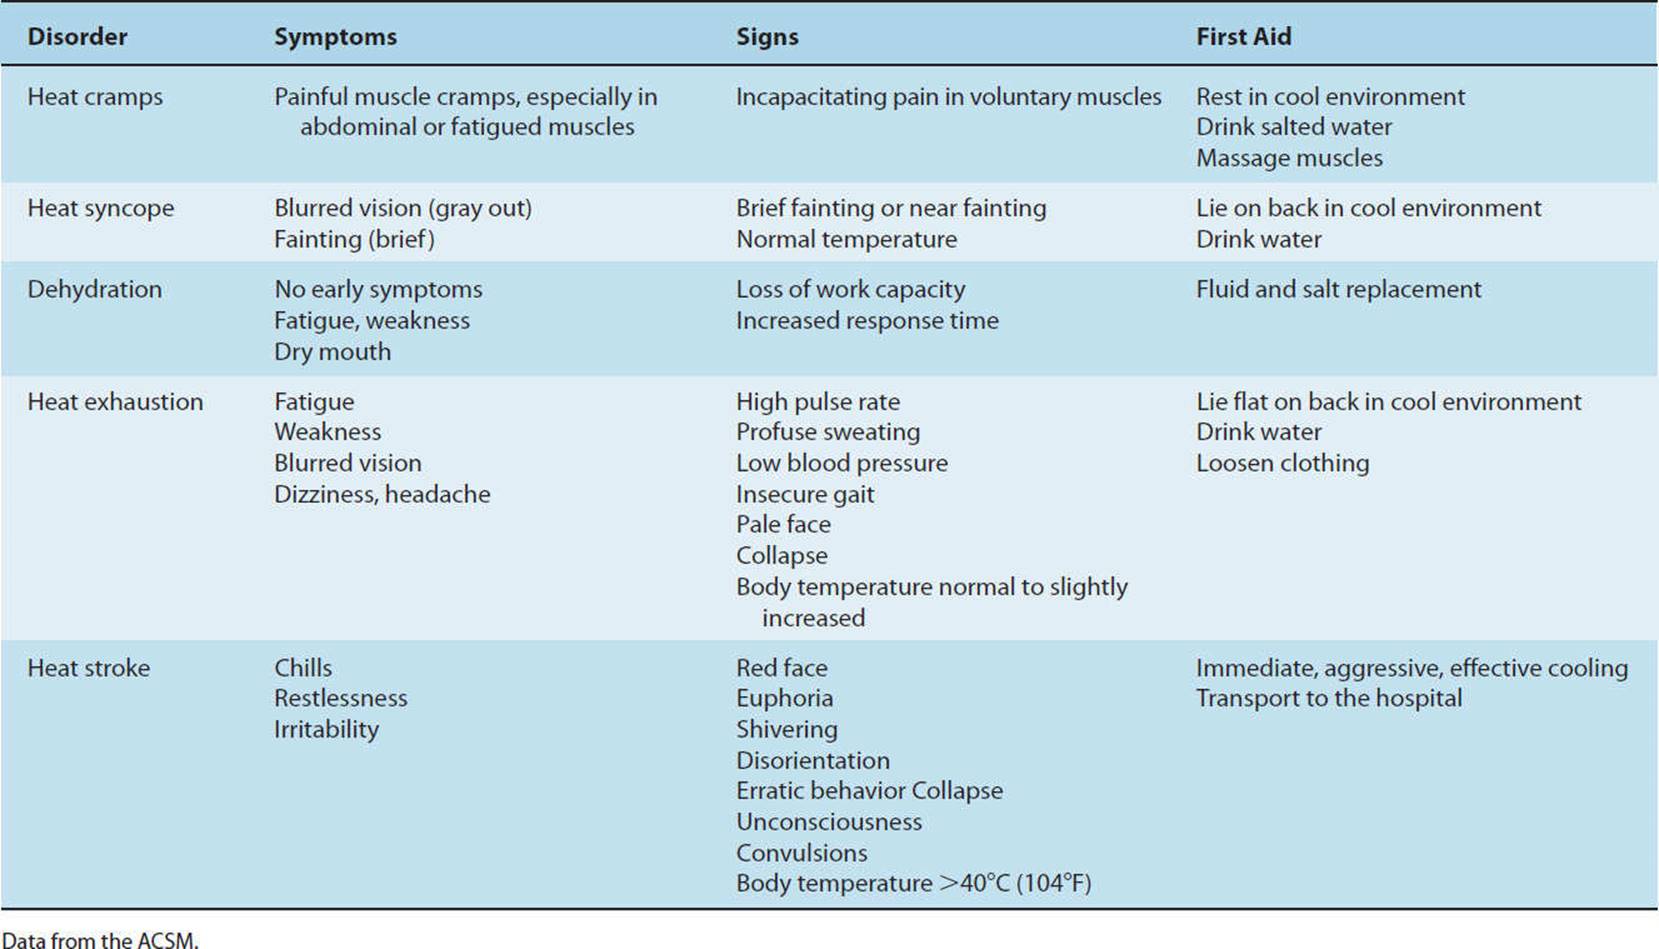
Cold
Cold stress is described as an imbalance between heat gained from metabolism and clothing, and heat loss from environmental factors through convection, radiation, evaporation, and conduction.108 Heat is primarily lost by convection, at an increasing rate with accelerated winds or rapid motion through the air. The windchill factor takes this phenomenon into account, assessing the equivalent temperature for a given wind speed and thermometer reading. Individuals with low body fat and high surface area-to-mass ratios (eg, children) experience more rapid heat dissipation. Heat is also lost through the evaporation of sweat as it soaks through clothing. Proper insulation from clothing is essential to maintain thermal balance. The physiological response to cold exposure includes peripheral vasoconstriction and contraction of inactive skeletal muscle to insulate the body, thereby conserving heat. As previously discussed, during exercise there is an increase in metabolic rate and thus an increase in the rate of internal heat generation. This metabolic heat assists in maintaining core temperature in cold environments. However, if the intensity of exercise decreases as a result of fatigue or cyclic bouts of exercise, metabolic heat declines and cold-related disorders such as hypothermia and tissue damage can ensue. See Table 3-14 for a description of the signs, symptoms, and first aid related to these disorders.
TABLE 3-14 Cold-Related Disorders, Including Symptoms, Signs, and First Aid
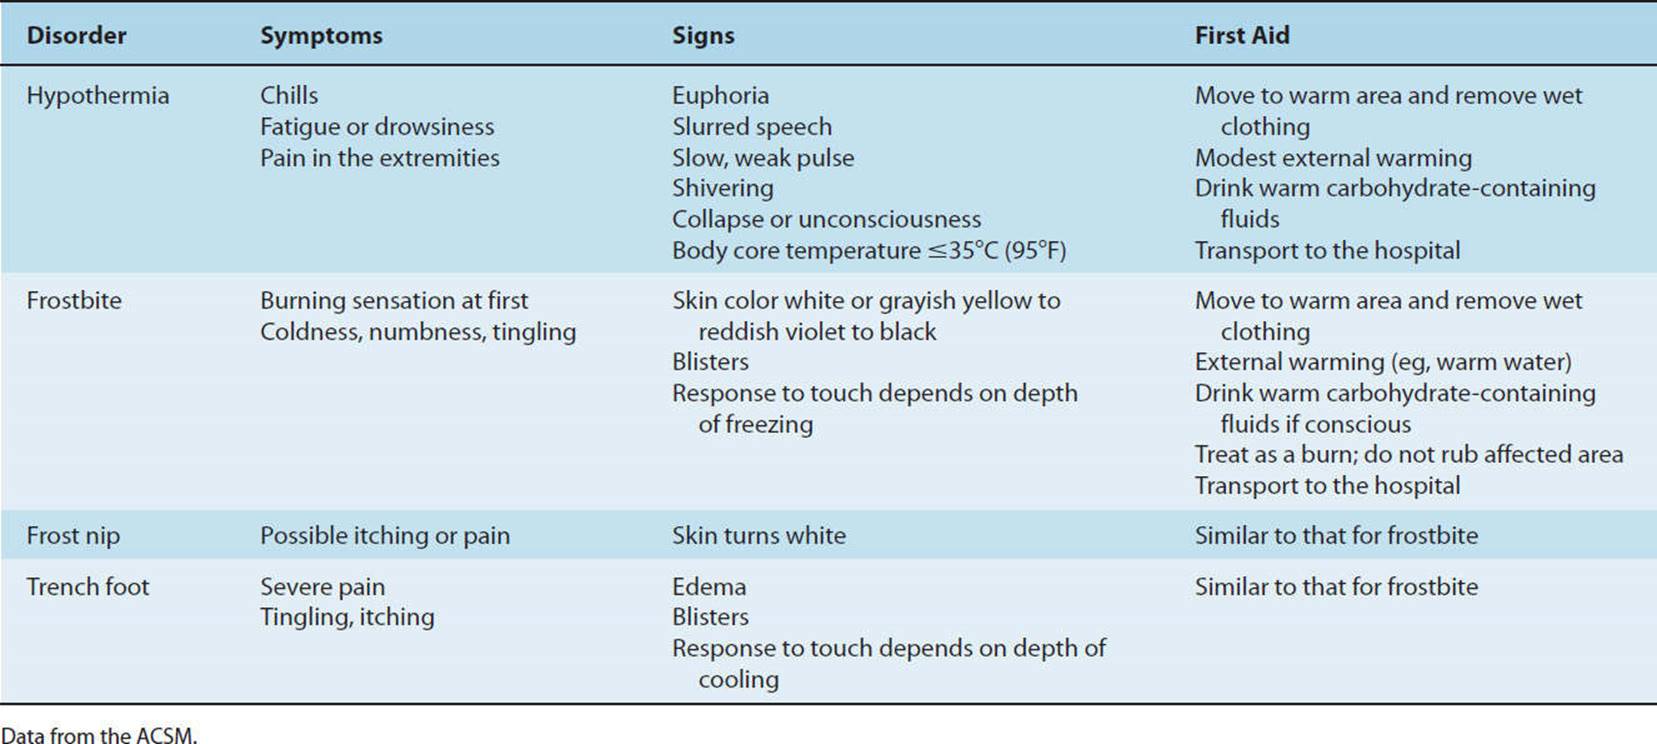
CLINICAL CORRELATE
The body is placed under considerable strain when asked to meet the thermoregulatory demands of physical exertion in extremes of heat and cold. Despite the acute and long-term physiologic adaptations to exercise in the heat, factors such as high humidity and dehydration prevent the dissipation of body heat, placing the athlete at substantial risk of heat-related illness. Exertion in cold weather should be maintained at a relatively steady workload, as sweat evaporation during cyclic bouts of exercise can lead to increased risk of hypothermia. Control of heat balance is best accomplished through prevention and management of risk factors.
High Altitude
Barometric pressure decreases at altitudes above sea level, creating a hypobaric environment with decreased partial pressure of oxygen (PO2) in the inspired air (Table 3-15). With this decline in PO2, there is a concomitant decrease in arterial oxygen saturation and availability of oxygen for transport to tissues throughout the body. The resulting hypoxia (oxygen deficiency) acutely triggers several compensatory mechanisms to increase oxygen availability, ultimately resulting in acclimation with prolonged exposure.
TABLE 3-15 Barometric Pressure for a Standard Atmosphere and Inspired Partial Oxygen Pressure
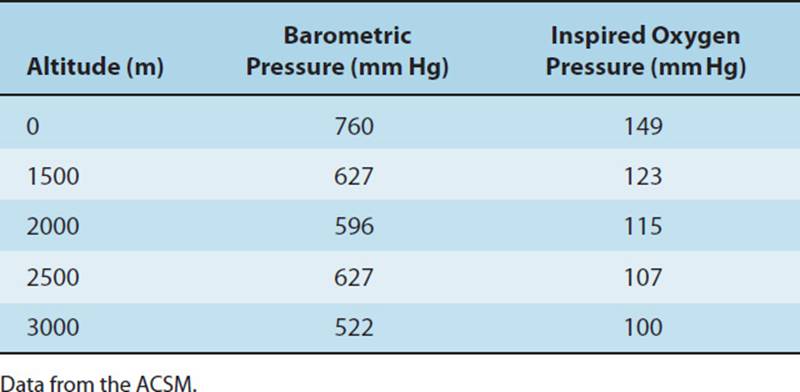
The primary physiological compensatory response with acute exposure to hypobaric conditions above 1,200 m is hyper-ventilation. In response to sudden hypoxia, chemoreceptors in arterial blood vessels signal the brain to increase pulmonary ventilation. Acutely, this is accomplished by increasing tidal volume, but with prolonged exposure and at very high altitudes, an increase in respiratory rate occurs as well. Hyperventilation causes high amounts of carbon dioxide to diffuse from circulating blood into the lungs for expiration. This increased carbon dioxide clearance can increase pH, causing respiratory alkalosis. This physiological response further increases arterial oxygen saturation. Additionally, the cardiorespiratory system acutely responds by increasing HR to create a small increase in cardiac output. Despite these acute compensatory responses both at rest and during exercise, the overall arterial oxygen saturation remains diminished, the magnitude of which is directly dependent upon altitude and exercise intensity as depicted in Fig. 3-15. There is a steady decrease in maximal oxygen uptake of 10% per 1,000 m altitude above 1,500 m.109 While arterial PO2 is lessened, the PO2 in muscle tissue remains constant, reducing the diffusion pressure gradient of oxygen into the tissue by approximately 70%. The oxygen demand for a given submaximal workload remains constant, regardless of changes in altitude. This disparity in oxygen uptake and the oxygen demand required to fuel exertion results in a higher relative exercise intensity for any given workload.106 Because of the increased demand on the cardiorespiratory system, physical performance declines proportionately with the duration of the activity, greatly affecting the endurance athlete.110
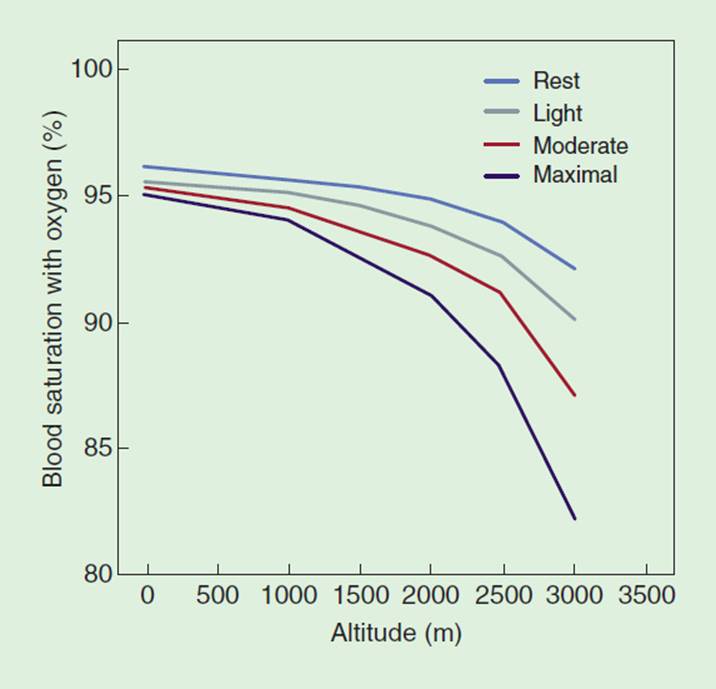
FIGURE 3-15 The effect of altitude and exercise levels on arterial oxygen saturation. Adapted from the American College of Sports Medicine. (Adapted from ACSM’s Resource Manual for Guidelines for Exercise Testing and Prescription. 5th ed. Philadelphia, PA: Lippincott Williams & Wilkins; 2006.)
Over time, the human body acclimates to hypobaric conditions. The resting ventilatory rate stabilizes at 40% above sea-level values (at 3,000 m) within 3 to 4 days.105 Pulmonary ventilation takes longer to stabilize during exercise, reaching up to 100% above sea-level norms.105 Within the first weeks at an altitude, plasma volume progressively decreases, resulting in increased hematocrit and increased oxygen transport. Red blood cell production is augmented, increasing total blood volume and blood viscosity. This leads to reduced stroke volume and cardiac output at rest and with exercise, after 2 weeks of altitude exposure. Skeletal muscle changes include increased mitochondria, myoglobin concentration, and capillary density to improve peripheral oxygen uptake. These adaptations allow the individual to compensate for the decreased PO2 experienced at moderate altitude after 2 to 3 weeks of exposure and are reversed after one month at seal level. For this reason, some athletes and coaches are proponents of altitude training and training in hypobaric chambers to enhance performance prior to an event.
As discussed above, the human body is placed under extreme challenge when asked to perform at high altitude and can easily fall subject to one of the several illnesses. These illnesses include acute mountain sickness, high-altitude pulmonary edema, and high-altitude cerebral edema, the symptoms of which range in severity. Mild symptoms can vary from headache, nausea, vomiting, decreased appetite, and sleep disturbances, while more serious cases experience fatigue, chest pain, dyspnea, tachycardia, and ataxia. These illnesses can best be avoided by adjusting the amount and rate of ascent, engaging in altitude training regimes, and gradually increasing the training workload. Other preventive measures include hydrating adequately, eating a high-carbohydrate diet, and taking supplemental vitamin C, E, and iron a few weeks before and after ascent.
CLINICAL CORRELATE
Unacclimated skiers, mountain climbers, cyclists, and runners who ascend to high altitudes can experience impaired physical performance and illnesses of varying severity. Endurance athletes are most significantly affected by hypobaric conditions due to their reliance on the aerobic energy system, while anaerobic athletes (sprinters) experience minimal effects. The more rapid and higher the ascent, the greater the risk of illness. Athletes can enhance performance and diminish the risk of illness through prevention and preparatory training techniques.
Pollution
Since the onset of the industrial revolution, pollution has progressively affected the condition of ambient air that is inhaled through the respiratory tract into the lungs for respiratory exchange. Because of the severity of pollution in many areas, athletes are frequently exposed to the problems related to exercising in polluted air.106 The seriousness of respiratory compromise due to these pollutants is directly correlated with the pollutant concentration, exposure time, air temperature, humidity, and route of inspiration. The mucous membranes of the nose are an effective barrier to large particles and highly soluble gases, while allowing small particles and less soluble gases to reach deeper airways and lung tissue. Mouth breathing during exercise provides less air filtration, allowing more pollutants to pass through the lungs to blood and ultimately body tissues. As these pollutants make their way through the body, they can reduce alveolar diffusion capacity, reduce oxygen transport capacity, and cause irritation of the airways, which may lead to bronchoconstriction.106
Industry and population density are directly related to pollution severity due to the emission of cardiac output, sulfur and nitrogen oxides, hydrocarbons, and particles from gas-powered equipment and automobiles. Exercising in high traffic areas can expose the athlete to high cardiac output levels, which have been found to interfere with oxygen transport and availability from hemoglobin. While no significant effect has been demonstrated on healthy individuals exercising at moderate intensities, exercise time and ![]() O2peak are inversely related to cardiac output concentration during high-intensity exercise. Cardiac patients exposed to high levels of cardiac output may be at risk of complications such as arrhythmias and early onset of angina during submaximal exercise.106 Primary pollutants may interact with each other to magnify their effect and are compounded by temperature and humidity. The combination of high temperature and humidity can contribute to smog phenomena associated with high ozone (O3) levels. Symptoms related to O3 exposure include throat irritation, cough, nausea, shallow breath, headaches, and chest pain, and are predominant in asthmatic patients. In lower temperatures, pollutants emitted from increased fuel consumption for heating combined with high humidity can create fog high in sulfuric acid (acid rain) and sulfates. Sulfur oxides can irritate the upper respiratory system, causing reflex bronchoconstriction and airway impedance. Nasal mucosa can effectively remove most of sulfur oxides, when nose breathing is used. Athletes are at risk due to the common use of mouth breathing techniques as well as asthma patients with sensitive airways. Particles emitted into the air usually consist of aerosols, soot, dust, and smoke, which are associated with bronchoconstriction when inhaled. Here again, mouth breathing during exercise increases pollutant exposure.
O2peak are inversely related to cardiac output concentration during high-intensity exercise. Cardiac patients exposed to high levels of cardiac output may be at risk of complications such as arrhythmias and early onset of angina during submaximal exercise.106 Primary pollutants may interact with each other to magnify their effect and are compounded by temperature and humidity. The combination of high temperature and humidity can contribute to smog phenomena associated with high ozone (O3) levels. Symptoms related to O3 exposure include throat irritation, cough, nausea, shallow breath, headaches, and chest pain, and are predominant in asthmatic patients. In lower temperatures, pollutants emitted from increased fuel consumption for heating combined with high humidity can create fog high in sulfuric acid (acid rain) and sulfates. Sulfur oxides can irritate the upper respiratory system, causing reflex bronchoconstriction and airway impedance. Nasal mucosa can effectively remove most of sulfur oxides, when nose breathing is used. Athletes are at risk due to the common use of mouth breathing techniques as well as asthma patients with sensitive airways. Particles emitted into the air usually consist of aerosols, soot, dust, and smoke, which are associated with bronchoconstriction when inhaled. Here again, mouth breathing during exercise increases pollutant exposure.
The U.S. Environmental Protection Agency (EPA) has established national air quality standards to protect against harmful health effects and is responsible for informing and alerting the general population about air quality.106The EPA uses the air quality index (AQI) as a guideline for five primary pollutants: ground-level O3, particulate matter, carbon monoxide, sulfur dioxide, and nitrogen dioxide. The AQI converts pollutant concentrations in the ambient air to a value rated from 0 to 500. Under the Clean Air Act, an AQI value greater than 100 indicates air pollution in an unhealthy range. Prior to engaging in outdoor activity, individuals can access local AQI ratings to prevent unsafe exercise participation by following the EPA’s health advisory statement. An example of how the AQI is used to advise individuals on how to best protect themselves from pollutant exposure to O3 is found in Box 3-8. The AQI can be easily accessed on the Web site at http://airnow.gov/index.cfm? action airnow.currentconditions.
BOX 3-8
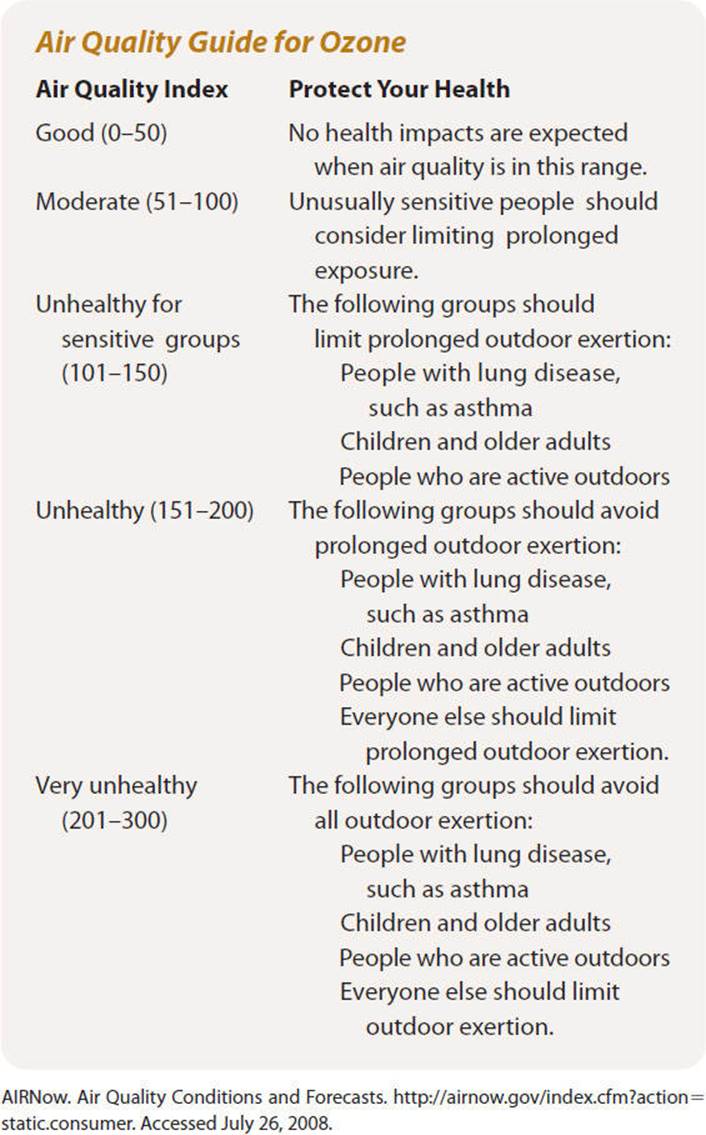
CLINICAL CORRELATE
The environmental effects of pollution can affect the body’s cardiorespiratory response to the physical demands of exercise. The best means for minimizing the effects of outdoor pollutants is avoidance of exposure. Limiting exercise in areas of high traffic and industry can limit cardiac output exposure, preventing undue cardiac stresses. Avoidance of exercise during conditions of high humidity with associated fog is especially important for asthmatic patients, athletes, and those with respiratory tract sensitivities. Information regarding local air pollution and current health advisories can be obtained by consulting the EPA at http://www.epa.gov.
THE EXERCISE SESSION
There are three components to the exercise session: a warm-up phase, an endurance phase, and a cool-down phase.
Warm-up Phase
The warm-up should be gradual and of sufficient intensity to increase muscle and core temperature without causing fatigue. It may consist of 5 to 10 minutes of low-intensity calisthenics and stretching, utilizing the major muscle groups, and include 5 to 10 minutes of the endurance activity performed at a low intensity and progressed to the lower limit of the training window. For example, if jogging is the endurance activity, a slow walk progressing to a brisk walk can be used to gradually increase HR.
Most of the perceived benefits of a warm-up are well documented. Benefits include gradual increases in muscle temperature and peripheral blood flow, energy metabolism (enhanced lipid catabolism and decrease in carbohydrate metabolism), and increased tissue elasticity. The warm-up has been shown to improve neuromuscular function (enhanced function of the CNS and neuromuscular recruitment of motor units), maintain acid–base balance, and reduce the oxygen deficit during more vigorous exercise. Among the unsubstantiated benefits of the warm-up is the reduced risk of musculoskeletal injuries.
Endurance Phase
The endurance phase provides the stimulus designed to develop cardiorespiratory fitness. The endurance phase maintains the HR or other marker of exercise intensity in the training window. This phase may last between 20 and 60 minutes. As previously described, the duration of this phase depends on the intensity of the exercise. For example, a duration of 20 minutes at a high intensity is generally perceived as vigorous exercise, whereas moderate-intensity programs may last 30 minutes or more. This phase may incorporate treadmill work, cycle ergometer work, recreational games or activities, resistance training, or several of the previously cited exercises. The endurance phase may consist of continuous or discontinuous (interval) activities, where periods of exercise alternate with periods of rest. A sample walking program using continuous training and a walk/jog program incorporating interval training are provided in Tables 3-16 and 3-17, respectively.
TABLE 3-16 Sample Aerobic Walking Program
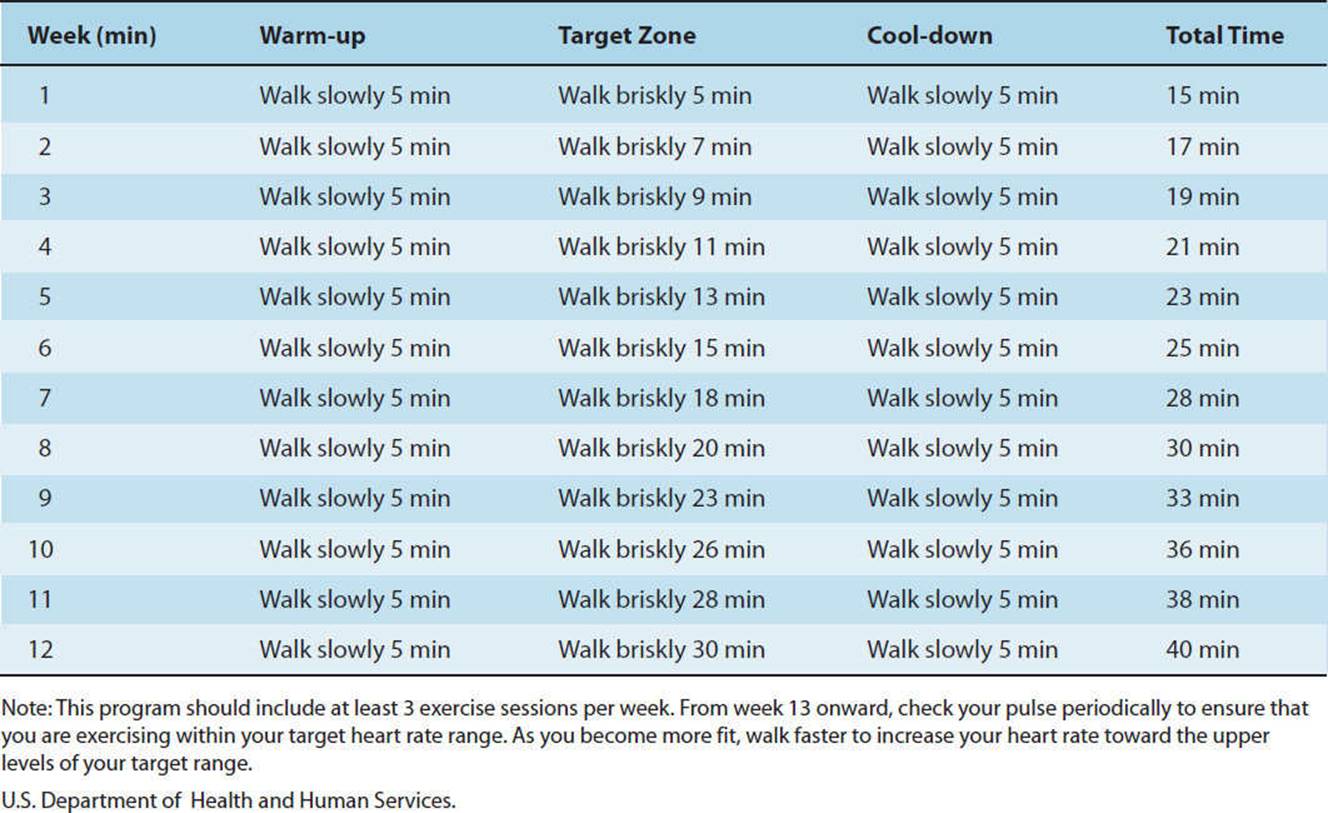
TABLE 3-17 Sample Aerobic Jogging Program with Interval Training
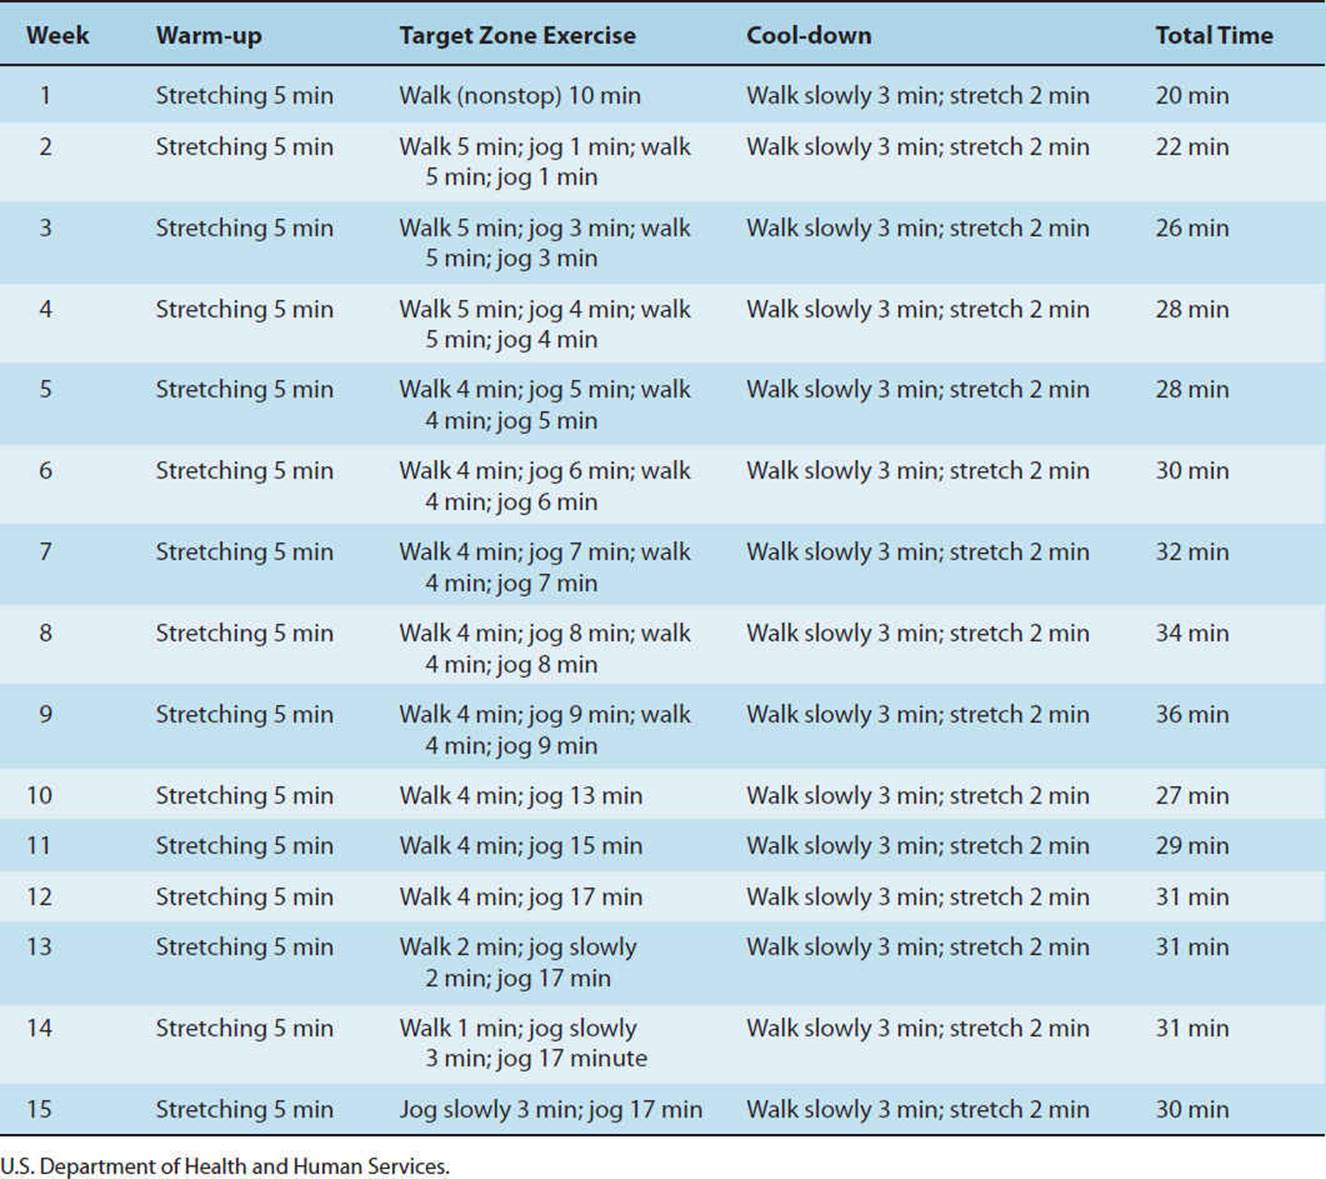
Cool-down Phase
The cool-down phase provides a gradual recovery from the endurance phase and allows elevated metabolic processes to return to baseline slowly. This phase should consist of exercise of diminishing intensity (ie, slower walking), calisthenics, or stretches, called an active cool-down. Some clinicians have advocated the inclusion of yoga, t’ai chi, and relaxation training into the cool-down phase. Further evidence is needed to document the effectiveness of these approaches. Typically cool-down periods last from 5 to 10 minutes.
Active cool-down enhances venous return, prevents blood from pooling in the extremities, and permits circulatory adjustments following training. Other important benefits include prevention of postexercise hypotension and dizziness. The cool-down phase also promotes a more rapid removal of lactic acid and facilitates heat dissipation. An important benefit of cool-down in patients with heart disease is the reduced likelihood of threatening ventricular dysrhythmias and reduced sudden cardiac death.
FITNESS AND WELLNESS
In past years, the majority of fitness enthusiasts participated in traditional forms of muscular resistance training programs, aerobic activities such as jogging, and team or individual sports. Today, there exists a tremendous market geared toward attracting and retaining individuals of all fitness levels in the group class environment. These group classes are varied in difficulty, spanning a diverse range of physical demands and styles. Physical therapists involved in tailoring wellness programs have an obligation to their patients to attain a basic understanding of the components and physical demands of an exercise style prior to recommending its use. While the wide genre of classes is far too expansive to cover in this section, we will attempt to highlight the most popular fitness (aerobics and spinning) and wellness (yoga, t’ai chi, and pilates) activities.
Fitness Classes
Aerobics
Mixed-impact aerobic classes are choreographed to music approximately 130 to 150 bpm, incorporating variations of high-impact and low-impact aerobic movements to provide a full body workout. High-impact movements place greater mechanical loading stresses on the lower extremity and spine, and typically include jumping, hopping, and lunging moves. Low-impact movements, such as turns, steps, and kicks, minimize physical stresses. The benefit of mixed-impact aerobic class is that it provides both a musculoskeletal and cardiovascular challenge that can be easily modified to suit the fitness level of participants. Intensity levels can be modified by altering the speed and range of motion of the movement, altering the arm component of the move, varying the amount of traveling distance completed, and adjusting the vertical height involved.106 A review of the literature revealed a large difference in the energy expenditure between low-impact (4–5 kcal/min) and high-impact (10–11 kcal/min) aerobic movements.111 These mixed-impact aerobic classes can include variations such as cardio-dance and kick-boxing.
Step training is a very popular fitness class that also challenges the cardiorespiratory system, while providing a strong musculoskeletal stimulus as well. While described as a low-impact aerobic exercise program, it has been the experience of this author that intensities vary significantly based upon the instructor and fitness level of the participants. Classes are structured with a cadence averaging 120 to 130 bpm, but speeds vary. Step benches range from 4 to 12 in. in height and can easily be adjusted with risers. Novices are encouraged to initiate training at the lowest level to maintain a low-impact aerobic workout while isolating each movement with precision. Once the stepping moves have been mastered, research strongly indicates that increasing bench height is the preferential method to increase aerobic intensity.106 Way too often, overzealous steppers will incorporate high-impact bounding of the step in place of good technique. This high-impact loading poses a tremendous mechanical stress to the lower extremities, predisposing the individual to overuse injuries. Similar classes are formatted with the substitution of a BOSU balance trainer in place of the traditional step bench. The BOSU112 is an air-filled dome with a 26-in. diameter platform, which provides a dynamic surface to challenge stepping and balancing maneuvers.
Spinning
Spinning classes have gained widespread popularity in fitness environments. Unlike other fitness and wellness activities offered in a group format, spinning is a non–weight-bearing activity that provides a challenging cardiovascular experience for the fitness enthusiast. Guided by visual imagery, cyclists are led through a virtual outdoor tour, complete with valleys, hills, straightaways, and finish lines.113 While there is no established cadence for these aerobic classes, intensity is varied by musical tempo and commands given by the instructor. These classes appeal to cyclists of all experience levels because students can easily control their workout intensity by adjusting their pedaling speed, wheel resistance, and body position (seated vs standing) while cycling with the group.114
Wellness Classes
Yoga
Developed in India more than 5,000 years ago, yoga is derived from a Sanskrit term meaning “to unite,” as in uniting the body, mind, and spirit.115 Yoga can be described as both a physical and psychological discipline, its complete practice consisting of an enormous body of precepts, attitudes, techniques, and spiritual values.116 Yoga practice in Western society is predominantly focused on Hatha yoga, which encompasses many different styles. Hatha yoga forms consist of a series of asanas (exercises) done with specific breathing patterns and mindfulness to achieve each posture. Yoga practice is believed to produce numerous benefits including increased strength and mobility, improved posture and balance, enhanced lymphatic flow, and a relaxation response, which affects neural, cardiovascular, and respiratory systems.
The most commonly practiced forms of Hatha yoga include Iyengar, Ashtanga, Bikram, Vinyasa, and Kundalini. Iyengar yoga is firmly based on traditional yoga doctrine, emphasizing the development of strength, stamina, flexibility, and balance, as well as concentration and meditation. It is characterized by fluid movements with great attention to detail and precise focus on body alignment. Iyengar yoga emphasizes standing postures and is known for its use of props, such as belts, blocks, blankets, and pillows to aid novices and those with physical limitations in performing asanas. Ashtanga yoga is a progressive sequence of poses performed at a rapid pace to generate intense, internal heat and profuse sweat. This heat-building process is intended to detoxify muscles and organs, improve circulation, and create a fit, strong body, with a calm mind. This athletic style of yoga is commonly referred to as “power” yoga and provides a rigorous workout for participants. Bikram, also referred to as “hot” yoga, is composed of a series of 26 poses executed in a room heated to 95°F to 100°F. Through contraction and extension of the body, these asanas are intended to address every bodily system including the digestive, respiratory, circulatory, immune, endocrine, lymphatic, skeletal, muscular, and nervous systems. Because of the heated environment, Bikram yoga challenges the cardiorespiratory system while affording the musculoskeletal system great extensibility. Vinyasa yoga is a flowing series of traditional yoga postures that is intended to warm and energize the body through an aerobic effect. The purpose of Vinyasa is to purify the body through increased circulation and sweating while improving flexibility.
Kundalini yoga is a physical and meditative style that focuses on psychospiritual growth and the body’s potential for maturation to create a communication between “mind” and “body.” Kundalini yoga gives special consideration to the role of the spine and endocrine system while concentrating on chakras (psychic centers) in the body in order to generate a spiritual power, which is known as kundalini energy. Kundalini is considered the prana (potential life force) lying dormant in our bodies, which can be awaked by spiritual discipline. The practice of Kundalini yoga consists of a number of bodily postures, expressive movements and utterances, breathing patterns, and concentration. The wide scope of yoga practice provides the opportunity to pursue experiences ranging from a low-intensity, relaxing state to a high-intensity athletic workout.
CLINICAL CORRELATE
When recommending yoga practice for patients in rehabilitation and wellness programs, the astute physical therapist should be aware of the physical demands associated with different forms of yoga. For instance, a healthy athlete looking for an aerobic program might best be served by the Ashtanga style, while Kundalini yoga would better suit the needs of a debilitated patient with chronic pain.
While there is limited outcome-based research on yoga as it directly applies to cardiopulmonary rehabilitation, sufficient evidence exists to support the exploration of yoga in both therapeutic and wellness environments, for patients across the lifespan. Yoga has been found to improve vital capacity of the lungs in college students,117 while demonstrating decreased resting HR, increased ![]() O2peak, and parasympathetic baroreflex sensitivity in the elderly.118Tandon demonstrated that yoga practice with COPD patients resulted in significantly greater gains in mean maximum work and decreased symptoms, when compared with traditional physical therapy treatment.119 It has also been well documented that yoga has a positive impact on pulmonary and autonomic function in patients with asthma.115 Research has demonstrated the benefit of yoga for musculoskeletal conditions, pain management, wound healing, balance, and fall prevention.
O2peak, and parasympathetic baroreflex sensitivity in the elderly.118Tandon demonstrated that yoga practice with COPD patients resulted in significantly greater gains in mean maximum work and decreased symptoms, when compared with traditional physical therapy treatment.119 It has also been well documented that yoga has a positive impact on pulmonary and autonomic function in patients with asthma.115 Research has demonstrated the benefit of yoga for musculoskeletal conditions, pain management, wound healing, balance, and fall prevention.
T’ai Chi
T’ai chi is an ancient martial art developed in China in the 12th century A.D. As with many alternative practices, it is considered a way of life that integrates the mind, body, and spirit. T’ai chi practice seeks to bring the forces of yin(negative energy) and yang (positive energy) into balance, allowing the individual to achieve optimal health and prevention of disease. Meditation, mental concentration, breathing, and slow, graceful movements are used to transmit chi (vital energy) throughout the body. While it is considered a martial art, it is important to make the distinction that t’ai chi utilizes flexibility and mental concentration over strength to beat an opponent. Movement of the trunk and limbs is coordinated with breathing and mental concentration to move chi through distinct channels in the body. The t’ai chi form includes arm raising and lowering along with weight shifts from one leg to another, steps, and rotation of the torso in combinations and sequences. These controlled, nonimpact movements displace the individual’s center of gravity, making it extremely beneficial for the older population.115
Numerous sources have documented the effectiveness of t’ai chi exercise in improving balance and preventing falls with older individuals. T’ai chi has been found to have a measurable physiological effect on cardiorespiratory function, mental control, immune capacity, and fall prevention because of improvements in muscle strength, flexibility, and balance.120,121 Despite the slow, rhythmic pace of moves, t’ai chi is a moderate-intensity aerobic exercise that has been shown to improve circulatory status in elderly individuals.122,123 Lai and colleagues124 found that elderly t’ai chi practitioners showed a significant improvement in ![]() O2 uptake, concluding that t’ai chi could be practiced as a means for delaying the decline in cardiorespiratory function associated with aging. In a randomized trial, Yong et al. found t’ai chi exercise routines to be comparable with moderate-intensity aerobic exercise programs in reducing blood pressure in previously sedentary, hypertensive, elderly individuals.125 It has also been demonstrated that t’ai chi exercise enhances cardiorespiratory function and improves functional outcomes following coronary artery bypass surgery.126 Research has demonstrated improved quality of life measures for elders and debilitated populations, leading to the inclusion of t’ai chi instruction in elder care settings and cardiac rehabilitation programs.
O2 uptake, concluding that t’ai chi could be practiced as a means for delaying the decline in cardiorespiratory function associated with aging. In a randomized trial, Yong et al. found t’ai chi exercise routines to be comparable with moderate-intensity aerobic exercise programs in reducing blood pressure in previously sedentary, hypertensive, elderly individuals.125 It has also been demonstrated that t’ai chi exercise enhances cardiorespiratory function and improves functional outcomes following coronary artery bypass surgery.126 Research has demonstrated improved quality of life measures for elders and debilitated populations, leading to the inclusion of t’ai chi instruction in elder care settings and cardiac rehabilitation programs.
Pilates
Pilates training, created by Joseph H. Pilates (born in Germany, 1880–1967), has become a rapidly growing trend in the United States. Originally designed to aid wounded soldiers during World War I, pilates exercises focus on core strength, flexibility, breathing, and mental concentration to execute rhythmic movements with precision and control. Introduced to the United States in 1926, pilates exercise was firmly embraced by the performing arts community for the rehabilitation and fitness training of dancers. The original system referred to as contrology was described by pilates as “the science and art of coordinated body–mind–spirit development through natural movements under strict supervision of the will.”127 These original works have been interpreted by many sources worldwide, including the founders of Polestar Education (a Pilates education company specializing in rehabilitation) who describe six basic principles of pilates exercise as follows: breathing; axial elongation/core control; organization of the head, neck, and shoulders; spine articulation; alignment of the extremities and spine; and movement integration.128 The expansive series of exercise includes both mat work and techniques performed on apparatus specifically designed to accommodate all fitness levels and ages. Despite its reputation for providing a strenuous core and full body workout, the spring-based apparatus can easily be adjusted to assist extremity motion in the early stages of rehabilitation. Pilates exercise proposes to improve strength, flexibility, alignment, and circulation in enthusiasts. Workout intensity strongly relies on the expertise of the instructor and the setting (one-to-one or group session). It should be noted that careful attention should be paid to the background of the instructor, as Pilates certification programs vary significantly in their rigor. Similar to many complementary practices, pilates lacks scientific evidence to support its efficacy.
SUMMARY
This chapter on exercise physiology for the well individual has been divided into basic exercise physiology and applied physiology. The discussion of basic exercise physiology has described the strong link between fuel substrates, metabolic pathways, and exercise states. The section on applied exercise physiology has focused on measurement of body fat, maintenance of physical fitness, principles of endurance training, and exercise prescription. An understanding of both domains will lay a proper foundation on which to evaluate abnormal exercise responses in patients with cardiovascular and pulmonary disease.
In order to administer an effective treatment session, the physical therapist must make constant and ongoing comparisons between two sets of data. On the one hand, the patient’s response to an exercise regimen must be compared to that same patient’s physiological data acquired during the resting state. On the other hand, patient information obtained during exercise must be compared to normative data derived from healthy normal subjects in order to determine whether the response to exercise is indeed “normal.” This chapter has described the normal response to exercise. Future chapters will describe abnormal responses to exercise and link those responses to disease states and treatment regimens.
Patients receive optimal care when they are neither under-treated nor overtreated. Exercise “volume” must be sufficient to provide an overload and provoke a cardiovascular and pulmonary response, but not enough to endanger the patient’s health and well-being. This chapter’s sections on endurance training and exercise prescription have described a well-standardized approach that can be used to develop an effective exercise prescription and produce a training effect. Clearly, however, such a standardized approach must be adjusted to fit individuals with heart and lung disease. Future chapters will provide the reader with guidelines for the application of these principles to the management of patients with cardiovascular and pulmonary impairments and functional limitations.
Heads Up!
This chapter includes a CD-ROM activity.
REFERENCES
1.Weyer C, Snitker S, Rising R, et al. Determinants of energy expenditure and fuel utilization in man: effects of body composition, age, sex, ethnicity, and glucose tolerance in 916 subjects. Int J Obes. 1999;23:715-722.
2.Nieman DC, Trone GA, Austin MD. A new handheld device for measuring resting metabolic rate and oxygen consumption. J Am Diet Assoc. 2003;103(5):588-592.
3.Goran MI. Energy expenditure and obesity. Med Clin North Am. 2000;84:347-362.
4.DeLorenzo A, Tagliabue A, Andrioli A, et al. Measured and predicted resting metabolic rate in Italian males and females, aged 18–59 y. Eur J Clin Nutr. 2001;55:208-214.
5.Taylor RW, Gold E, Manning P, Goulding A. Gender differences in body fatness content are present well before puberty. Int J Obes Relat Metab Disord. 1997;21:1082-1084.
6.Klausen B, Toubro S, Astrup A. Age and sex effects on energy expenditure. Am J Clin Nutr. 1997;65(4):895-907.
7.Muller B, Merk S, Burgi U, et al. Calculating the basal metabolic rate and severe and morbid obesity. Schweiz Rundsch Med Prax. 2001;90(45)1955-1963.
8.Marra M, Polito A, DeFilippo E, et al. Are the general equations to predict BMR applicable to patients with anorexia nervosa? Eat Weight Disord. 2002;7(1):53-59.
9.Ravussin E et al. Determination of 24-hour energy expenditure in man. J Clin Invest. 1986;78:1568.
10.Altman P, Dittmer D. Metabolism. Bethesda, MD: Federation of American Societies for Experimental Biology; 1968.
11.Bemben M et al. Age-related patterns in body composition for men aged 20–79 yr. Med Sci Sports Exerc. 1995;27:264.
12.Poehlman E et al. Endurance exercise in aging humans: effects on energy metabolism. Exerc Sport Sci Rev. 1994;22:751.
13.Wilmore J, Behnke A. An anthropometric estimation of body density and lean body weight in young men. J Appl Physiol. 1969;27(1):25-31.
14.Katch F, Behnke A, Katch V. Estimation of body fat from skin-folds and surface area. Hum Biol. 1979;51:411-424.
15.Krauss RM, Eckel RH, Howard B; American Heart Association. American Heart Association Dietary Guidelines. Revision 2000: A Statement for Health Care Professionals from the Nutrition Committee of the American Heart Association. Stroke. 2000;31(11):2751-2766.
16.Kirwin J et al. A moderate glycemic meal before endurance exercise can enhance performance. J Appl Physiol. 1998;84:53.
17.Walton P, Rhodes E. Glycaemic index and optimal performance. Sports Med. 1997;33:164.
18.Aro A et al. Stearic acid, trans fatty acids, and dietary fat: effects on serum and lipoprotein lipids, apolipoproteins, lipoprotein(a), and lipid transfer proteins in healthy subjects. Am J Clin Nutr. 1997;65:1419.
19.ASCN/AIN Task Force on Trans Fatty Acids. Position paper on trans fatty acids. Am J Clin Nutr. 1996;63(5):663-670.
20.Hu F et al. Dietary fat intake and the risk of coronary heart disease in women. N Engl J Med. 1997;337:1491.
21.Willett W, Ascherio A. Trans fatty acids: are the effects only marginal? Am J Public Health. 1994;84:722.
22.National Cholesterol Education Program. Second report of the Expert Panel on the Detection, Evaluation, and Treatment of High Blood Cholesterol in Adults (Adult Treatment Panel II). Bethesda, MD: National Institutes of Health and National Heart, Lung, and Blood Institute; 1993. NIH publication 93-3095.
23.Gaziano J et al. Moderate alcohol intake, increased levels of high density lipoprotein and its subfractions, and decreased risk of myocardial infarction. N Engl J Med. 1993;329:1829.
24.Burtis C, Ashold E. Tietz Textbook of Clinical Chemistry. 3rd ed. Philadelphia, PA: WB Saunders; 1999.
25.Kukita H, Hiwada K, Kokubu T. Serum apolipoprotein AI, AII, and B levels and their discriminative values in relatives of patients with coronary artery disease. Atherosclerosis. 1984;51:261-267.
26.Maciejko J, Holmes D, Kottke B, et al. Apolipoprotein AI as a marker of angiographically assessed coronary artery disease. N Engl J Med. 1983;309:385-389.
27.Naito H. The association of serum lipids, lipoproteins and apolipoproteins with coronary artery disease assessed by coronary arteriography. Ann N Y Acad Sci. 1985;454:230-238.
28.McArdle WD, Katch FI, Katch VL. Exercise Physiology: Energy, Nutrition, and Human Performance. Baltimore, MD: Lippincott Williams & Wilkins; 2001:188.
29.Corbin C, Lidsey R, Welk G. Concepts of Physical Fitness: Active Lifestyles for Wellness. 10th ed. New York: McGraw-Hill; 2000.
30.Stein R, Michielli D, Glantz M, et al. Effects of different exercise training intensities on lipoprotein cholesterol fractions in healthy middle aged men. Am Heart J. 1990;119:277-282.
31.American Heart Association (AHA). An eating plan for healthy Americans. 2008. http://www.heart.org/presenter.jtml?identifier-1088. Accessed March 8, 2010. cholesterol/do_plan.html. Accessed December 21, 2009.
32.Hill J, Peters J, Reed G, et al. Nutrient balance in humans: effects of diet composition. Am J Clin Nutr. 1991;54:10-17.
33.Golay A, Allaz A, Morel Y, et al. Similar weight loss in low and high-carbohydrate diets. Am J Clin Nutr. 1996;63:174-178.
34.St Jeor S, Ashley J. Dietary Strategies: issues of diet composition. In: Fletcher G, Grundy S, Hayman L, eds. Obesity: Impact on Cardiovascular Disease. Armonk, NY: Futura Publishing Company Inc; 1999:233-246.
35.Harats D et al. Citrus fruit supplementation reduces lipoprotein oxidation in young men ingesting a diet high in saturated fat: presumptive evidence for an interaction between vitamins C and E in vivo. Am J Clin Nutr. 1998;67:240.
36.Hodis H et al. Serial coronary angiographic evidence that antioxidant vitamin intake reduces progression of coronary artery disease. JAMA. 1995;273:1849.
37.Landry GL. Heat injuries. In: Kliegman RM, Behrman RE, Jenson HB, Stanton BF, eds. Nelson Textbook of Pediatrics. 18th ed. Philadelphia, PA: WB Saunders–Elsevier; 2007:chap 6.
38.Nerbrand C, Agreus L, Lenner R, et al. The influence of calcium and magnesium in drinking water and diet on cardiovascular risk factors in individuals living in hard and soft water areas with differences in cardiovascular mortality. BMC Public Health. 2003;3(1):21.
39.Mayo Clinic. Water: How much should you drink every day? http://www.mayoclinic.com/health/water/NU00283. Accessed December 21, 2009.
40.Mayo Clinic. Mayo Foundation for Medical Education and Research. http://www.mayoclinic.org. Accessed December 21, 2009.
41.Sacco R et al. The protective effect of moderate alcohol consumption on ischemic stroke. JAMA. 1999;28:913.
42.Williams PJ. Interactive effects of exercise, alcohol, and vegetarian diet on coronary artery disease risk factors in 9242 runners: the National Runners Health Study. Am J Clin Nutr. 1997;66:1197.
43.Pierson T. Nutrition Committee of the American Heart Association. AHA Medical Scientific Statement: Alcohol. Circulation. 1996;94:3023-3025.
44.Poehlman E, Melby C, Badylak S. Relation of age and physical exercise status on metabolic rate in younger and older healthy men. J Gerontol. 1991;46:B54-B58.
45.Goran M, Poehlman E. Total energy expenditure and energy requirements in healthy elderly persons. Metabolism. 1992;41:744.
46.Bray GA, Ryan DH, Harsha DW. Diet, weight loss and cardiovascular disease prevention. Curr Treat Options Cardiovasc Med. 2003;5(4):259-269.
47.Guerra S, Sherrill DL, Bobadilla A, et al. The relation of body mass index to asthma, chronic bronchitis, and emphysema. Chest. 2002;122(4):1256-1263.
48.Sinkov V, Cymet T. Osteoarthritis: understanding the patho-physiology, genetics, and treatments. J Natl Med Assoc. 2003;95(6):475-482.
49.Morricone L, Donati C, Hassan T, et al. Relationship of visceral fat distribution to angiographically assessed coronary artery disease: results in subjects with or without diabetes or impaired glucose tolerance. Nutr Metab Cardiovasc Dis. 2002;12(5):275-283.
50.Kendall DM, Sobel BE, Coulston AM, et al. The insulin resistance syndrome and coronary artery disease. Coron Artery Dis. 2003;14(4):335-348.
51.National Institutes of Health. Clinical Guidelines on the Identification, Evaluation, and Treatment of Overweight and Obesity in Adults. Obes Res. 1998;6(suppl 2):51S-209S.
52.Expert Panel. Executive summary of the clinical guidelines on the identification, evaluation, and treatment of overweight and obesity in adults. Arch Intern Med. 1998;158:1855-1867.
53.Behnke A, Wilmore J. Evaluation and Regulation of Body Build and Composition. Upper Saddle River, NJ: Prentice Hall; 1974.
54.Robergs R, Roberts S. Estimating Body Composition. Exercise Physiology: Exercise, Performance and Clinical Applications. St Louis, MO: Mosby; 1997.
55.Siri WE. Body composition from fluid spaces and density: analysis of methods. 1961. Nutrition. 1993;9(5):480-491; discussion 480, 492.
56.Brozek J, Grande F, Anderson J, et al. Densitometric analysis of body composition: revision of some quantitative assumptions. Ann N Y Acad Sci. 1963;110:113-140.
57.Heymsfield SB et al. Body composition of humans: comparison of two improved four component models that differ in expense, technical complexity, and radiation exposure. Am J Clin Nutr. 1991;52:52.
58.Heyward VH, Stolarczyk LM. Applied Body Composition Assessment. Champaign, IL: Human Kinetics; 1996.
59.Roche AF. Anthropometry and ultrasound. In: Roche AF, Heymsfied SB, Lohman TG, eds. Human Body Composition. Champaign, IL: Human Kinetics; 1996:167-198.
60.Romijn J et al. Regulation of endogenous fat and carbohydrate metabolism in relation to exercise intensity and duration. Am J Physiol. 1993;265:E380.
61.Wolfe R. Fat metabolism in exercise. Adv Exp Med Biol. 1998;441:147-156.
62.Foss M, Keteyian S. Fox’s Physiological Basis for Exercise and Sport. 6th ed. Boston, MA: WCB McGraw-Hill; 1998.
63.Thorstenson A, Sjodin B, Karlsson J. Enzyme activities and muscle strength after “sprint training” in man. Acta Physiol Scand. 1975;94:313-318.
64.Karlsson J, Nordesjo L, Jorfeldt L, et al. Muscle lactate, ATP, and CP levels during exercise after physical training in man. J Appl Physiol. 1972;33(2):199-203.
65.Weltman A et al. Reliability and validity of a continuous incremental treadmill protocol for the determination of lactate threshold, fixed blood lactate concentrations and ![]() O2max. Int J Sports Med. 1990;11:26.
O2max. Int J Sports Med. 1990;11:26.
66.Midorikawa J, Hida W, Taguchi O, et al. Lack of ventilatory threshold in patients with chronic obstructive pulmonary disease. Respiration. 1997;64:76-80.
67.Gastin R. Energy system interaction and relative contribution during maximal exercise. Sports Med. 2001;31(10):725-741.
68.Tanaka H, Monahan KD, Seals DR. Age-predicted maximal heart rate revisited. J Am Coll Cardiol. 2001;37:153-156.
69.Kitamura K, Jorgensen CR, Gobel FL, Taylor HL, Wang Y. Hemodynamic correlates of myocardial oxygen consumption during upright exercise. J Appl Physiol. 1972;32:516-522.
70.Kim KT, Choi SW, Takahashi K, Kurokawa T, Yamasaki M. Change in double product during stepwise incremental exercise. J Physiol Anthropol Appl Human Sci. 2003;22(3):143-147.
71.Hui S, Jackson A, Wier L. Development of normative values for resting and exercise rate pressure product. Med Sci Sports Exerc. 2000;32:1520-1527.
72.Guyton A, Jones C, Coleman T. Circulatory Physiology: Cardiac Output and Its Regulation. 2nd ed. Philadelphia, PA: WB Saunders; 1973.
73.Bloomer R. Does resistance training stimulate cardiac muscle hypertrophy? Strength Cond J. 2003;25(2):7-15.
74.George K, Batterham A, Jones B. Echocardiographic evidence of concentric left ventricular enlargement in female weight lifters. Eur J Appl Physiol. 1998;79:88-92.
75.Dickerman R, Schaller F, McConathy. Left ventricular wall thickening does occur in elite power athletes with or without anabolic steroid use. Cardiology. 1998;90:145-148.
76.Pelliccia A, Maron B. Outer limits of the athlete’s heart, the effect of gender, and the relevance to the differential diagnosis with primary cardiac diseases. Cardiol Clin. 1997;15(3):381-396.
77.Link M, Homoud M, Wang P, et al. Cardiac arrhythmias in the athlete: the evolving role of electrophysiology. Curr Sports Med Rep. 2002;1(2):75-85.
78.Firoozi S, Sharma S, McKenna W. Risk of competitive sport in young athletes. Heart. 2003;89(7):710-714.
79.Seto C. Preparticipation cardiovascular screening. Clin Sports Med. 2003;22(1):23-35.
80.Foster C, Jackson A, Pollock M, et al. Generalized equations for predicting functional capacity from treadmill performance. Am Heart J. 1984;107:1229-1234.
81.McConnell T, Clark B. Prediction of maximal oxygen consumption during handrail-supported treadmill exercise. J Cardiopulm Rehabil. 1987;7:324-331.
82.Cooper KH. A means of assessing maximal oxygen intake. JAMA. 1968;203(3):135-138.
83.American College of Sports Medicine. ACSM’s Guidelines for Exercise Testing and Prescription. 8th ed. Philadelphia, PA: Lippincott Williams & Wilkins; 2010.
84.Astrand PO, Ryhming I. A nomogram for calculation of aerobic capacity (physical fitness) from pulse rate during submaximal work. J Appl Physiol. 1954;7:218-221.
85.Golding LA. YMCA Fitness Testing and Assessment Manual. Champaign, IL: Human Kinetics; 1989.
86.U.S. Department of Health and Human Services. Physical Activity and Public Health: a Report of the Surgeon General. Atlanta, GA: U.S. Department of Health and Human Services, Centers for Disease Control and Prevention, National Center for Chronic Disease Prevention and Health Promotion; 1996.
87.Franklin BA, Whaley MH, Howley ET; American College of Sports Medicine. ACSM’S Guidelines for Exercise Testing and Prescription. 6th ed. Philadelphia, PA: Lippincott Williams & Wilkins; 2000.
88.Pate RR, Pratt M, Blair SN, et al. Physical activity and public health: a recommendation from the Centers for Disease Control and Prevention and the American College of Sports Medicine. JAMA. 1995;273:402-407.
89.Franklin BA. Diagnostic and functional exercise testing: test selection and interpretation. J Cardiovasc Nurs. 1995;10:8-29.
90.Franklin BA. Exercise testing, training and arm ergometry. Sports Med. 1985;2:100-119.
91.Franklin BA, Vander L, Wrisley D, et al. Aerobic requirements of arm ergometry: implications for exercise testing and training. Phys Sportsmed. 1983;11:81-90.
92.MacDougall JD, Tuxen D, Sale DG, et al. Arterial blood pressure response to heavy resistance exercise. J Appl Physiol. 1985;58:785-790.
93.Kelley GA, Kelley KS. Progressive resistance exercise and resting blood pressure: a meta-analysis of randomized controlled trials. Hypertension. 2000;35:838-843.
94.National Strength and Conditioning Association. Essentials of Strength Training and Conditioning. 2nd ed. Champaign, IL: Human Kinetics; 2000.
95.Bilcheck H. Epiphyseal injuries in young athletes. NSCA J. 1989;11(5):60-65.
96.Sparling P, Cantwell J. Strength training guidelines for cardiac patients. Phys Sportsmed. 1989;17(3):190-196.
97.MacDougall JD, McKelvie RS, Moroz DE, et al. Factors affecting blood pressure during heavy weight lifting and static contractions. J Appl Physiol. 1992;73:1590-1597.
98.Hass CJ, Garzarella L, de Hoyos D, et al. Single versus multiple sets in long-term recreational weightlifters. Med Sci Sports Exerc. 2000;32:235-242.
99.Starkey DB, Pollock ML, Ishida Y, et al. Effect of resistance training volume on strength and muscle thickness. Med Sci Sports Exerc. 1996;28:1311-1320.
100.Faigenbaum A, Pollock ML, Ishida Y. Prescription of resistance training for health and disease. Med Sci Sports Exerc. 1999;31:38-45.
101.Saltin R, Blomqvist G, Mitchell JH, et al. Response to sub-maximal and maximal exercise after bed rest and training. Circulation. 1968;38(suppl 7):1-78.
102.Goldring L, Meyers C, Sinning W, eds. Y’s Way to Physical Fitness. 3rd ed. Champaign, IL: Human Kinetics; 1989.
103.American College of Sports Medicine Position Stand. The recommended quantity and quality of exercise for developing and maintaining cardiorespiratory and muscular fitness, and flexibility in healthy adults. Med Sci Sports Exerc. 1998;30(6):975-991.Review.
104.McArdle D, Katch FI, Katch VL, eds. Exercise Physiology. 4th ed. Philadelphia, PA: Lea & Febiger; 1996.
105.Pandolf KB, Sawka MN, Gonzalez RR, eds. Human Performance Physiology and Environmental Medicine at Terrestrial Extremes. Traverse City, MI: Cooper; 1988.
106.American College of Sports Medicine. ACSM’s Resource Manual for Guidelines for Exercise Testing and Prescription. 5th ed. Baltimore, MD: Lippincott Williams & Wilkins; 2006.
107.Wyndham CH, Strydom NB, Benade JS, et al. Heat stroke risk in unacclimatized and acclimatized men of different maximum oxygen intakes working under hot humid conditions. Chamber of Mines Research Report 12/72. Johannesburg, South Africa: Chamber of Mines of South Africa; 1972.
108.Plog BA, ed. Fundamentals in Industrial Hygiene. 5th ed. Itasca, IL: National Safety Council; 2002.
109.Hegnauer AH, ed. Biomedicine Problems of High Terrestrial Elevations. Natick, MA: US Army Research Institute of Environmental Medicine; 1969:204-222.
110.Fulco CS. Maximal and submaximal exercise performance at altitude. Aviat Space Environ Med. 1998;69:793-801.
111.Williford HN, Scharff-Olson M, Blessing DL. The physiological effects of aerobic dance: a review. Sports Med. 1989;8:335-345.
112.Make life your playground. http://www.bosu.com/scripts/cgiip.exe/WService BOSU/story.html. Accessed March 8, 2010.
113.Bryant CX, Wenson J, Peterson JA. Safe and enjoyable group cycling for your members. Fit Man. 2001;17:38-42.
114.Sherman RM. The indoor cycling revolution. IDEA Today. 1997;15:30-33, 35-36, 38-39.
115.Davis CM. Complementary Therapies in Rehabilitation: Evidence for Efficacy in Therapy, Prevention, and Wellness. 2nd ed. Thorofare, NJ: Slack Inc; 2004.
116.Feuerstein G. The Yoga Tradition. Prescott, AZ: Hohm Press; 1998.
117.Birkel DA, Edgren L. Hatha yoga: improved vital capacity of college students. Altern Ther Health Med. 2000;6(6):55-63.
118.Bowman AJ, Clayton RH, Murray A, Reed JW, Subhan MM, Ford GA. Effects of aerobic exercise training and yoga on the baroreflex in healthy elderly persons. Eur J Clin Invest. 1997;27(5):443-449.
119.Tandon MK. Adjunct treatment with yoga in chronic severe airways obstruction. Thorax. 1978;33(4):514-517.
120.Li JX, Hong Y, Chan KM. T’ai chi: physiological characteristics and beneficial effects on health. Br J Sports Med. 2001;35(3):148-156.
121.Hong Y, Li JX, Robinson PD. Balance control, flexibility, and cardiorespiratory fitness among older t’ai chi practitioners. Br J Sports Med. 2000;34(1):29-34.
122.Wang Js, Lan C, Wong MK. T’ai chi chuan training to enhance microcirculatory function in healthy elderly men. Arch Phys Med Rehabil. 2001;82(9):1176-1180.
123.Lai JS, Wong MK, Lan C, Chong CK, Lien IN. Cardiorespira-tory responses of t’ai chi ch’uan practitioners and sedentary subjects during cycle ergometer. J Formos Med Assoc. 1993;92(10):894-899.
124.Lai JS, Lan C, Wong MK, Teng SH. Two-year trends in cardiorespiratory function among older t’ai chi ch’uan practitioners and sedentary subjects. J Am Geriatric Soc. 1995;43(11): 1222-1227.
125.Young Dr, Appel LJ, Jee S, Miller ER. The effects of aerobic exercise and t’ai chi on blood pressure in older people: results of a randomized trial. J Am Geriatr Soc. 1999;47(3):277-284.
126.Lan C, Chen SY, Lai JS, Wong MK. The effect of t’ai chi on cardiorespiratory function in patients with coronary artery bypass surgery. Med Sci Sports Exerc. 1999;31(5):634-638.
127.Gallagher SP, Kryzanowska R. The Pilates Method of Body Conditioning. Philadelphia, PA: BainBridge Books; 1999.
128.Anderson BD. Polestar Education Instruction Manual: Polestar Approach to Movement Principles. Coral Gables, FL: Polestar Pilates Education, LLC; 2001.