An action potential is a transient depolarization triggered by a depolarization beyond a threshold
The change in membrane potential that occurs during an action potential can be accurately measured by recording Vm with an intracellular microelectrode. Figure 7-1A is a diagram illustrating various features of a typical action potential recorded from a nerve or muscle cell stimulated with an electrode. Alternatively, for cells that are not easily accessible, such as brain neurons, one can induce expression of light-activated ion channels, such as channelrhodopsins from unicellular algae, and use light to change Vm experimentally. ![]() N7-1 If the depolarizing stimulus causes Vm to become more positive than a threshold voltage, the depolarization triggers an action potential. The initial depolarizing (positive-going) phase of an action potential consists of a rapid and smooth increase in Vm from the negative resting potential to a maximum positive value that typically lies between +10 and +40 mV. This sharp rise in Vm to the peak voltage of the action potential is then followed by a slower repolarizing (negative-going) phase. The part of the action potential that lies above 0 mV is called the overshoot. As we will see, the time course and shape of the repolarization phase vary considerably among different excitable tissues and cells. The repolarization phase may lead directly back to Vrest, or it may undershoot and give rise to a voltage minimum that is more negative than Vrest before relaxing back to Vrest. Such an undershoot is an example of an afterhyperpolarization.
N7-1 If the depolarizing stimulus causes Vm to become more positive than a threshold voltage, the depolarization triggers an action potential. The initial depolarizing (positive-going) phase of an action potential consists of a rapid and smooth increase in Vm from the negative resting potential to a maximum positive value that typically lies between +10 and +40 mV. This sharp rise in Vm to the peak voltage of the action potential is then followed by a slower repolarizing (negative-going) phase. The part of the action potential that lies above 0 mV is called the overshoot. As we will see, the time course and shape of the repolarization phase vary considerably among different excitable tissues and cells. The repolarization phase may lead directly back to Vrest, or it may undershoot and give rise to a voltage minimum that is more negative than Vrest before relaxing back to Vrest. Such an undershoot is an example of an afterhyperpolarization.
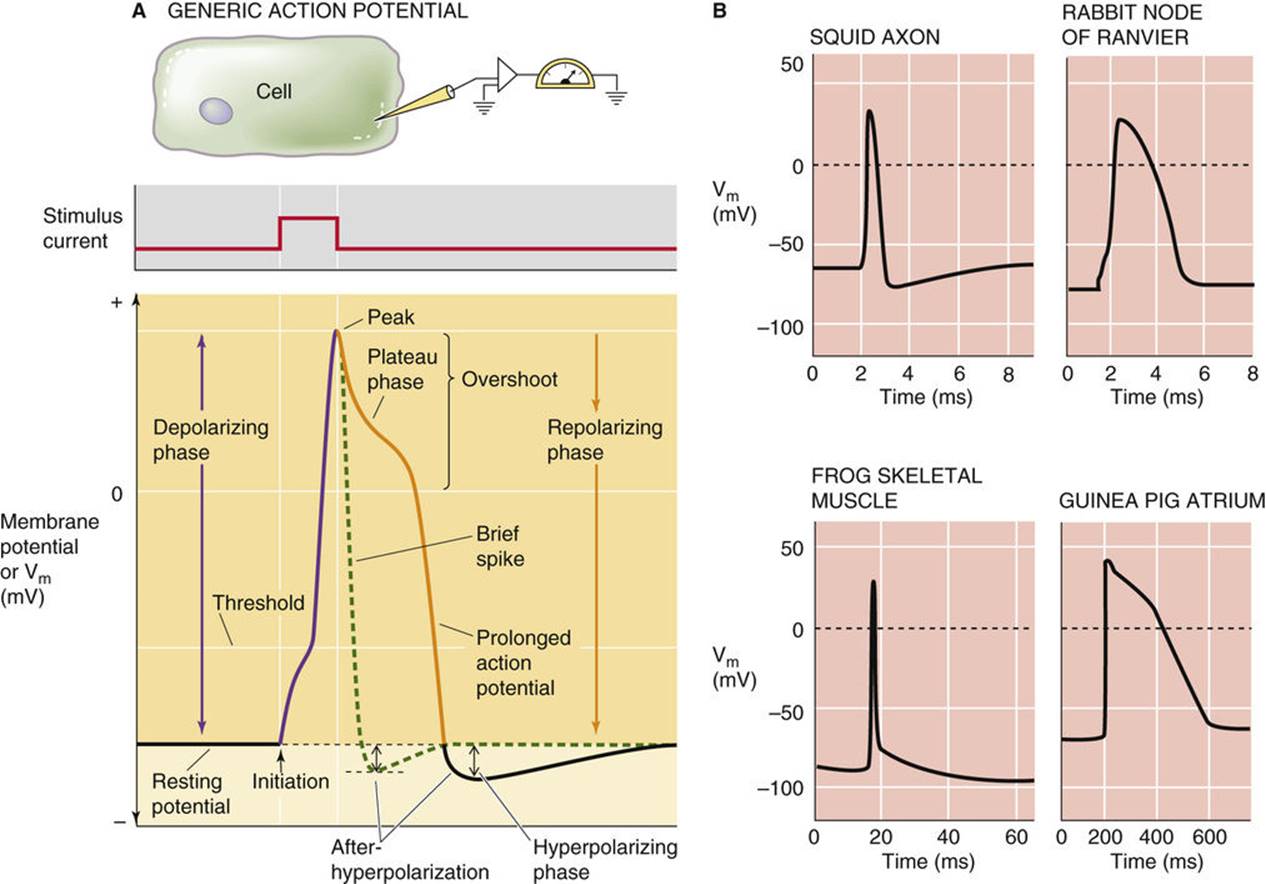
FIGURE 7-1 The action potential.
N7-1
Controlling Membrane Potential with Channelrhodopsins
Contributed by Ed Moczydlowski
An exciting new optical technique involves the use of membrane proteins called channelrhodopsins (ChRs) discovered in single-celled algae such as Chlamydomonas reinhardtii. ChR is homologous to the rhodopsin protein of mammalian photoreceptor cells except that it functions as a light-activated ion channel. Expression of engineered ChR in mammalian neurons allows the Vm of the transfected neurons to be changed by simple illumination with light of an appropriate wavelength absorbed by the ChR. Thus, ChR and related light-gated channels can be used as optical switches to turn on or off the electrical activity of specific cells in various tissues such as the brain. This method has initiated a new field called optogenetics which enables the function of individual cells in the nervous system to be studied by observing the physiological response to light activation in living transgenic animals. Someday it may be possible to control arrhythmia in a diseased heart with light or to restore visual perception to a defective retina with the use of such approaches.
References
Bamann C, Nagel G, Bamberg E. Microbial rhodopsins in the spotlight. Curr Opin Neurobiol. 2010;20:610–616.
Boyden ES, Zhang F, Bamberg E, et al. Millisecond-timescale, genetically targeted optical control of neural activity. Nat Neurosci. 2005;8:1263–1268.
Hegemann P, Möglich A. Channelrhodopsin engineering and exploration of new optogenetic tools. Nat Methods. 2011;8:39–42.
The threshold, amplitude, time course, and duration of the action potential depend on the following factors:
1. The gating (opening and closing) and permeability properties of specific types of ion channels—these properties depend on both Vm and time.
2. The intracellular and extracellular concentrations of the ions that pass through these channels, such as Na+, K+, Ca2+, and Cl−.
3. Membrane properties such as capacitance, resistance, and the geometry of the cell.
The shape of the action potential in a given cell reflects the specialized functions of that cell. For example, the brief action potentials of a nerve axon permit rapid signaling, whereas the prolonged, repetitive action potentials of cardiac and certain types of smooth-muscle cells mediate the slower, rhythmic contractions of these tissues. Figure 7-1B compares action potentials recorded from an invertebrate nerve fiber (unmyelinated squid axon), a vertebrate nerve fiber (myelinated rabbit axon), a skeletal muscle fiber, and a cardiac atrial myocyte. This comparison illustrates the diversity in the duration and shape of the repolarizing phase of action potentials. The shape of the action potential is subject to hormonal modulation in certain cell types. As one example, the peptide hormone endothelin, produced by vascular endothelial cells, shortens the duration of the action potential when it is applied to a guinea pig atrial myocyte. Modulation of the shape and frequency of action potentials occurs by various biochemical regulatory mechanisms that affect the function of ion channels.
In contrast to an action potential, a graded response is proportional to stimulus intensity and decays with distance along the axon
Not all electrical activity in nerve or muscle cells is characterized by an all-or-none response. When we apply a small square pulse of hyperpolarizing current to a cell membrane, Vm gradually becomes more negative and then stabilizes (Fig. 7-2A). In such an experiment, the observed change in Vm approximates an exponential time course, with a time constant (see p. 151) that is determined by the product of membrane resistance and capacitance (τ = RC). Figure 7-2A also shows that progressively greater hyperpolarizing currents produce progressively larger Vm responses, but the time constant is always the same. The size of the graded voltage change (i.e., the steady-state ΔVm) is proportional to the strength of the stimulus (i.e., the current), in accord with Ohm's law.
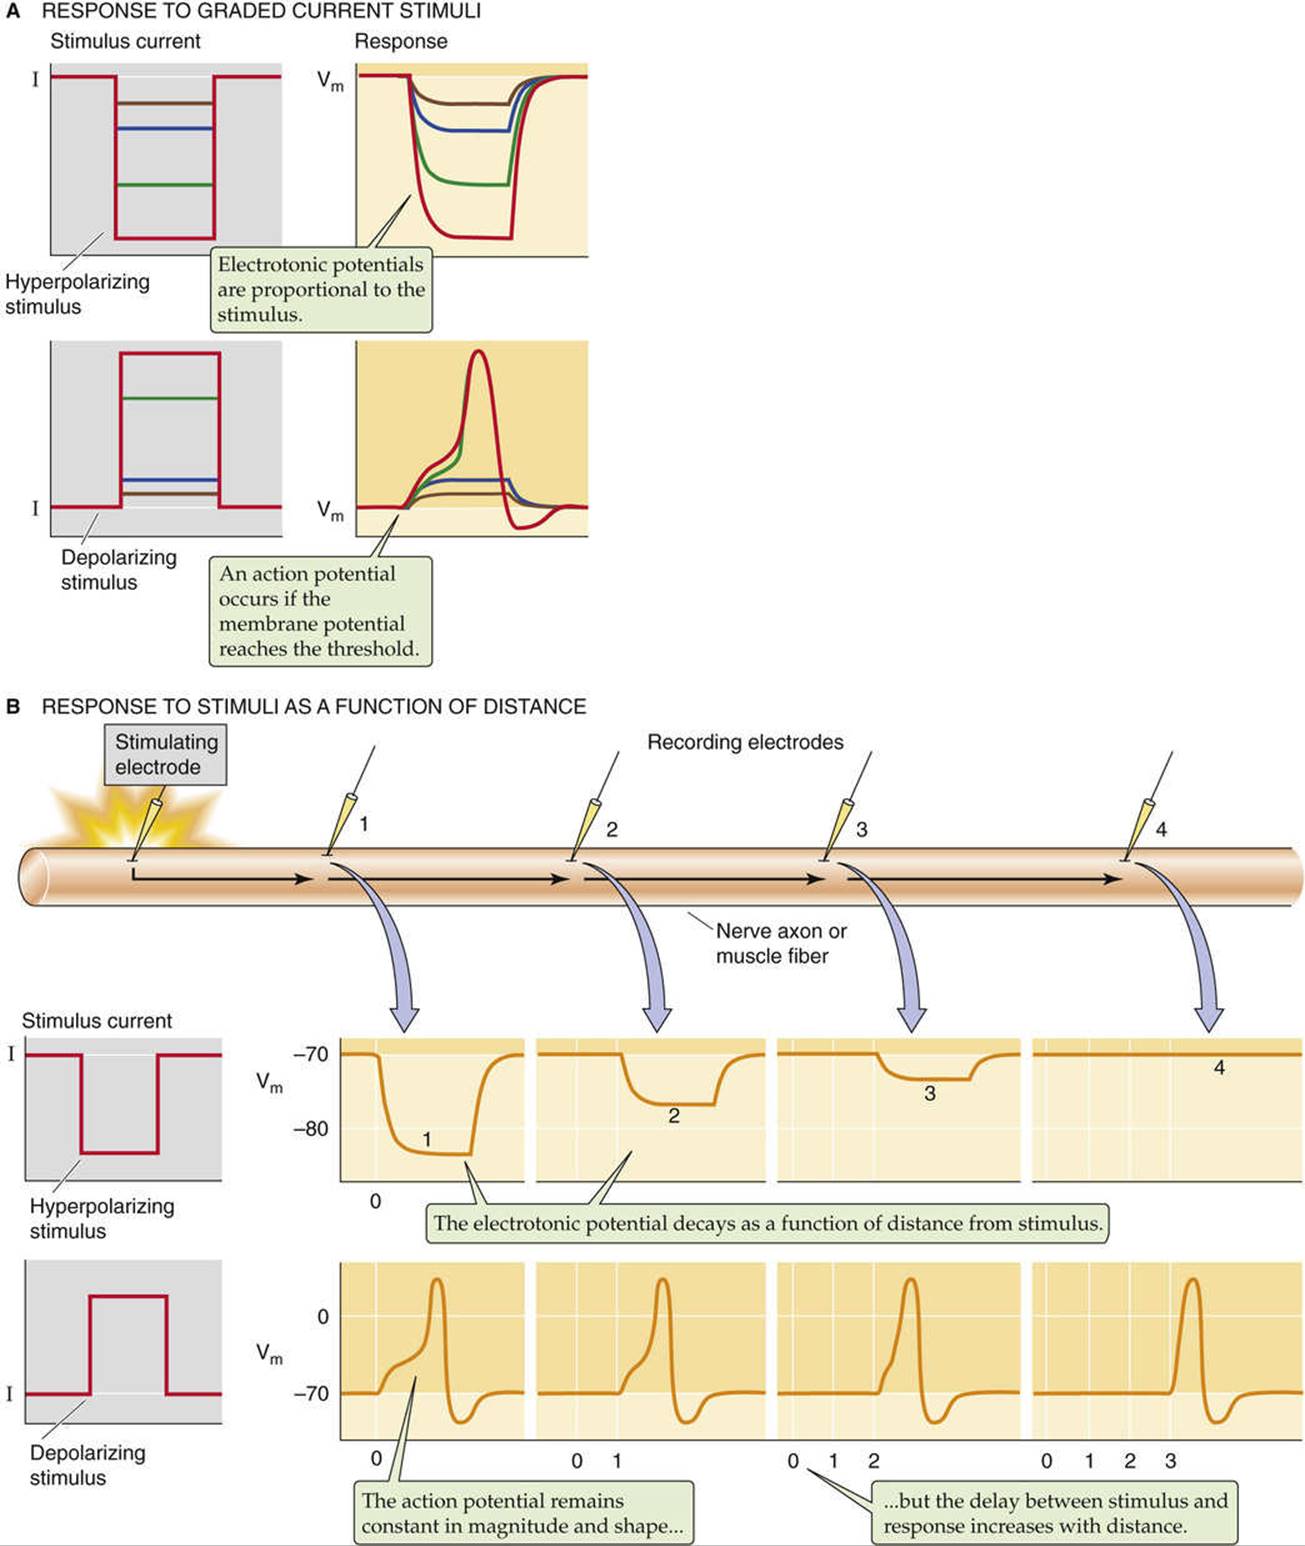
FIGURE 7-2 Basic properties of action potentials. A, The upper panels show four graded hyperpolarizing stimuli and the Vm responses. The lower panels show four graded depolarizing stimuli and the Vm responses. Note that the two largest stimuli evoke identical action potentials. B, A stimulating electrode injects current at the extreme left of the cell. Four recording electrodes monitor Vm at equidistant sites to the right. If the stimulus is hyperpolarizing, the graded Vm responses decay with distance from the stimulus site. If the stimulus is depolarizing and large enough to evoke an action potential, a full action potential appears at each of the recording sites. However, the action potential arrives at the more distant sites with increasing delay.
If instead of imposing a hyperpolarizing stimulus we impose a small depolarizing stimulus, Vm changes to the same extent and with the same time course as we described for the hyperpolarizing stimulus, but in the opposite direction (see Fig. 7-2A). The size of ΔVm is also proportional to the size of the depolarizing stimulus—up to a point. If the membrane is excitable, a square-wave depolarization above the threshold triggers an action potential, or voltage spike. Smaller or subthreshold depolarizations do not elicit an action potential. Hyperpolarizations are always ineffective. Thus, both hyperpolarizations and subthreshold depolarizations behave like graded voltage changes. That is, the magnitude of a cell's voltage change increases proportionally with the size of the stimulus. Such graded responses can be seen in the response of certain cells to synaptic transmitters, to sensory stimuli (e.g., light), or, in the laboratory, to the injection of current into cells through a microelectrode.
Why do excitable cells exhibit threshold behavior? As Vm becomes progressively more and more positive, the gating process (i.e., transitions from closed to open states) of certain types of voltage-gated ion channels becomes activated. When Vm passes the threshold, opening of these voltage-gated channels initiates the runaway depolarization that characterizes the rising phase of the action potential. Thus, the firing of an action potential is a binary, all-or-none event; that is, the spike has a constant, nongraded voltage peak that occurs only if the depolarizing stimulus exceeds the threshold.
Thus far we have seen that graded responses and action potentials differ markedly from one another if we examine the cell at one particular site. However, graded responses and action potentials also behave very differently in the way that they spread along the membrane from the site of origin. Figure 7-2B illustrates how a graded hyperpolarizing response spreads along the axon of a neuron or along a skeletal muscle fiber. As the graded response spreads, its magnitude decays exponentially with the distance from the site of stimulation because of passive loss of electrical current to the medium. This decay is called electrotonic conduction. We see the same kind of electrotonic spread for a subthreshold, depolarizing stimulus. The electrotonic spread of graded responses is governed by the same physical principles that determine the spread of electrical current in an electrical cable. We briefly discuss cable theory at the end of this chapter.
Active propagation of an action potential signal is very different from the passive spread of a graded signal. In a healthy axon or muscle fiber, action potentials propagate at a constant velocity (up to ~130 m/s), without change in amplitude or shape. The amplitude of a propagating action potential does not diminish with distance, as would a graded, subthreshold response, because excitation of voltage-gated channels in adjacent regions of the excitable membrane progressively regenerates the original response. Because the action potential in a given nerve fiber propagates at a constant velocity, the time delay between the stimulus and the peak of the action potential increases linearly with distance from the point of the stimulus.
Excitation of a nerve or muscle depends on the product (strength × duration) of the stimulus and on the refractory period
In the preceding section, the importance of the magnitude (intensity) of the depolarizing stimulus emerged as a critical factor for firing of an action potential. However, the duration of the stimulus pulse is also important. A large stimulus is effective in triggering an action potential even at short duration, and a small stimulus may be effective at long duration (Fig. 7-3A). This strength-duration relationship arises because the same minimum electrical charge necessary to excite an action potential can come from a current that is either brief but large or prolonged but small. It is the product of strength and duration that determines excitability, and thus these two parameters are inversely related in their effectiveness. However, regardless of the stimulus strength, successful stimulation requires a minimum duration (vertical asymptote in Fig. 7-3A). Conversely, regardless of the stimulus duration, successful stimulation requires a minimum strength (horizontal asymptote in Fig. 7-3A). ![]() N7-2
N7-2
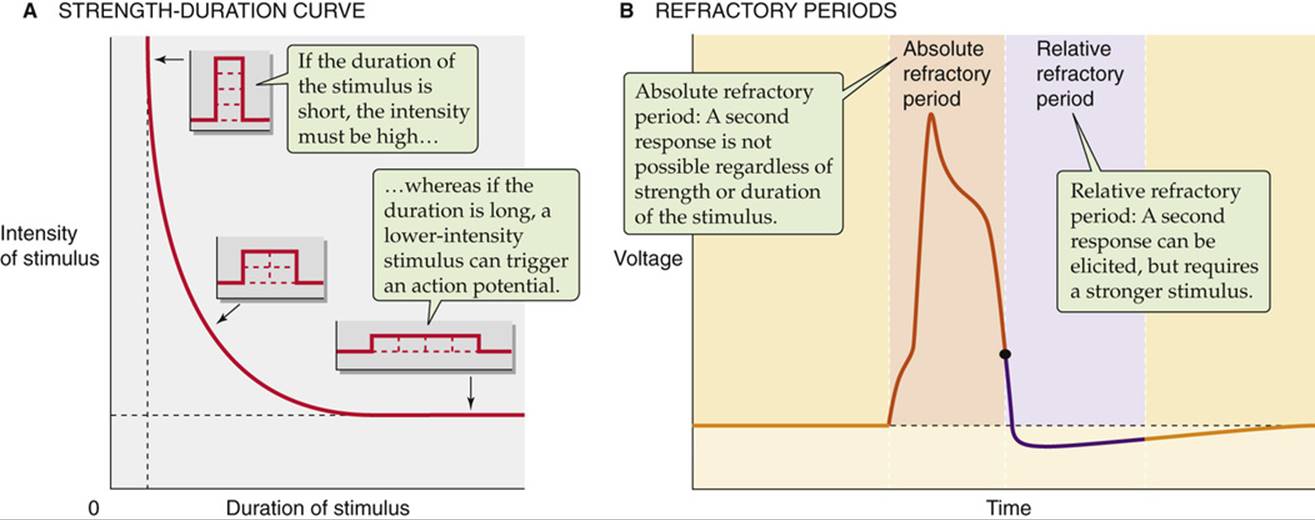
FIGURE 7-3 Determinants of nerve and muscle excitability. The curve in A represents the combination of the minimum stimulus intensity and duration that is required to reach threshold and to evoke an action potential. B shows a typical action potential with corresponding refractory periods.
N7-2
Rheobase and Chronaxie
Contributed by Emile Boulpaep, Walter Boron
Figure 7-3A in the text shows a strength-duration curve for nerve or muscle. As the duration of a stimulus increases, the minimum intensity of stimulation required to elicit an action potential decreases. The rheobase is the minimum intensity of stimulation required to generate an action potential when the stimulation is of infinite duration (i.e., the horizontal dashed line in Fig. 7-3A). Stimuli with an intensity greater than the rheobase require shorter times. When the stimulus intensity is twice the rheobase, the minimum duration required to achieve an action potential is the chronaxie.
An important feature of excitable cells is their ability to fire repetitive action potentials. Once a cell fires an action potential, how quickly can it fire a second? Suppose we inject a small step of current to produce a graded voltage response and then add a second current step while maintaining the first step. As long as Vm does not exceed the threshold, the resulting voltage response would be a simple algebraic and instantaneous summation of the two graded responses. The situation for action potentials is quite different. First, action potentials never summate. Second, after one action potential fires, a finite time must elapse before it is possible to trigger a second. The interval after initiation of an action potential when it is impossible or more difficult to produce a second spike is the refractory period (see Fig. 7-3B). The refractory period consists of two distinct phases. The initial phase—the absolute refractory period—lasts from initiation of the spike to a time after the peak when repolarization is almost complete. Throughout this first phase, a second action potential cannot be elicited, regardless of the stimulus strength or duration. During the second phase—the relative refractory period—the minimal stimulus necessary for activation is stronger or longer than predicted by the strength-duration curve for the first action potential. The two phases of the refractory period arise from the gating properties of particular Na+ and K+channels and the overlapping time course of their currents. The refractory periods determine the upper limit of firing frequency.
The action potential arises from changes in membrane conductance to Na+ and K+
Approximately 200 years after Luigi Galvani (1737–1798) discovered “animal electricity,” (see p. 141), the electrochemical basis of the nerve action potential was finally elucidated by the combined application of modern electrical recording techniques and the theory of electrodiffusion (see pp. 146–147). We now understand that the nerve action potential is a phenomenon involving voltage-dependent currents of Na+ and K+ that flow through distinct molecular pathways called Na+ channels and K+ channels. In 1963, Alan L. Hodgkin and Andrew F. Huxley shared the Nobel Prize in Physiology or Medicine ![]() N7-3 for their quantitative description of these ionic currents in the squid giant axon in studies involving two-electrode voltage-clamp recordings.
N7-3 for their quantitative description of these ionic currents in the squid giant axon in studies involving two-electrode voltage-clamp recordings. ![]() N7-4 Invertebrate axons are unmyelinated, and axons in certain squid nerves have an unusually large diameter (500 to 1000 µm), which allows both external and internal ionic concentrations to be manipulated experimentally. The basic concepts underlying the Hodgkin-Huxley analysis have since been extended to a wide variety of voltage-dependent ionic currents.
N7-4 Invertebrate axons are unmyelinated, and axons in certain squid nerves have an unusually large diameter (500 to 1000 µm), which allows both external and internal ionic concentrations to be manipulated experimentally. The basic concepts underlying the Hodgkin-Huxley analysis have since been extended to a wide variety of voltage-dependent ionic currents.
N7-3
Alan L. Hodgkin and Andrew F. Huxley
For more information about Alan Hodgkin and Andrew Huxley and the work that led to their Nobel Prize, visit http://www.nobel.se/medicine/laureates/1963/index.html (accessed October 2014).
N7-4
Two-Electrode Voltage Clamping
Contributed by Ed Moczydlowski
Historically, the technique of two-electrode voltage clamping was first used to analyze the ionic currents in a preparation known as the perfused squid giant axon. Certain nerve fibers of the squid are so large that their intracellular contents can be extruded and the hollow fiber can be perfused with physiological solutions of various ionic composition. Electrodes in the form of thin wires can be inserted into the axon to clamp the axon membrane potential along its length and measure the current. This technique was used by Alan L. Hodgkin and Andrew F. Huxley in 1952 to deduce the nature of ionic conductance changes that underlie the nerve action potential. For this work, Hodgkin and Huxley shared (with J.C. Eccles) the Nobel Prize in Physiology or Medicine in 1963. ![]() N7-3 The Hodgkin-Huxley analysis is discussed further beginning on pages 176–177.
N7-3 The Hodgkin-Huxley analysis is discussed further beginning on pages 176–177.
Another, more recent, application of the two-electrode voltage-clamp technique is called oocyte recording (see Fig. 6-13A). A large oocyte from the African clawed frog, Xenopus laevis, is simultaneously impaled with two micropipette electrodes that serve to clamp the voltage and record current. Native Xenopus oocytes have only small endogenous currents, but they can be induced to express new currents by preinjecting the cell with messenger RNA (mRNA) transcribed from an isolated gene that codes for an ion channel protein. The oocyte system can therefore be used to characterize the conductance behavior of a relatively pure population of ion channels that are expressed in the plasma membrane after protein translation of the injected mRNA by the oocyte. This approach has proven to be an invaluable assay system for isolating complementary DNA molecules coding for many different types of channels and electrogenic transporters (see Chapter 5). This approach also has become a standard technique used to study the molecular physiology and pharmacology of ion channels.
The squid axon generates a very brief action potential signal without a significant plateau phase (Fig. 7-4). Ionic permeability changes underlying this impulse can be interpreted with a form of the constant-field equation (see Equation 6-9) that includes only Na+ and K+:
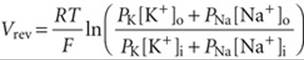
(7-1)
According to Equation 7-1, Vrev would correspond to a resting Vm of −60 mV for a K+/Na+ permeability ratio (PK/PNa) of ~14 : 1. The change in Vm to a value near +40 mV at the peak of the action potential must involve a transient and selective increase in the permeability to either Na+ or Ca2+ because the equilibrium potential of these cations lies in the positive voltage range (see Fig. 6-10). Experimentally, if [Na+]o is reduced by replacing it with a nonelectrolyte such as sucrose, the nerve action potential decreases in amplitude. Complementary experiments measuring radioactive tracer fluxes of Na+ and K+ also demonstrate that action potentials are accompanied by a small influx of Na+ and an efflux of K+. These and related findings showed that the waveform of the squid action potential is produced by separate permeability pathways for Na+ and K+.
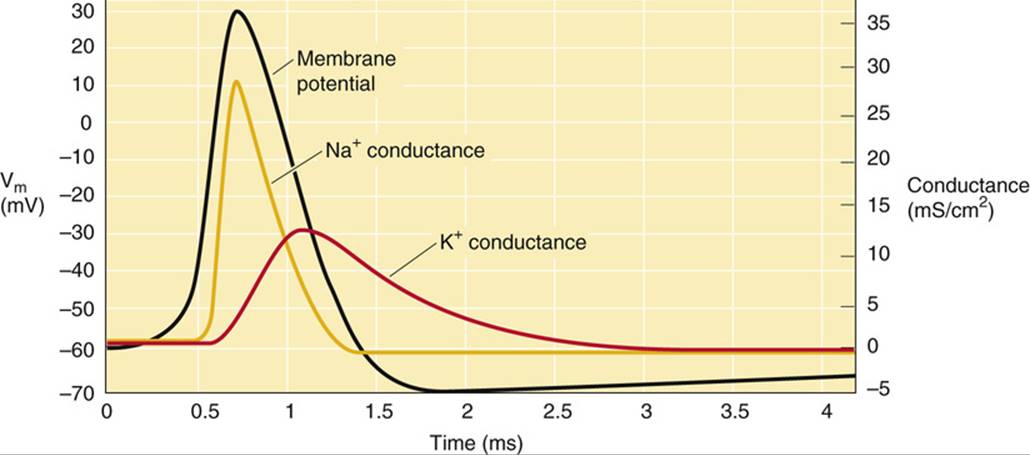
FIGURE 7-4 Changes in ionic conductance that underlie the action potential. (Data from Hodgkin AL, Huxley AF: A quantitative description of membrane current and its application to conduction and excitation in nerve. J Physiol 117:500–544, 1952.)
The time course of the action potential (see Fig. 7-4) can be dissected into an initial, transient increase in Na+ conductance (and thus permeability), followed by a similar but delayed increase in K+ conductance. As one predicts from Equation 6-12, a transient increase in Na+ conductance shifts Vm toward the positive Na+ equilibrium potential (ENa). The subsequent increase in K+ conductance shifts Vm back toward the K+equilibrium potential (EK), thereby restoring the original negative resting potential. Thus, the depolarizing and repolarizing phases of the action potential reflect a transient reversal of the ratio of K+/Na+conductances.
The Na+ and K+ currents that flow during the action potential are time and voltage dependent
The assumption of independent, distinct channels for Na+ and K+ has been verified by ion substitution and pharmacological experiments. Figure 7-5 illustrates the use of inhibitors to dissect Na+ and K+ currents (INa and IK) from the total membrane current (Im) in a typical excitable membrane preparation, such as a myelinated vertebrate nerve fiber bathed in a normal physiological solution. In a myelinated nerve, these currents flow through small segments of the bare axon that are not covered with myelin—nodes of Ranvier. The pharmacological dissection of Na+ and K+ currents allows us to determine how they depend on time and Vm.
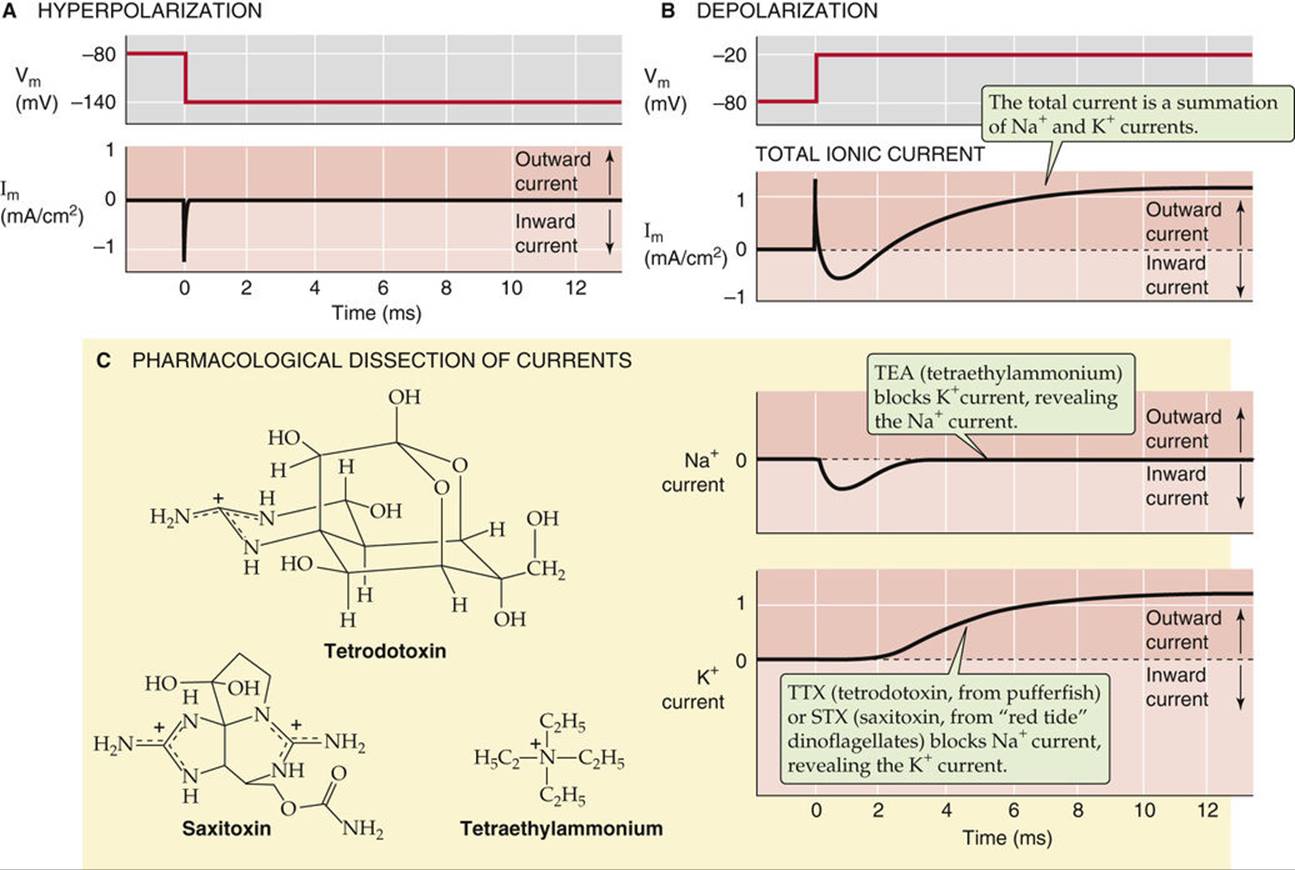
FIGURE 7-5 Dissection of Na+ and K+ currents by voltage-clamp analysis and pharmacological methods. A, In a typical voltage-clamp experiment, a sudden hyperpolarization from −80 to −140 mV results in a transient capacitative current but no ionic currents. B, In a voltage-clamp experiment, a sudden depolarization from −80 to −20 mV results in a transient capacitative current followed first by an inward ionic current and then by an outward ionic current. C, Blockade of the outward current by TEA leaves only the inward current, which is carried by Na+. Conversely, a blockade of the inward current by TTX or STX leaves only the outward current, which is carried by K+.
Time Dependence of Na+ and K+ Currents
Stepwise hyperpolarization of the nerve membrane (from a “holding potential” of −80 to −140 mV) by a voltage-clamp technique produces a transient capacitative current (see p. 151), but little or no ionic current (see Fig. 7-5A). However, a step depolarization of equivalent magnitude produces a capacitative transient current that is followed by a large, time-dependent ionic current (see Fig. 7-5B). This ionic current first flows inward, reaches a maximum in the inward direction, and then reverses to the outward direction. The initial inward current corresponds to a movement of cations into the axon. After the reversal of Im, the outward current corresponds to an outward movement of cations. Ion substitution experiments—in which selected ions are removed from either the outside or the inside of the cell—have shown that the inward current corresponds to Na+ current and the outward current corresponds to K+ current. Applying a particular organic cation, tetraethylammonium (TEA), to an axon prevents the outward IK and reveals the isolated inward INa (see Fig. 7-5C, top Im record). Conversely, adding either tetrodotoxin (TTX) or saxitoxin (STX)—which we discuss below—abolishes the inward INa and reveals the isolated outward IK (see Fig. 7-5C, bottom Im record). TEA, TTX, and STX are cationic molecules that act as specific ion channel blockers. Millimolar concentrations of TEA block the outer entrance of certain neuronal K+ channels, and nanomolar concentrations of TTX (or STX) block the outer entrance of neuronal Na+ channels. Biophysical evidence suggests that these particular molecules act by binding in the outer vestibule of their respective channels, thus occluding the channel pore to permeant ions. Therefore, the terms channel block and blocking agent are often used to describe their effect.
Voltage Dependence of Na+ and K+ Currents
The ability to use specific inhibitors to resolve separate pathways for Na+ and K+ currents in excitable membranes makes it possible to characterize how these ionic currents depend on Vm. Figure 7-6A illustrates an idealized family of records of total membrane current (Im) recorded from a myelinated nerve axon. In each case, Vm was initially clamped to −60 mV and then rapidly shifted to a more positive value. The five traces in Figure 7-6A show the current evoked by depolarizations to −45, −30, 0, +30, and +60 mV. By repeating the same experiment in the presence of TEA or TTX, one can obtain the unique time course and voltage dependence of INa and IK.
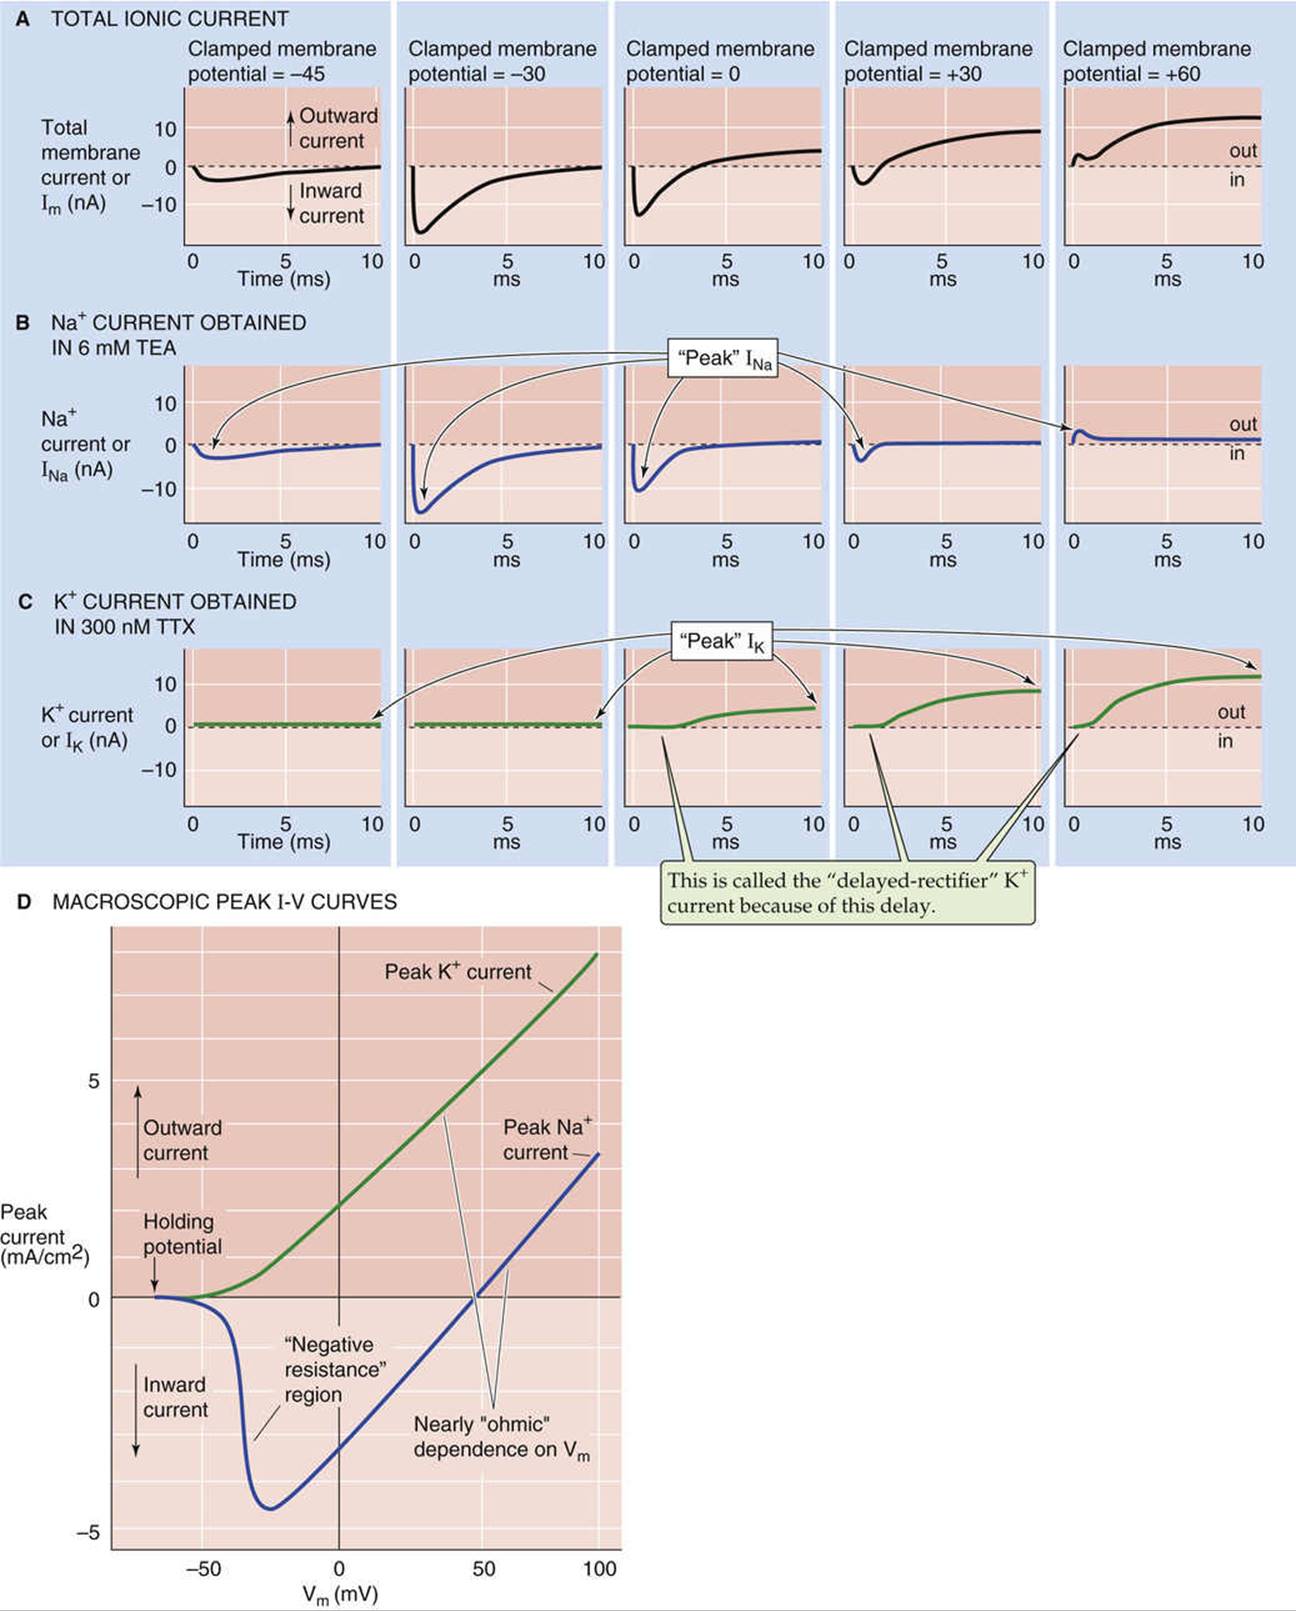
FIGURE 7-6 Voltage dependence of ionic currents. A, The top panels show the time course of the total ionic current. These data are from a voltage-clamp experiment on a frog node of Ranvier. Sudden shifting of Vm from a holding potential of −60 mV to −45, −30, 0, +30, and +60 mV elicits ionic currents that depend on Vm. B, These results are comparable to those in A, except that TEA abolished the outward K+ currents, leaving the Na+ current. Notice that the peak Na+ current varies with Vm. C, These results are comparable to those in A, except that TTX abolished the inward Na+ currents, leaving the K+ current. Notice that the peak K+ current varies with Vm. D, The blue curve is a plot of peak Na+ currents from experiments that are similar to those in B. The green curve is a plot of peak K+ currents from experiments that are similar to those in C. Notice that both the Na+ and K+ currents are linear or ohmic in the positive voltage range. In a more negative Vm range, the Na+ current exhibits negative resistance; that is, the magnitude of the current becomes more negative rather than more positive as Vm increases in the positive direction. (A–C, Data from Hille B: Common mode of action of three agents that decrease the transient change in sodium permeability in nerves. Nature 210:1220–1222, 1966; and Hille B: The selective inhibition of delayed potassium currents in nerve by tetraethylammonium ions. J Gen Physiol 50:1287–1302, 1967; D, data from Cole KS, Moore JW: Ionic current measurements in the squid giant axon membrane. J Gen Physiol 44:123–167, 1960.)
The time course of INa obtained in the presence of TEA to block K+ channels is distinctly biphasic (see Fig. 7-6B). Immediately after a depolarizing voltage step to a Vm of −30 mV, for example, the inward INa(downward going) reaches a “peak” value and then returns to zero. The initial phase of this time course (before the peak) is called activation, and the later phase (after the peak) is called inactivation.
In contrast to the time course of INa, a depolarizing voltage step to a Vm of +60 mV, for example, causes the outward IK to activate with a clear delay that gives rise to a sigmoidal time course (see Fig. 7-6C). Moreover, IK takes longer than INa to reach its maximal value, which is then sustained. Thus, IK does not show significant inactivation on the same rapid time scale as does INa.
If we plot the peak Na+ and K+ currents obtained at each of the clamped voltages in Figure 7-6B and C against the clamped voltages, we obtain the two I-V relationships shown in Figure 7-6D. Because the currents in Figure 7-6B and C represent the activity of many individual ion channels, the plots in Figure 7-6D are macroscopic current-voltage relationships. The I-V relationship for K+ is the more straightforward of the two. If we step Vm from −60 mV to increasingly more positive values, the peak IK is outward and increases with voltage in a monotonic fashion, as expected from Ohm's law (ΔI = ΔV/R). Because such nerve K+ channels pass current in the outward direction and activate with a time delay (see Fig. 7-6C) under physiological conditions, the term delayed-rectifier K+ current (or delayed outwardly rectifying K+ channel) has been coined to describe them. We discuss this delayed outwardly rectifying K+ current and the K+ channel responsible for it in more detail below.
The voltage dependence of the peak Na+ current is biphasic. Stepping Vm from −60 mV to more positive values at first causes INa to become increasingly negative (i.e., inward) and then reach a peak. This portion of the Na+ I-V relationship is sometimes referred to as the negative resistance region because the negative slope corresponds to an anomalous or negative resistance value according to Ohm's law (ΔI = ΔV/R). At more positive values of Vm, the peak INa reverses direction and becomes more positive, with a nearly linear or ohmic dependence on voltage. ![]() N7-5
N7-5
N7-5
Ohmic I-V Curve
Contributed by Ed Moczydlowski
According to Ohm's law (I = V/R), the I-V relationship is a straight line if 1/R (i.e., the conductance) is constant. The slope is positive. For a simple electrical circuit consisting of a resistor and a voltage source, the line passes through the origin (i.e., I = 0 when V = 0). However, if the Na+ current (INa) were ohmic (i.e., we assume that the [Na+] is the same on both sides of the membrane), INa is zero when the driving force (Vm − ENa) is zero (see Equation 7-2 on p. 180 of the text). Therefore, the I-V plot for an Na+ current passes through the x-axis at the equilibrium potential for Na+ (ENa).
In real-life situations, the I-V curve for Na+ currents is much more complicated, following the Goldman-Hodgkin-Katz current equation, as discussed in ![]() N6-8.
N6-8.
Macroscopic Na+ and K+ currents result from the opening and closing of many channels
The complex macroscopic I-V relationships of the Na+ and K+ currents (see Fig. 7-6D) reflect the single channel conductance and gating of Na+ and K+ channels. The pore of an open channel is expected to have a linear or ohmic I-V relationship:
![]()
(7-2)
Here, ix is the single channel current and gx is the single channel conductance. We already introduced a similar relationship as Equation 6-15. Figure 7-7A illustrates the predicted linear behavior of single channel currents as a function of Vm for hypothetical Na+ and K+ channels. Assuming an Na+ reversal potential (ENa) of +50 mV, the Na+ current is zero at a Vm of +50 mV. Similarly, with an EK of −80 mV, the K+current is zero at a Vm of −80 mV. Assuming a unitary conductance of 20 picosiemens (pS) for each channel, the two I-V relationships have the same slope. Note that these idealized single channel I-V plots for Na+and K+ approximate the shape of the macroscopic peak I-V relationships of Figure 7-6D for the positive Vm range (i.e., in the right upper quadrant of Fig. 7-6D). In this Vm range, both the Na+ and K+ channels through which the currents flow are maximally activated at the peaks of their respective time courses. Thus, the macroscopic peak I-V relationships (see Fig. 7-6D) are nearly linear in this range, just as they would be for idealized, fully open channels (see Fig. 7-7A).
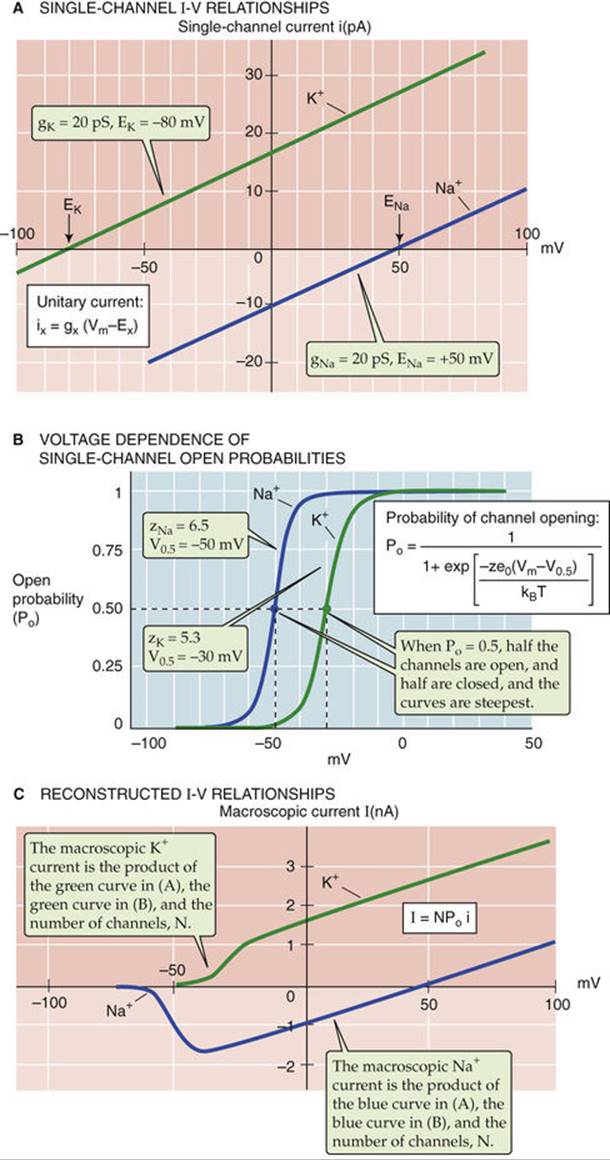
FIGURE 7-7 Microscopic basis of macroscopic I-V relationships. A, The blue line represents the I-V relationship of an idealized open Na+ channel. The green line represents the I-V relationship of an idealized open K+ channel. Because the channels are assumed always to be fully open (i.e., the conductance does not change with voltage), the current through them is linear or ohmic. B, The blue curve shows the open probability of Na+ channels. The equation in the inset will generate this curve if the values zNa = 6.5 and V0.5 = −50 mV are inserted. The green curve shows the open probability of K+ channels. The equation in the inset will generate this curve if the values zK = 5.3 and V0.5 = −30 mV are inserted. ![]() N7-6 C, We can obtain a reasonable estimate for the macroscopic Na+current and the macroscopic K+ current by multiplying the single channel current in A, the Po in B, and the number of channels (N). We assume that there are 100 Na+ and 100 K+ channels.
N7-6 C, We can obtain a reasonable estimate for the macroscopic Na+current and the macroscopic K+ current by multiplying the single channel current in A, the Po in B, and the number of channels (N). We assume that there are 100 Na+ and 100 K+ channels.
However, in the negative voltage range, the macroscopic peak I-V relationships for Na+ and K+ in Figure 7-6D deviate from the linear (or ohmic) behavior in Figure 7-7A. Why, as the voltage is made more negative, does the inward Na+ current fail to increase further and even decrease (negative resistance)? Similarly, why, as the voltage becomes more negative, does the outward K+ current fall to zero long before the voltage reaches an EK of −80 mV? The answer is that the probability that the Na+ and K+ channels are “open” (Po)—and therefore able to conduct current—depends on voltage. We introduced the concept of open probability on page 156. To see why Vm might affect Po, we consider a simplified model.
Assume that a channel protein molecule may exist in either of two conformational states, closed (C) and open (O), and that these two conformational states are in equilibrium with one another:
![]()
The equilibrium constant Keq for this reaction is the ratio of the concentrations of open to closed channels, which can also be expressed as the ratio of the probability that the channel is open (Po) to the probability that the channel is closed (Pc):
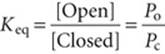
(7-3)
In the case of voltage-gated channel proteins, Vm changes affect Keq and thus the distribution of channels between the open and closed states. ![]() N7-6 The probability of a channel's being open depends on Vmaccording to a Boltzmann distribution (see Fig. 7-7B). Accordingly, if the valence (z) of the voltage-sensing part of the channel protein (i.e., the “gating charge”) is positive, the probability of channel opening should increase from 0 to 1 in a sigmoid fashion as Vm becomes more positive. Figure 7-7B shows the behavior of Po for hypothetical Na+ and K+ channels that simulate Na+ and K+ channels in real cells.
N7-6 The probability of a channel's being open depends on Vmaccording to a Boltzmann distribution (see Fig. 7-7B). Accordingly, if the valence (z) of the voltage-sensing part of the channel protein (i.e., the “gating charge”) is positive, the probability of channel opening should increase from 0 to 1 in a sigmoid fashion as Vm becomes more positive. Figure 7-7B shows the behavior of Po for hypothetical Na+ and K+ channels that simulate Na+ and K+ channels in real cells.
N7-6
Boltzmann Distribution of Voltage-Dependent Gating for Ion Channel Proteins
Contributed by Ed Moczydlowski
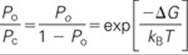
If a channel can exist only in a closed or open conformation, the sum of the channel's open probability (Po) and closed probability (Pc) must be 1, so that the equilibrium constant Keq is
![]()
(NE 7-1)
The first two equalities in the above equation are the same as Equation 7-3 in the text.
According to statistical mechanics, the relative probability that the channel is in the open versus the closed state (Po/Pc) is determined by the difference in free energy (ΔG) between the open state (Go) and closed state (Gc) of the channel. By applying the Boltzmann distribution—a law of physical chemistry that describes the statistical distribution of states or chemical species in a chemical equilibrium—we find that
(NE 7-2)
Here, kB is the Boltzmann constant (1.381 × 10⁻²³ J K−1) and T is the absolute temperature. According to Equation NE 7-2, when half of the channels are open and half are closed (i.e., Po = 0.5 and Po/Pc = 1), ΔG must be zero. In other words, if the energy of the open state is the same as the energy of the closed state, there ought to be an equal number of channels in each state. The free energy ΔG for opening a voltage-gated channel may be thought of as a sum of two terms, a chemical free-energy difference (ΔGchem) and an electrical free-energy difference (ΔGelec). The ΔGchem term describes the difference in free energy between the open and closed conformational states of a single channel protein in the absence of an applied electric field. The ΔGelec term describes the energy expended when an electrically charged portion of the channel protein molecule is moved by the electric field as the channel opens. Thus, the total change in free energy for opening a voltage-gated channel is the sum of the chemical and electrical terms:
![]()
(NE 7-3)
Note that this equation is similar to Equation 5-6, which we introduced to describe the electrochemical potential difference (i.e., ![]() ) for a mole of ions X.
) for a mole of ions X. ![]() N5-3 The difference is that, here, we are applying Equation NE 7-3 to a single channel molecule. We already saw in Chapter 5 that the electrical term for a mole of X is the product zFVm, where z is the valence and F is the charge on a mole of particles. Likewise, the electrical term ΔGelec for a single molecule is the product of the valence (z) of the moving portion of the channel protein (the “voltage sensor”), the elementary charge (e0 = 1.602 × 10⁻¹⁹ coulomb) and the applied membrane voltage, Vm. Thus,
N5-3 The difference is that, here, we are applying Equation NE 7-3 to a single channel molecule. We already saw in Chapter 5 that the electrical term for a mole of X is the product zFVm, where z is the valence and F is the charge on a mole of particles. Likewise, the electrical term ΔGelec for a single molecule is the product of the valence (z) of the moving portion of the channel protein (the “voltage sensor”), the elementary charge (e0 = 1.602 × 10⁻¹⁹ coulomb) and the applied membrane voltage, Vm. Thus,
![]()
(NE 7-4)
Note that ze0Vm is the energy required to move the charge of the channel's “voltage sensor” across the electric field of the whole membrane.
In deriving an expression for Po, it is helpful to express ΔGchem in electrical terms. As noted above, when half the channels are open and half are closed (i.e., Po = Pc = 0.5), ΔG is zero. Equation NE 7-4 thus becomes
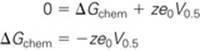
(NE 7-5)
Here, V0.5 is the voltage at which Po is 0.5. Combining Equations NE 7-4 and NE 7-5, we have
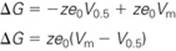
(NE 7-6)
Equation NE 7-6 may be substituted into Equation NE 7-2 and rearranged to yield the following expression for the dependence of open probability on voltage:
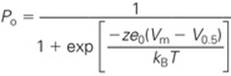
(NE 7-7)
The above equation appears in the text as the inset to Figure 7-7B.
To summarize, Figure 7-7A shows that once a single channel is open, the current flowing through the open channel is linearly related to Vm. Figure 7-7B shows that the likelihood that the channel is open depends on Vm in a sigmoid fashion. The actual macroscopic current (IX) depends on the number of channels (N) in the area of membrane being sampled, the open probability, and the single channel current, as we already pointed out in Equation 6-21:
![]()
(7-4)
Thus, we can use Equation 7-4 to compute the macroscopic currents (I) contributed by our hypothetical Na+ and K+ channels. We merely multiply the number of channels (which we assume to be 100 for both cations), the open probability for Na+ and K+ channels in Figure 7-7B, and the single channel currents for Na+ and K+ in Figure 7-7A. If we compare the resulting hypothetical INa and IK curves in Figure 7-7C, which are based on a simple theory, with actual data on macroscopic I-V relationships (see Fig. 7-6D), we see that this model provides a reasonable description of voltage-sensitive ionic currents.
The Hodgkin-Huxley model predicts macroscopic currents and the shape of the action potential
Even before the concepts of single channels and channel proteins emerged, Hodgkin and Huxley in 1952 formulated voltage-dependent and time-dependent parameters to predict the ionic currents that underlie the action potential of the squid giant axon. Hodgkin and Huxley defined a series of three dimensionless parameters, n, m, and h, each of which can have a value between 0 and 1. The activation parameter n describes the probability that the K+ channels are open (Fig. 7-8A). The activation parameter m describes the probability that the Na+ channels are open (see Fig. 7-8B, blue curve). Because Hodgkin and Huxley observed that the Na+ current inactivates, they introduced the inactivation parameter h to describe this process (see Fig. 7-8B, violet curve).
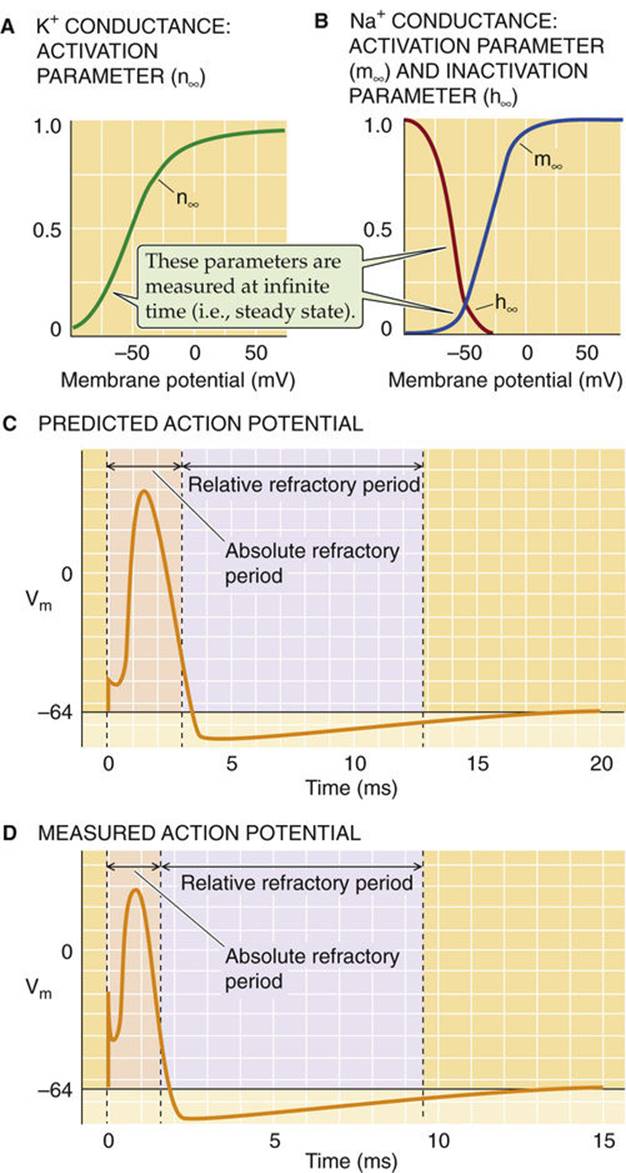
FIGURE 7-8 Voltage-dependent parameters of the HH model and their use in predicting the shape of the action potential. A, The n parameter describes the probability that each of four “particles” in the K+ channel is in the proper state for channel opening. It is believed that these four particles are the gates of the four K+ channel subunits. The parameter plotted here is the value of n at infinite time. B, The m parameter describes the probability that each of three particles in the Na+ channel is in the proper state for channel opening. The h parameter describes the probability that an inactivation particle is not in the proper state for inactivating the Na+ channel. Thus, a high h favors the open state of the channel. The parameters plotted here are the values of m and h at infinite time. C, Hodgkin and Huxley used data similar to those in A and B to compute the time course of an action potential in the squid giant axon. D, The actual data are very similar to the computed action potential in C. (Data from Hodgkin AL, Huxley AF: A quantitative description of membrane current and its application to conduction and excitation in nerve. J Physiol 117:500–544, 1952.)
Hodgkin and Huxley developed an equation for total membrane current (Im) and used it to predict the shape of the action potential in the squid giant axon. ![]() N7-7 Figure 7-8C shows their predicted action potential, which is triggered by a brief depolarization. Figure 7-8D shows an actual recording. The close agreement between the Hodgkin-Huxley (HH) theory and experimental results indicates that this model provides a reasonable description of nerve excitation. The fundamental observation of Hodgkin and Huxley was that an increase in Na+ conductance causes the upswing or depolarizing phase of the action potential as Vm rapidly approaches ENa, whereas inactivation of Na+ conductance and delayed activation of K+ conductance underlie the repolarization of Vm to its resting value near EK. The importance of the HH model in electrophysiology is that it was the first analysis to accurately describe the time course and voltage dependence of ionic currents that occur during an action potential.
N7-7 Figure 7-8C shows their predicted action potential, which is triggered by a brief depolarization. Figure 7-8D shows an actual recording. The close agreement between the Hodgkin-Huxley (HH) theory and experimental results indicates that this model provides a reasonable description of nerve excitation. The fundamental observation of Hodgkin and Huxley was that an increase in Na+ conductance causes the upswing or depolarizing phase of the action potential as Vm rapidly approaches ENa, whereas inactivation of Na+ conductance and delayed activation of K+ conductance underlie the repolarization of Vm to its resting value near EK. The importance of the HH model in electrophysiology is that it was the first analysis to accurately describe the time course and voltage dependence of ionic currents that occur during an action potential.
N7-7
Classical Hodgkin-Huxley Model of the Action Potential
Contributed by Ed Moczydlowski
The HH analysis follows basic principles similar to the simple two-state (i.e., closed-open) model of single channel gating that we described in Equation 7-3. The HH analysis provides a description of macroscopic currents for Na+ (INa) and K+ (IK), but relates these macroscopic currents not to single channel currents but to the maximal conductance of the membrane to Na+ (![]() ) or K+ (
) or K+ (![]() ). In the single channel/Boltzmann model,
). In the single channel/Boltzmann model, ![]() N7-6 these maximal conductances would be achieved when Po is 1. Thus,
N7-6 these maximal conductances would be achieved when Po is 1. Thus, ![]() or
or ![]() would be the product of the single channel conductance (gNa or gK) and the number of open channels (N). In the HH analysis, the probability of observing the maximal conductance is described by three empirical voltage-sensitive parameters, m and h for the Na+ conductance and n for the K+conductance. Like Po in the single channel/Boltzmann model, m, h, and n vary between 0 and 1. The original HH equations for macroscopic K+ and Na+ current are
would be the product of the single channel conductance (gNa or gK) and the number of open channels (N). In the HH analysis, the probability of observing the maximal conductance is described by three empirical voltage-sensitive parameters, m and h for the Na+ conductance and n for the K+conductance. Like Po in the single channel/Boltzmann model, m, h, and n vary between 0 and 1. The original HH equations for macroscopic K+ and Na+ current are
![]()
(NE 7-8)
![]()
(NE 7-9)
Here, Vm is the membrane potential, EK is the equilibrium potential for K+, and ENa is the equilibrium potential for Na+.
Hodgkin and Huxley used the parameter n to describe the probability (which varies from 0 to 1) that an activating “particle” or gate is in a permissive configuration for K+ channel opening. However, they found it necessary to use the fourth power of n to account for the sigmoid-shaped time dependence (or lag phase) for K+-current activation. The molecular interpretation of this n4 dependence is that four independent activation (or gating) particles must be in a permissive state for a single channel to open.
Similarly, the m3 parameter in Equation NE 7-9 is the probability of Na+ channel opening. In molecular terms, this m3 dependence states that three independent gating particles must be in a permissive configuration for opening to occur. In order to account for the inactivation phase of the Na+ current, Hodgkin and Huxley proposed that the channel has a separate inactivation gate described by the parameter h in Equation NE 7-9. The h parameter is defined as the probability (from 0 to 1) that the channel is not inactivated. Thus, when m and h are both 1, the current is maximal.
The n, m, and h probability parameters of the HH model depend on Vm according to a Boltzmann distribution function like that in ![]() N7-6. The green curve in Figure 7-8A shows the steady-state dependence of the n parameter (which governs
N7-6. The green curve in Figure 7-8A shows the steady-state dependence of the n parameter (which governs ![]() ) on Vm, as derived by Hodgkin and Huxley. Because this parameter is measured at infinite time, it is represented as n∞. Figure 7-8B shows the same for the two steady-state parameters that govern
) on Vm, as derived by Hodgkin and Huxley. Because this parameter is measured at infinite time, it is represented as n∞. Figure 7-8B shows the same for the two steady-state parameters that govern ![]() , m∞ (blue curve) and h∞ (red curve). The dependence of n∞ and m∞ on Vm determines the voltage range for activation of the K+ and Na+ currents, respectively. The h∞ parameter for inactivation of the Na+ current spans a voltage range that is more negative than activation described by the m∞ parameter. Thus, any voltage capable of activating the Na+ channel also promotes inactivation. The reason Na+ channels are able to open first, before closing, is that once a depolarization is initiated, activation occurs faster than inactivation. (Note that the m∞ and h∞ parameters describe m and h at infinite time and make no statement about how rapidly m reaches m∞, or h reaches h∞!)
, m∞ (blue curve) and h∞ (red curve). The dependence of n∞ and m∞ on Vm determines the voltage range for activation of the K+ and Na+ currents, respectively. The h∞ parameter for inactivation of the Na+ current spans a voltage range that is more negative than activation described by the m∞ parameter. Thus, any voltage capable of activating the Na+ channel also promotes inactivation. The reason Na+ channels are able to open first, before closing, is that once a depolarization is initiated, activation occurs faster than inactivation. (Note that the m∞ and h∞ parameters describe m and h at infinite time and make no statement about how rapidly m reaches m∞, or h reaches h∞!)
In their analysis of the squid axon action potential, Hodgkin and Huxley modeled the axon membrane as an equivalent electrical circuit that included ![]() and
and ![]() —which we have just discussed—as well as a leak component (
—which we have just discussed—as well as a leak component (![]() )—which corresponds to unspecified ohmic background conductance attributable to other types of K+ channels and Cl− channels—and a membrane capacitance (Cm). The HH theory predicts that the total membrane current (Im) is a sum of the capacitative current and the various ionic currents (see Equation 6-19 in the text). For the HH model,
)—which corresponds to unspecified ohmic background conductance attributable to other types of K+ channels and Cl− channels—and a membrane capacitance (Cm). The HH theory predicts that the total membrane current (Im) is a sum of the capacitative current and the various ionic currents (see Equation 6-19 in the text). For the HH model,
![]()
(NE 7-10)
Hodgkin and Huxley used this equation to predict the shape of the action potential in the squid giant axon. A comparison of their prediction (see Fig. 7-8C) with an actual record of an action potential from the squid giant axon (see Fig. 7-8D) shows that their theory does a very good job of describing this phenomenon.
In addition to delineating the basis of the action potential waveform, the HH model also explains threshold behavior and the refractory period. For an action potential to fire, an external stimulus must depolarize the membrane above threshold to activate a sufficient number of Na+ channels. The external stimulus can come from an electrode, a synaptic event, or propagation of a depolarizing wave along the cell membrane. What determines whether a stimulus will be sufficient to reach the threshold Vm for firing of an action potential? The number of Na+ channels activated by the stimulus is determined by the voltage dependence of the activation process (i.e., m parameter). Opposing the local depolarization that is produced by the current flowing through these Na+ channels are current losses that occur because of passive spread of the current through intracellular and extracellular fluid (see the discussion of cable theory on pp. 201–203). Also opposing depolarization is the hyperpolarizing effect of currents through any open K+ or Cl− channels in the membrane. Thus, the threshold is the level of depolarization at which the depolarizing effect of the open Na+ channels becomes sufficiently self-reinforcing to overcome these opposing influences. Once threshold is reached, further activation of Na+ channels rapidly drives Vm toward ENa.
The basis of the absolute refractory period, the time during which a second action potential cannot occur under any circumstances, is Na+ channel inactivation. In other words, it is impossible to recruit a sufficient number of Na+ channels to generate a second spike unless previously activated Na+ channels have recovered from inactivation (i.e., h parameter), a process that takes several milliseconds. The relative refractory period, during which a stronger than normal stimulus is required to elicit a second action potential, depends largely on delayed K+ channel opening (i.e., n parameter). In other words, for a certain period after the peak of the action potential, the increased K+ conductance tends to hyperpolarize the membrane, so a stronger depolarizing stimulus is required to activate the population of Na+ channels that in the meantime have recovered from inactivation.
Another key feature of the HH model is that it implies that Vm activates a channel by inducing the movement of an electrically charged gating particle or voltage sensor across the membrane. Physically, this gating could occur by the movement of a charged portion of the channel protein through all or part of the transmembrane electrical field or by the reorientation of an electrical dipole (a neutral structure with positive and negative polarity) within the electrical field of the membrane. Thus, the HH model correctly predicted that activation of a voltage-gated Na+ channel or K+ channel should be accompanied by a small movement of gating charge, which should produce a gating current. ![]() N7-8 This prediction was satisfied in 1973 when Armstrong and Bezanilla recorded a very small, rapid outward current that is activated by depolarization in a voltage-clamped squid axon in which the ionic current of the Na+ channels is completely blocked by TTX (see Fig. 7-5C, bottom Im record). This tiny, transient gating current is almost finished by the time that the slower K+ current begins to flow. The properties of such gating currents account for the voltage dependence of channel activation kinetics. Although the key features of the HH theory are correct, modern patch-clamp studies of single Na+ and K+ channels have revealed that the kinetics of channel gating are much more complicated than originally assumed. Such complexity is to be expected inasmuch as the conformational dynamics of large protein molecules cannot generally be described adequately by simple models that incorporate only a few discrete states.
N7-8 This prediction was satisfied in 1973 when Armstrong and Bezanilla recorded a very small, rapid outward current that is activated by depolarization in a voltage-clamped squid axon in which the ionic current of the Na+ channels is completely blocked by TTX (see Fig. 7-5C, bottom Im record). This tiny, transient gating current is almost finished by the time that the slower K+ current begins to flow. The properties of such gating currents account for the voltage dependence of channel activation kinetics. Although the key features of the HH theory are correct, modern patch-clamp studies of single Na+ and K+ channels have revealed that the kinetics of channel gating are much more complicated than originally assumed. Such complexity is to be expected inasmuch as the conformational dynamics of large protein molecules cannot generally be described adequately by simple models that incorporate only a few discrete states.
N7-8
Evidence for Gating Currents
Contributed by Emile Boulpaep, Walter Boron
Two groups of investigators, working on two different preparations, nearly simultaneously discovered the gating currents predicted 2 decades earlier by Alan Hodgkin and Andrew Huxley. In a paper published in March 1973, Martin Schneider and W. Knox Chandler demonstrated the presence of a gating current for Na+ channels in frog skeletal muscle. In a paper published in April 1973, Clay Armstrong and Pancho Bezanilla demonstrated the presence of a gating current for Na+ channels in squid giant axons.
References
Armstrong CM, Bezanilla F. Currents related to movement of the gating particles of the sodium channels. Nature. 1973;242:459–461.
Schneider MF, Chandler WK. Voltage dependent charge movement of skeletal muscle: A possible step in excitation-contraction coupling. Nature. 1973;242:244–246.